
6.6 KiB
Name
基于SuperTrend的趋势跟踪策略Advanced-SuperTrend-Tracking-Strategy
Author
ChaoZhang
Strategy Description
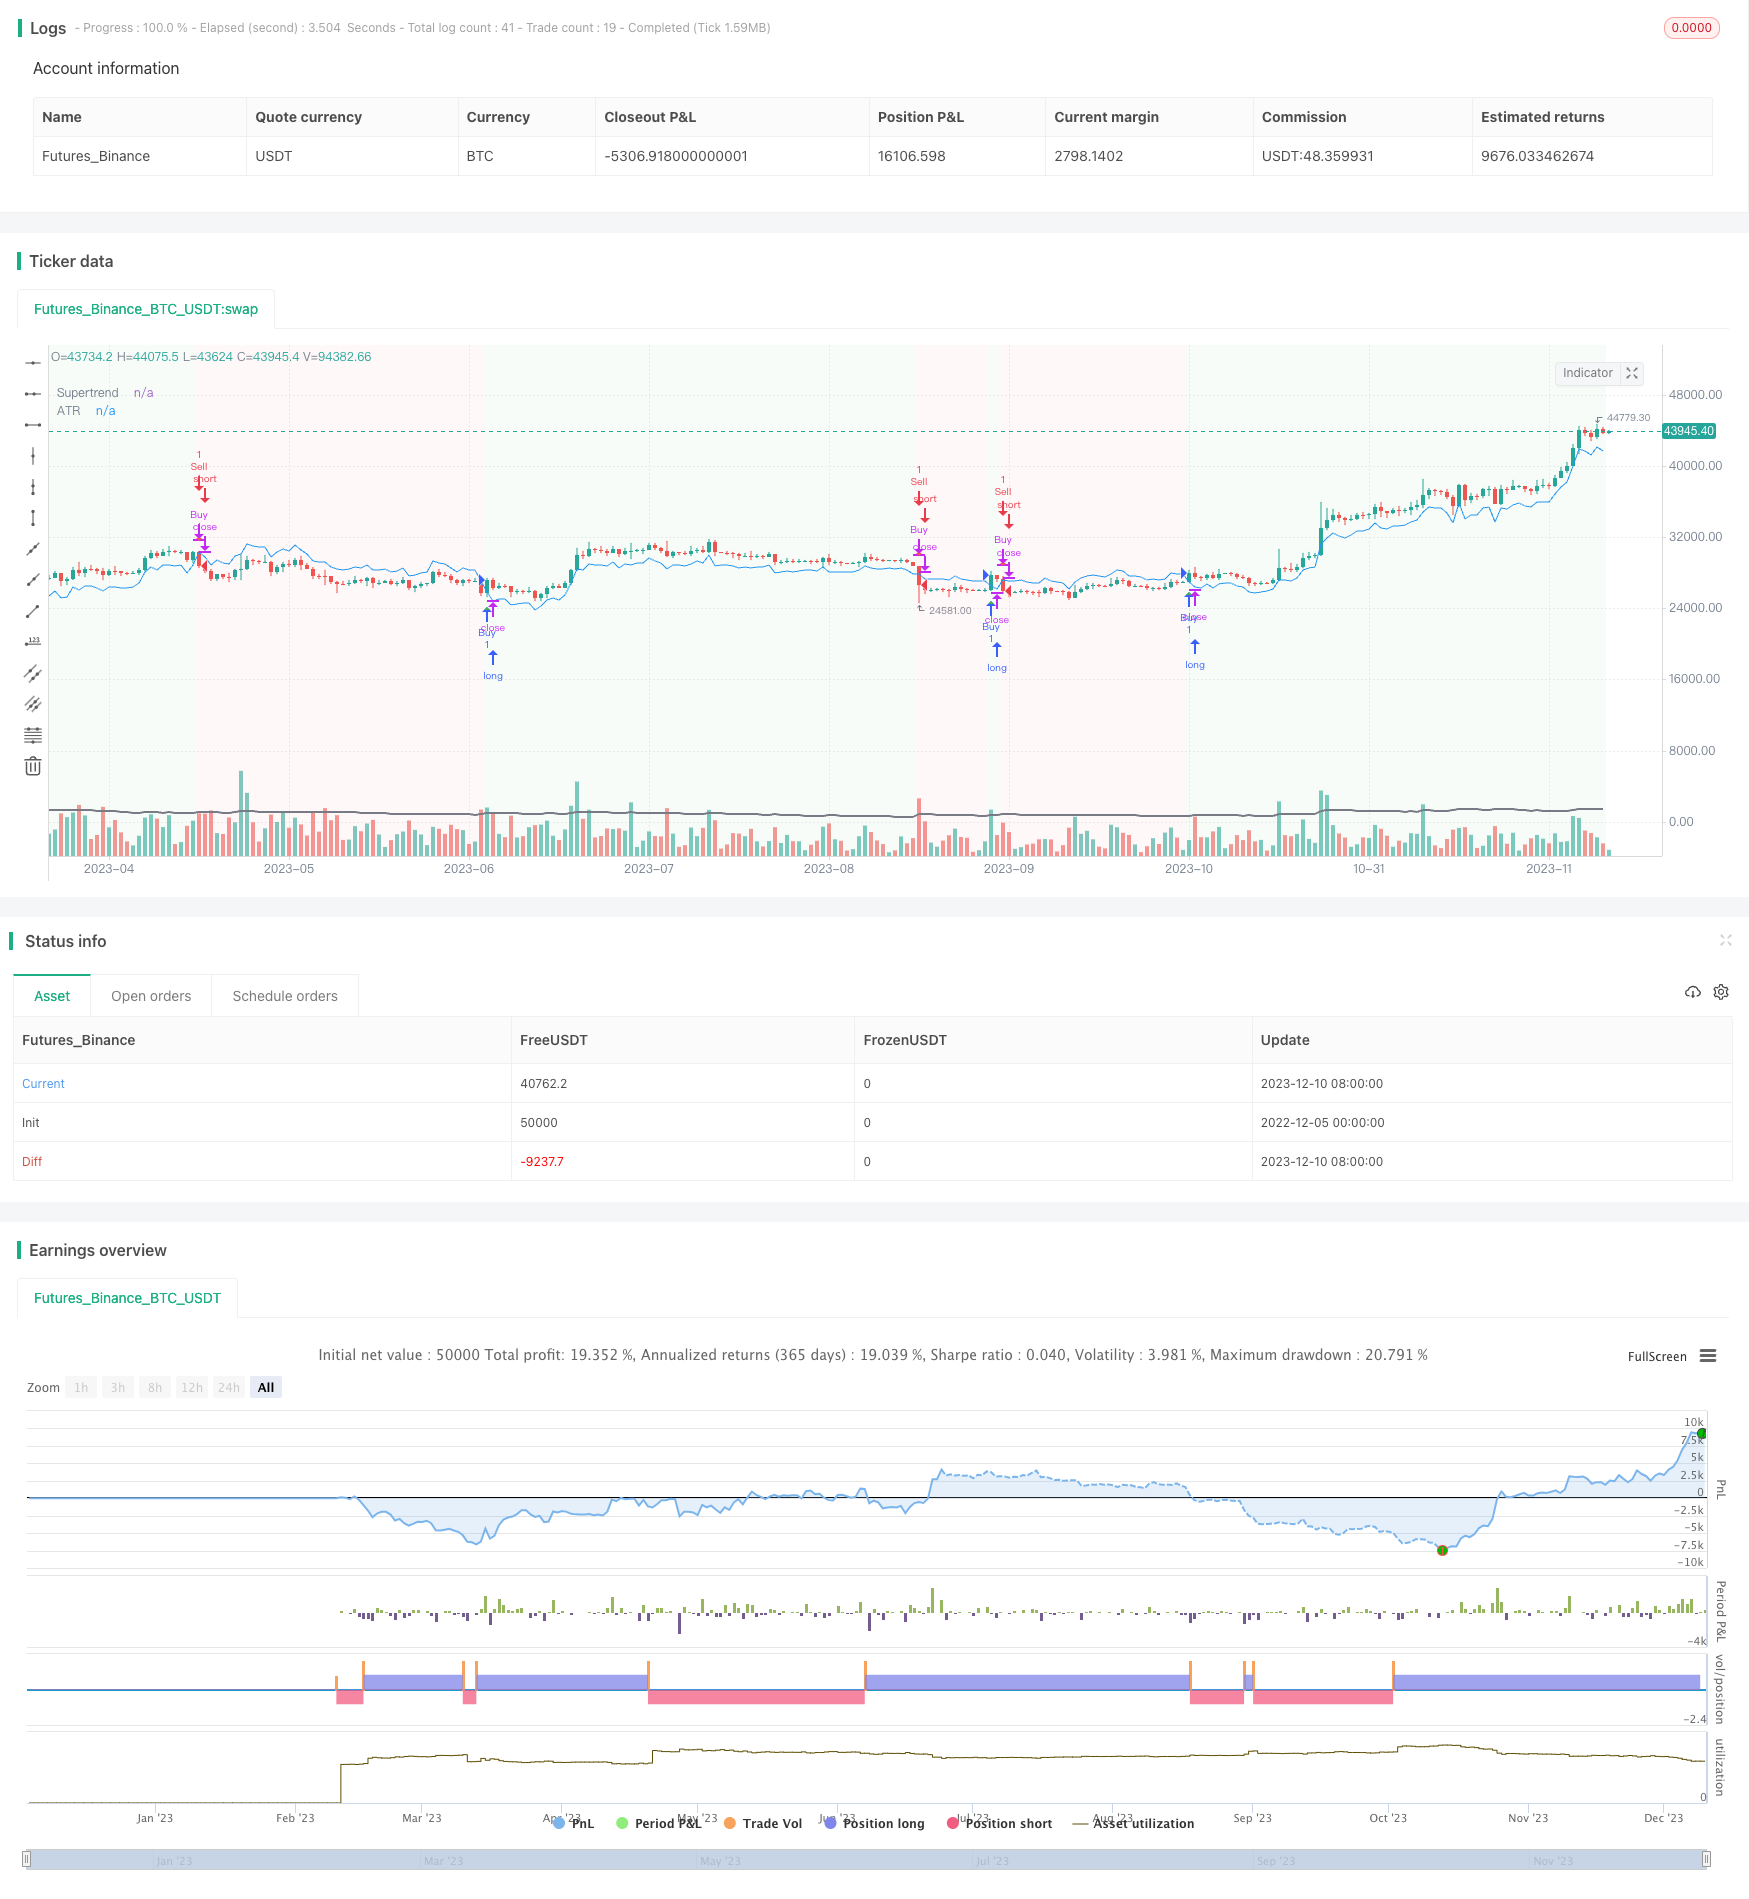 [trans]
基于SuperTrend指标的趋势跟踪策略。该策略利用SuperTrend指标判断趋势方向,结合ATR指标设定止损止盈,实现低风险趋势跟踪。
策略原理
该策略的核心指标是SuperTrend,SuperTrend指标结合ATR,根据价格的突破来判断趋势方向。具体计算方法如下:
上轨线:上轨线=当前价-(ATR乘以乘数) 下轨线:下轨线=当前价+(ATR乘以乘数)
当价格高于上轨线时,为看涨趋势;当价格低于下轨线时,为看跌趋势。
策略基于SuperTrend指标判断趋势方向,在看涨趋势时做多,看跌趋势时做空。同时,策略利用ATR指标的平均波动范围来设置止损止盈位置,控制风险。
策略优势
- 利用SuperTrend指标判断趋势,可准确捕捉市场趋势
- ATR止损止盈,有效控制单笔损失
- 结合趋势和止损,整体实现高胜率交易
- 容易入市容易止损,适合短线跟踪
策略风险
- SuperTrend指标存在repaint问题,不能完全依赖信号入市
- ATR指标对剧烈行情无法完全适应,止损过密容易被止损
- 策略本身无法判断趋势质量,需要人工校验趋势
风险解决方法: 1)人工校验趋势质量,避免在假突破上做反向操作 2)适当宽松止损点,防止在正常波动中被小幅止损
策略优化方向
- 增加多因子校验,判断趋势质量
- 结合波动率指标动态调整ATR参数
- 增加机器学习模型辅助判断交易时机
- 优化止损机制,防止正常波动被止损
总结:本策略利用SuperTrend指标判断趋势方向,ATR指标设置止损止盈,实现低风险趋势跟踪交易。策略思路清晰易于理解,可根据自身风险偏好调整参数,是一种通用型的趋势跟踪策略。但策略本身无法判断趋势质量,建议与其他指标或模型配合使用,降低误操作风险。
||
The strategy uses the SuperTrend indicator to determine the trend direction and combines the ATR indicator to set stop loss and take profit to achieve low risk trend following.
Strategy Principle
The core indicator of this strategy is SuperTrend. SuperTrend indicator combines ATR to judge the trend direction based on price breakthroughs. The specific calculation method is as follows:
Upper Band: Upper Band = Current Price - (ATR x Multiplier) Lower Band: Lower Band = Current Price + (ATR x Multiplier)
When the price is higher than the upper band, it is an uptrend; when the price is lower than the lower band, it is a downtrend.
The strategy determines the trend direction based on the SuperTrend indicator, goes long in an uptrend and goes short in a downtrend. At the same time, the strategy uses the average fluctuation range of the ATR indicator to set stop loss and take profit positions to control risks.
Advantages of the Strategy
- Use SuperTrend indicator to determine the trend and accurately capture market trends
- ATR stop loss and take profit effectively controls single loss
- Combining trend and stop loss realizes overall high winning rate trading
- Easy to enter the market and easy to stop loss, suitable for short term tracking
Risks of the Strategy
- SuperTrend indicator has repaint problems, cannot completely rely on signals to enter the market
- ATR indicator cannot completely adapt to violent fluctuations, stop loss is too close and tends to be stopped out
- The strategy itself cannot judge the quality of the trend and requires manual verification
Risk Mitigation Methods:
- Manually verify the quality of the trend to avoid reverse operations during false breakouts
- Appropriately loosen the stop loss point to prevent being stopped out by small fluctuations during normal volatility
Optimization Directions
- Increase multifactor verification to judge trend quality
- Combine volatility indicators to dynamically adjust ATR parameters
- Add machine learning models to assist in judging entry and exit timing
- Optimize stop loss mechanism to prevent normal fluctuations from being stopped out
In summary, this strategy uses the SuperTrend indicator to determine the trend direction and sets stop loss and take profit with the ATR indicator to achieve low risk trend following trading. The strategy idea is clear and easy to understand. Parameters can be adjusted according to personal risk preferences. It is a versatile trend tracking strategy. However, the strategy itself cannot judge the quality of the trend, so it is recommended to use with other indicators or models to reduce the risk of misoperation.
[/trans]
Strategy Arguments
| Argument | Default | Description |
|---|---|---|
| v_input_1 | 14 | ATR Length |
| v_input_2 | 1.5 | Multiplier |
Source (PineScript)
/*backtest
start: 2022-12-05 00:00:00
end: 2023-12-11 00:00:00
period: 1d
basePeriod: 1h
exchanges: [{"eid":"Futures_Binance","currency":"BTC_USDT"}]
*/

//@version=5
strategy("Advanced Trend Strategy", overlay=true)

// Input parameters
length = input(14, title="ATR Length")
multiplier = input(1.5, title="Multiplier")
src = close

// Calculate ATR
atr_value = ta.atr(length)

// Calculate Supertrend
upst = src - multiplier * atr_value
downst = src + multiplier * atr_value

var float supertrend = na
var float trend_direction = na

if (na(supertrend))
    supertrend := upst

if (src > supertrend)
    supertrend := upst

if (src < supertrend)
    supertrend := downst

// Buy and Sell conditions
buyCondition = ta.crossover(src, supertrend)
sellCondition = ta.crossunder(src, supertrend)

// Execute Buy and Sell orders
if (buyCondition)
    strategy.entry("Buy", strategy.long)

if (sellCondition)
    strategy.close("Buy")  // Close the long position

if (sellCondition)
    strategy.entry("Sell", strategy.short)

if (buyCondition)
    strategy.close("Sell")  // Close the short position

// Plot Supertrend
plot(supertrend, color=color.blue, title="Supertrend")

// Highlight bars based on trend direction
bgcolor(src > supertrend ? color.new(color.green, 95) : src < supertrend ? color.new(color.red, 95) : na)

// Plot ATR for reference
plot(atr_value, color=color.gray, title="ATR", linewidth=2)

// Plot arrows for buy and sell signals
plotshape(buyCondition, color=color.green, style=shape.triangleup, location=location.belowbar, size=size.small, title="Buy Signal")
plotshape(sellCondition, color=color.red, style=shape.triangledown, location=location.abovebar, size=size.small, title="Sell Signal")
Detail
https://www.fmz.com/strategy/435103
Last Modified
2023-12-12 12:27:36