
8.9 KiB
Name
基于KST指标和EMA指标的交易策略KST-EMA-Momentum-Trend-Following-Strategy
Author
ChaoZhang
Strategy Description
 [trans]
概述
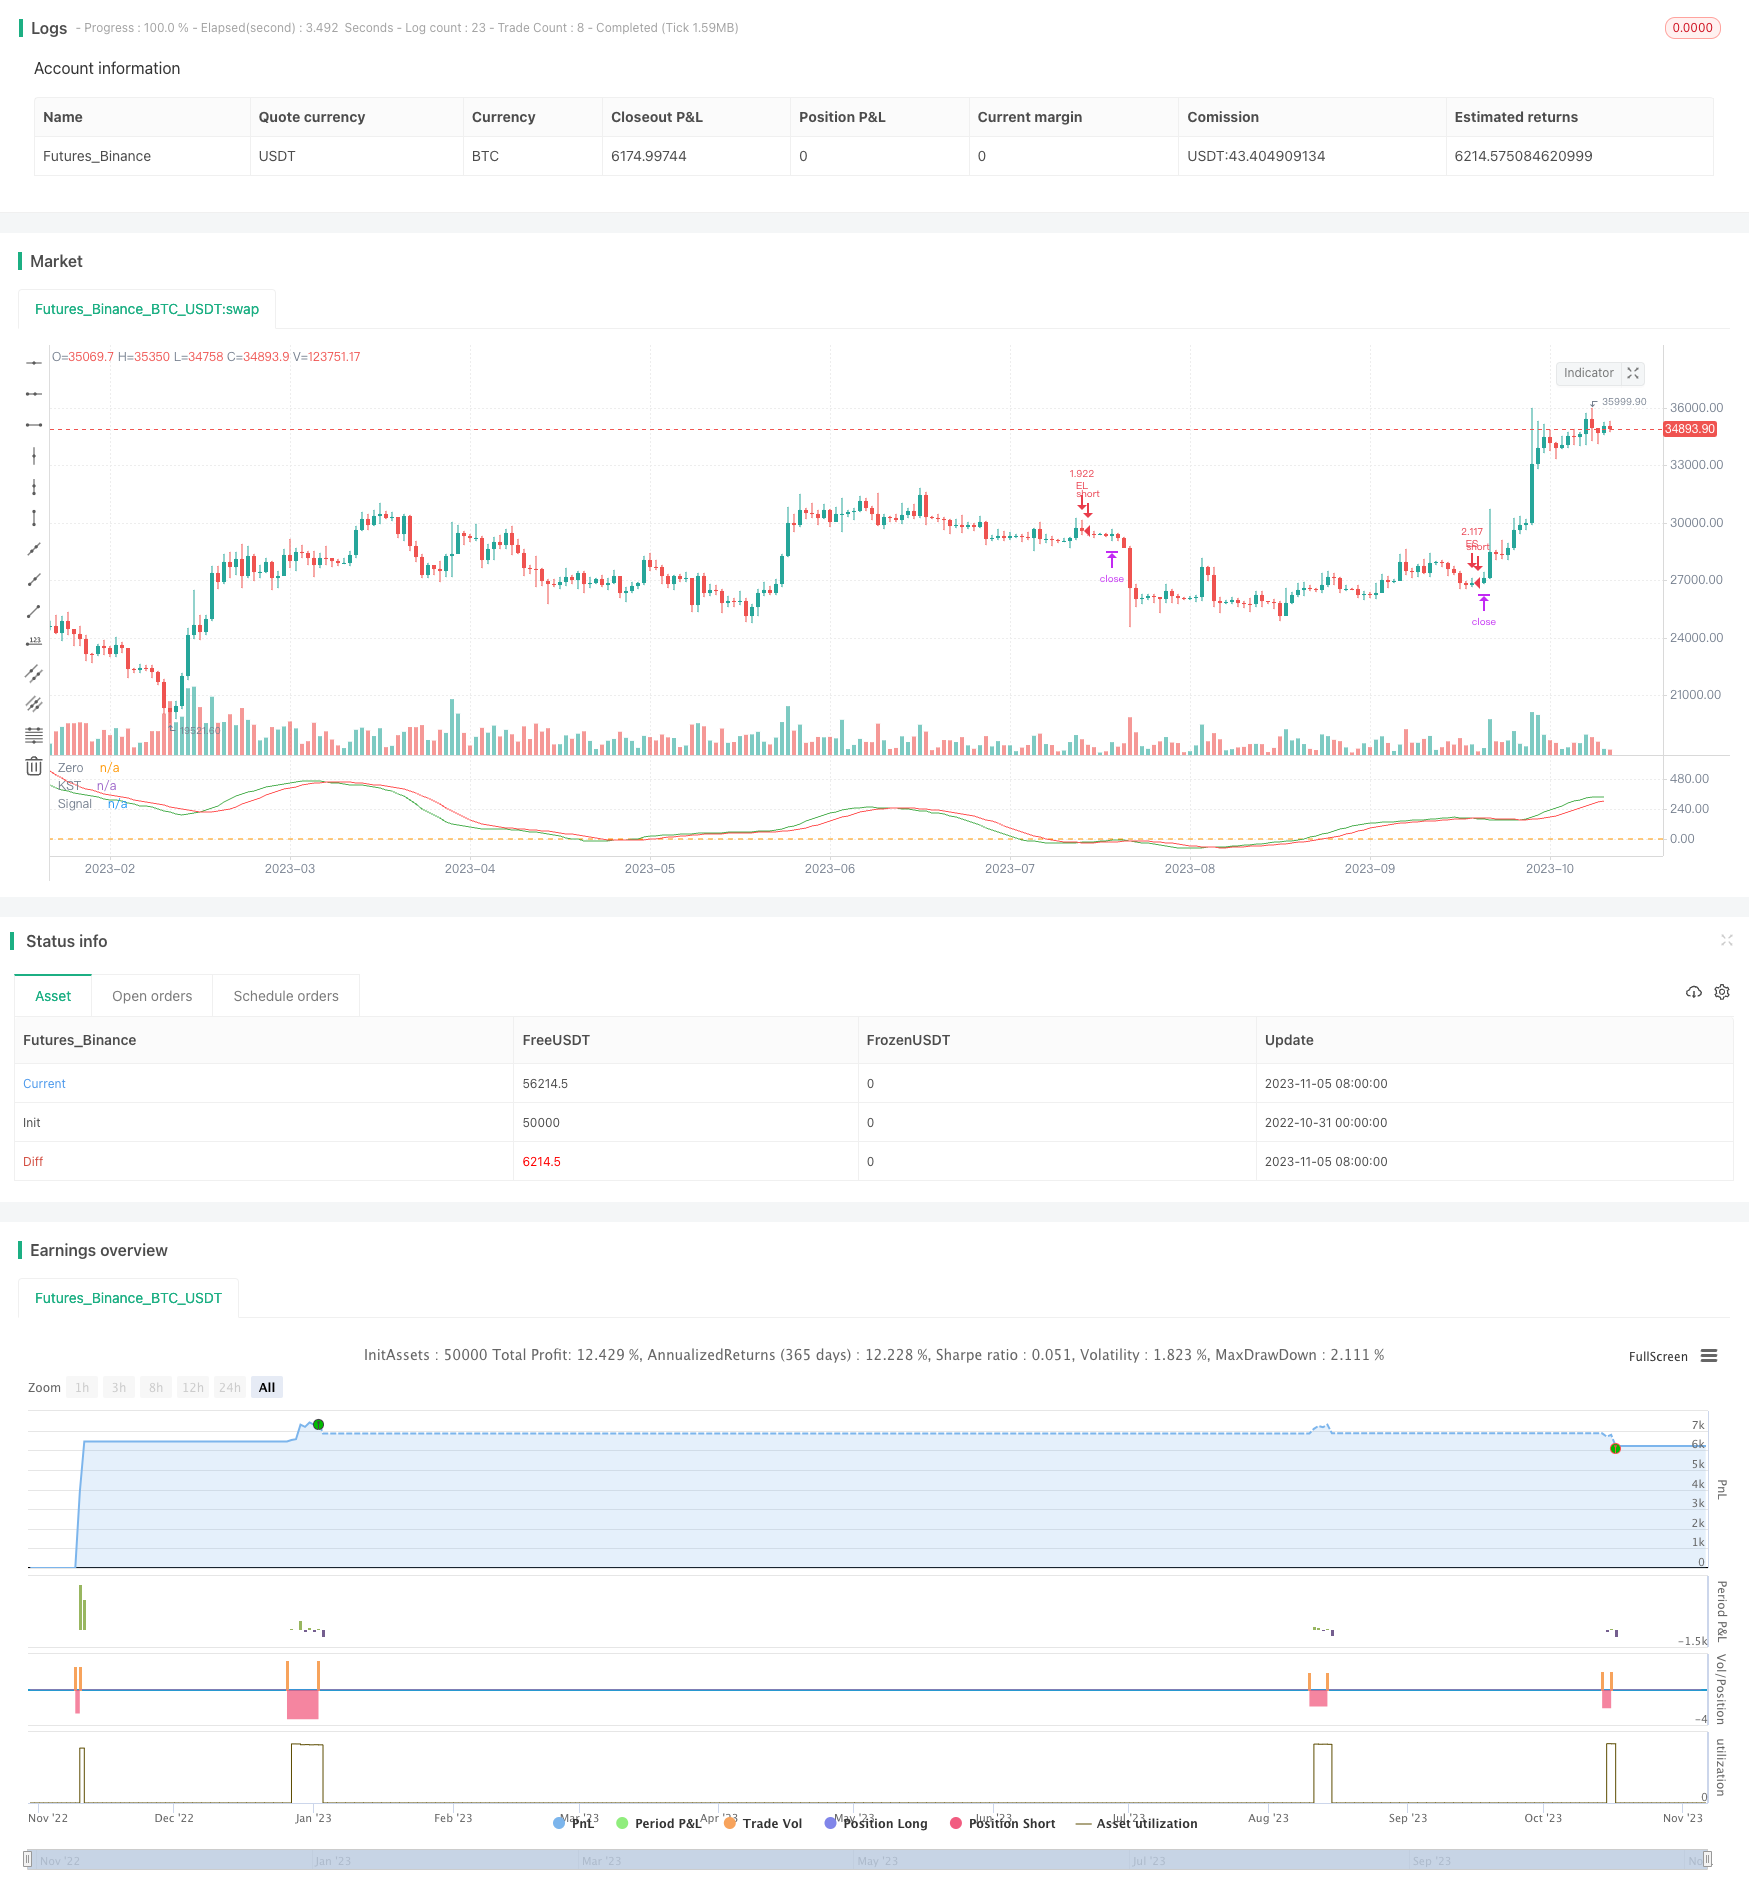
本策略的核心思想是结合KST指标和EMA均线,实现对趋势的判断和跟随。当KST指标出现金叉并低于0时买入,当出现死叉并高于0时卖出。同时结合EMA均线作为支撑阻力,只有收盘价突破EMA均线时才发出交易信号。该策略简单实用,可以自动跟踪趋势,适合中长期持仓。
策略原理
-
计算KST指标:分别计算10日、15日、20日、30日的ROC指标,再分别对其加权求和,最后通过一个9日SMA平滑得到KST指标。
-
计算EMA均线:计算长度为50的EMA均线。
-
产生买入信号:当KST指标的快线上穿慢线(金叉)并低于0,同时收盘价高于EMA均线时,产生买入信号。
-
产生卖出信号:当KST指标的快线下穿慢线(死叉)并高于0,同时收盘价低于EMA均线时,产生卖出信号。
-
设置移动止损:跟踪止损设置为账户价值的1%,实现自动止损。
策略优势
-
KST指标可以识别趋势变化,EMA均线可以确认趋势方向,二者结合可以准确判断ENTRY时机。
-
采用快慢交叉结合0轴判断KST指标方向,避免无谓交易。
-
EMA均线作为支撑阻力,进一步过滤假信号,只在突破EMA时入场。
-
自动跟踪止损来控制风险,让盈利运行。
-
策略参数较少,容易实现和优化。
策略风险
-
KST指标对趋势变化判断有滞后,可能错过部分机会。可以缩短计算周期或优化加权方式。
-
EMA均线有滞后性,在趋势转折点可能失效。可以试验其他指标或多均线组合。
-
止损设置过于宽松会让亏损扩大;过于紧凑会被隔夜大幅波动止损。需要仔细测试找到平衡点。
-
策略信号频繁,交易成本可能较高。可以适当放宽入场条件,减少交易次数。
策略优化方向
-
优化KST指标的计算周期参数,找到对特定品种更敏感的参数组合。
-
测试不同的均线指标或组合,如MA、WMA等,看哪种与KST配合效果更好。
-
尝试根据波动率或ATR动态调整止损幅度。
-
增加过滤条件,如交易量突增等,避免被套。
-
考虑结合其他指标,如RSI、MACD等,使策略更全面。
-
测试不同品种参数效果,制定适应不同品种的优化方案。
总结
本策略整体思路清晰、可靠、容易实现,通过KST指标判断趋势转折,EMA均线进一步过滤,止损控制风险,可以自动跟踪中长线趋势。参数选取合理、优化空间大,用户可以根据需要调整参数,适用于不同品种,具有良好的普适性。本策略既适合新手学习,也可为专业交易者提供方向。通过继续优化测试,本策略有望成为稳定可靠的趋势跟随策略。
||
Overview
The core idea of this strategy is to combine the KST indicator and EMA lines to identify and follow trends. It generates buy signals when the KST indicator crosses above 0 and closes above the EMA line, and sell signals when it crosses below 0 and closes below the EMA line. This simple and practical strategy can automatically track trends and is suitable for medium to long term holdings.
Strategy Logic
-
Calculate the KST indicator: Compute the ROC of 10, 15, 20 and 30 periods, take a weighted sum, and smooth it with a 9-period SMA to derive the KST indicator.
-
Calculate the EMA line: Compute a 50-period EMA line.
-
Generate buy signal: When the fast KST line crosses above the slow KST line (golden cross) and is below 0, while the close is above the EMA line, a buy signal is triggered.
-
Generate sell signal: When the fast KST line crosses below the slow KST line (dead cross) and is above 0, while the close is below the EMA line, a sell signal is triggered.
-
Set trailing stop loss: The stop loss tracks 1% of account value to realize automatic stop loss.
Advantages
-
KST identifies trend changes, EMA confirms direction. Combining both accurately detects entry timing.
-
Using fast/slow crossovers and 0-line avoids unnecessary trades.
-
EMA as support/resistance further filters fake signals. Only enter on EMA breakouts.
-
Auto trailing stop loss controls risk and allows profits to run.
-
Simple parameters make implementation and optimization easy.
Risks
-
KST has lag in detecting trend changes, may miss some chances. Can shorten periods or optimize weighting.
-
EMA has lag around trend reversals. Other indicators or MA combos may work better.
-
Stop loss too wide increases losses, too tight gets stopped out by spikes. Careful testing needed to optimize.
-
Frequent signals may increase transaction costs. Can tighten entry rules to reduce trades.
Optimization Directions
-
Optimize KST periods for sensitivity to specific instruments.
-
Test other moving averages like MA, WMA to see which combines best with KST.
-
Experiment dynamic stops based on volatility metrics like ATR.
-
Add filters like volume spikes to avoid traps.
-
Consider combining with indicators like RSI, MACD for more dimensions.
-
Test parameters across instruments to optimize for each.
Conclusion
This strategy has clear, reliable logic that is easy to implement. KST identifies trend turns, EMA filters further, and stops control risk. It automatically tracks medium to long term trends. Reasonable parameters provide large optimization space. Users can tweak for different instruments. Applicable for beginners to learn and professionals to build on. With further optimization it shows promise as a robust trend following system.
[/trans]
Strategy Arguments
| Argument | Default | Description |
|---|---|---|
| v_input_1 | 10 | ROC Length #1 |
| v_input_2 | 15 | ROC Length #2 |
| v_input_3 | 20 | ROC Length #3 |
| v_input_4 | 30 | ROC Length #4 |
| v_input_5 | 10 | SMA Length #1 |
| v_input_6 | 10 | SMA Length #2 |
| v_input_7 | 10 | SMA Length #3 |
| v_input_8 | 15 | SMA Length #4 |
| v_input_9 | 9 | Signal Line Length |
| v_input_10 | 50 | Length EMA |
| v_input_11_close | 0 | Source EMA: close |
| v_input_12 | false | Offset |
| v_input_13 | true | Trail Long Loss (%) |
| v_input_14 | true | Trail Short Loss (%) |
Source (PineScript)
/*backtest
start: 2022-10-31 00:00:00
end: 2023-11-06 00:00:00
period: 1d
basePeriod: 1h
exchanges: [{"eid":"Futures_Binance","currency":"BTC_USDT"}]
*/

//@version=4
strategy(title="Know Sure Thing and EMA Strategy by JLX", shorttitle="KST EMA JLX", format=format.price, precision=4, initial_capital = 1000, default_qty_type=strategy.percent_of_equity, default_qty_value = 100)
roclen1 = input(10, minval=1, title = "ROC Length #1")
roclen2 = input(15, minval=1, title = "ROC Length #2")
roclen3 = input(20, minval=1, title = "ROC Length #3")
roclen4 = input(30, minval=1, title = "ROC Length #4")
smalen1 = input(10, minval=1, title = "SMA Length #1")
smalen2 = input(10, minval=1, title = "SMA Length #2")
smalen3 = input(10, minval=1, title = "SMA Length #3")
smalen4 = input(15, minval=1, title = "SMA Length #4")
siglen = input(9, minval=1, title = "Signal Line Length")
smaroc(roclen, smalen) => sma(roc(close, roclen), smalen)
kst = smaroc(roclen1, smalen1) + 2 * smaroc(roclen2, smalen2) + 3 * smaroc(roclen3, smalen3) + 4 * smaroc(roclen4, smalen4)
sig = sma(kst, siglen)
plot(kst, color=color.green, title="KST")
plot(sig, color=color.red, title="Signal")
hline(0, title="Zero")

len = input(50, minval=1, title="Length EMA")
src = input(close, title="Source EMA")
offset = input(title="Offset", type=input.integer, defval=0, minval=-500, maxval=500)
fastEMA = ema(src, len)

delta = kst - sig

buySignal = crossover(delta, 0) and kst < 0 and close > fastEMA
sellSignal = crossunder(delta, 0) and kst > 0 and close < fastEMA

longTrailPerc = input(title="Trail Long Loss (%)", type=input.float, minval=0.0, step=0.1, defval=1) * 0.01
shortTrailPerc = input(title="Trail Short Loss (%)",type=input.float, minval=0.0, step=0.1, defval=1) * 0.01

// STEP 2:
// Determine trail stop loss prices
longStopPrice = 0.0, shortStopPrice = 0.0

longStopPrice := if (strategy.position_size > 0)
    stopValue = close * (1 - longTrailPerc)
    max(stopValue, longStopPrice[1])
else
    0
shortStopPrice := if (strategy.position_size < 0)
    stopValue = close * (1 + shortTrailPerc)
    min(stopValue, shortStopPrice[1])
else
    999999

// Submit entry orders
if (buySignal)
    strategy.entry(id="EL", long=true)

if (sellSignal)
    strategy.entry(id="ES", long=false)

// STEP 3:
// Submit exit orders for trail stop loss price
if (strategy.position_size > 0)
    strategy.exit(id="XL TRL STP", stop=longStopPrice)

if (strategy.position_size < 0)
    strategy.exit(id="XS TRL STP", stop=shortStopPrice)


alertcondition(crossover(delta, 0) and kst < 0 and close > fastEMA,'Long alert', 'You should buy')

alertcondition(crossunder(delta, 0) and kst > 0 and close < fastEMA, 'Short alert', 'You should sell')
Detail
https://www.fmz.com/strategy/431413
Last Modified
2023-11-07 16:36:21