
8.6 KiB
Name
基于ATR和EMA的动态止盈止损自适应策略-ATR-and-EMA-based-Dynamic-Take-Profit-and-Stop-Loss-Adaptive-Strategy
Author
ChaoZhang
Strategy Description
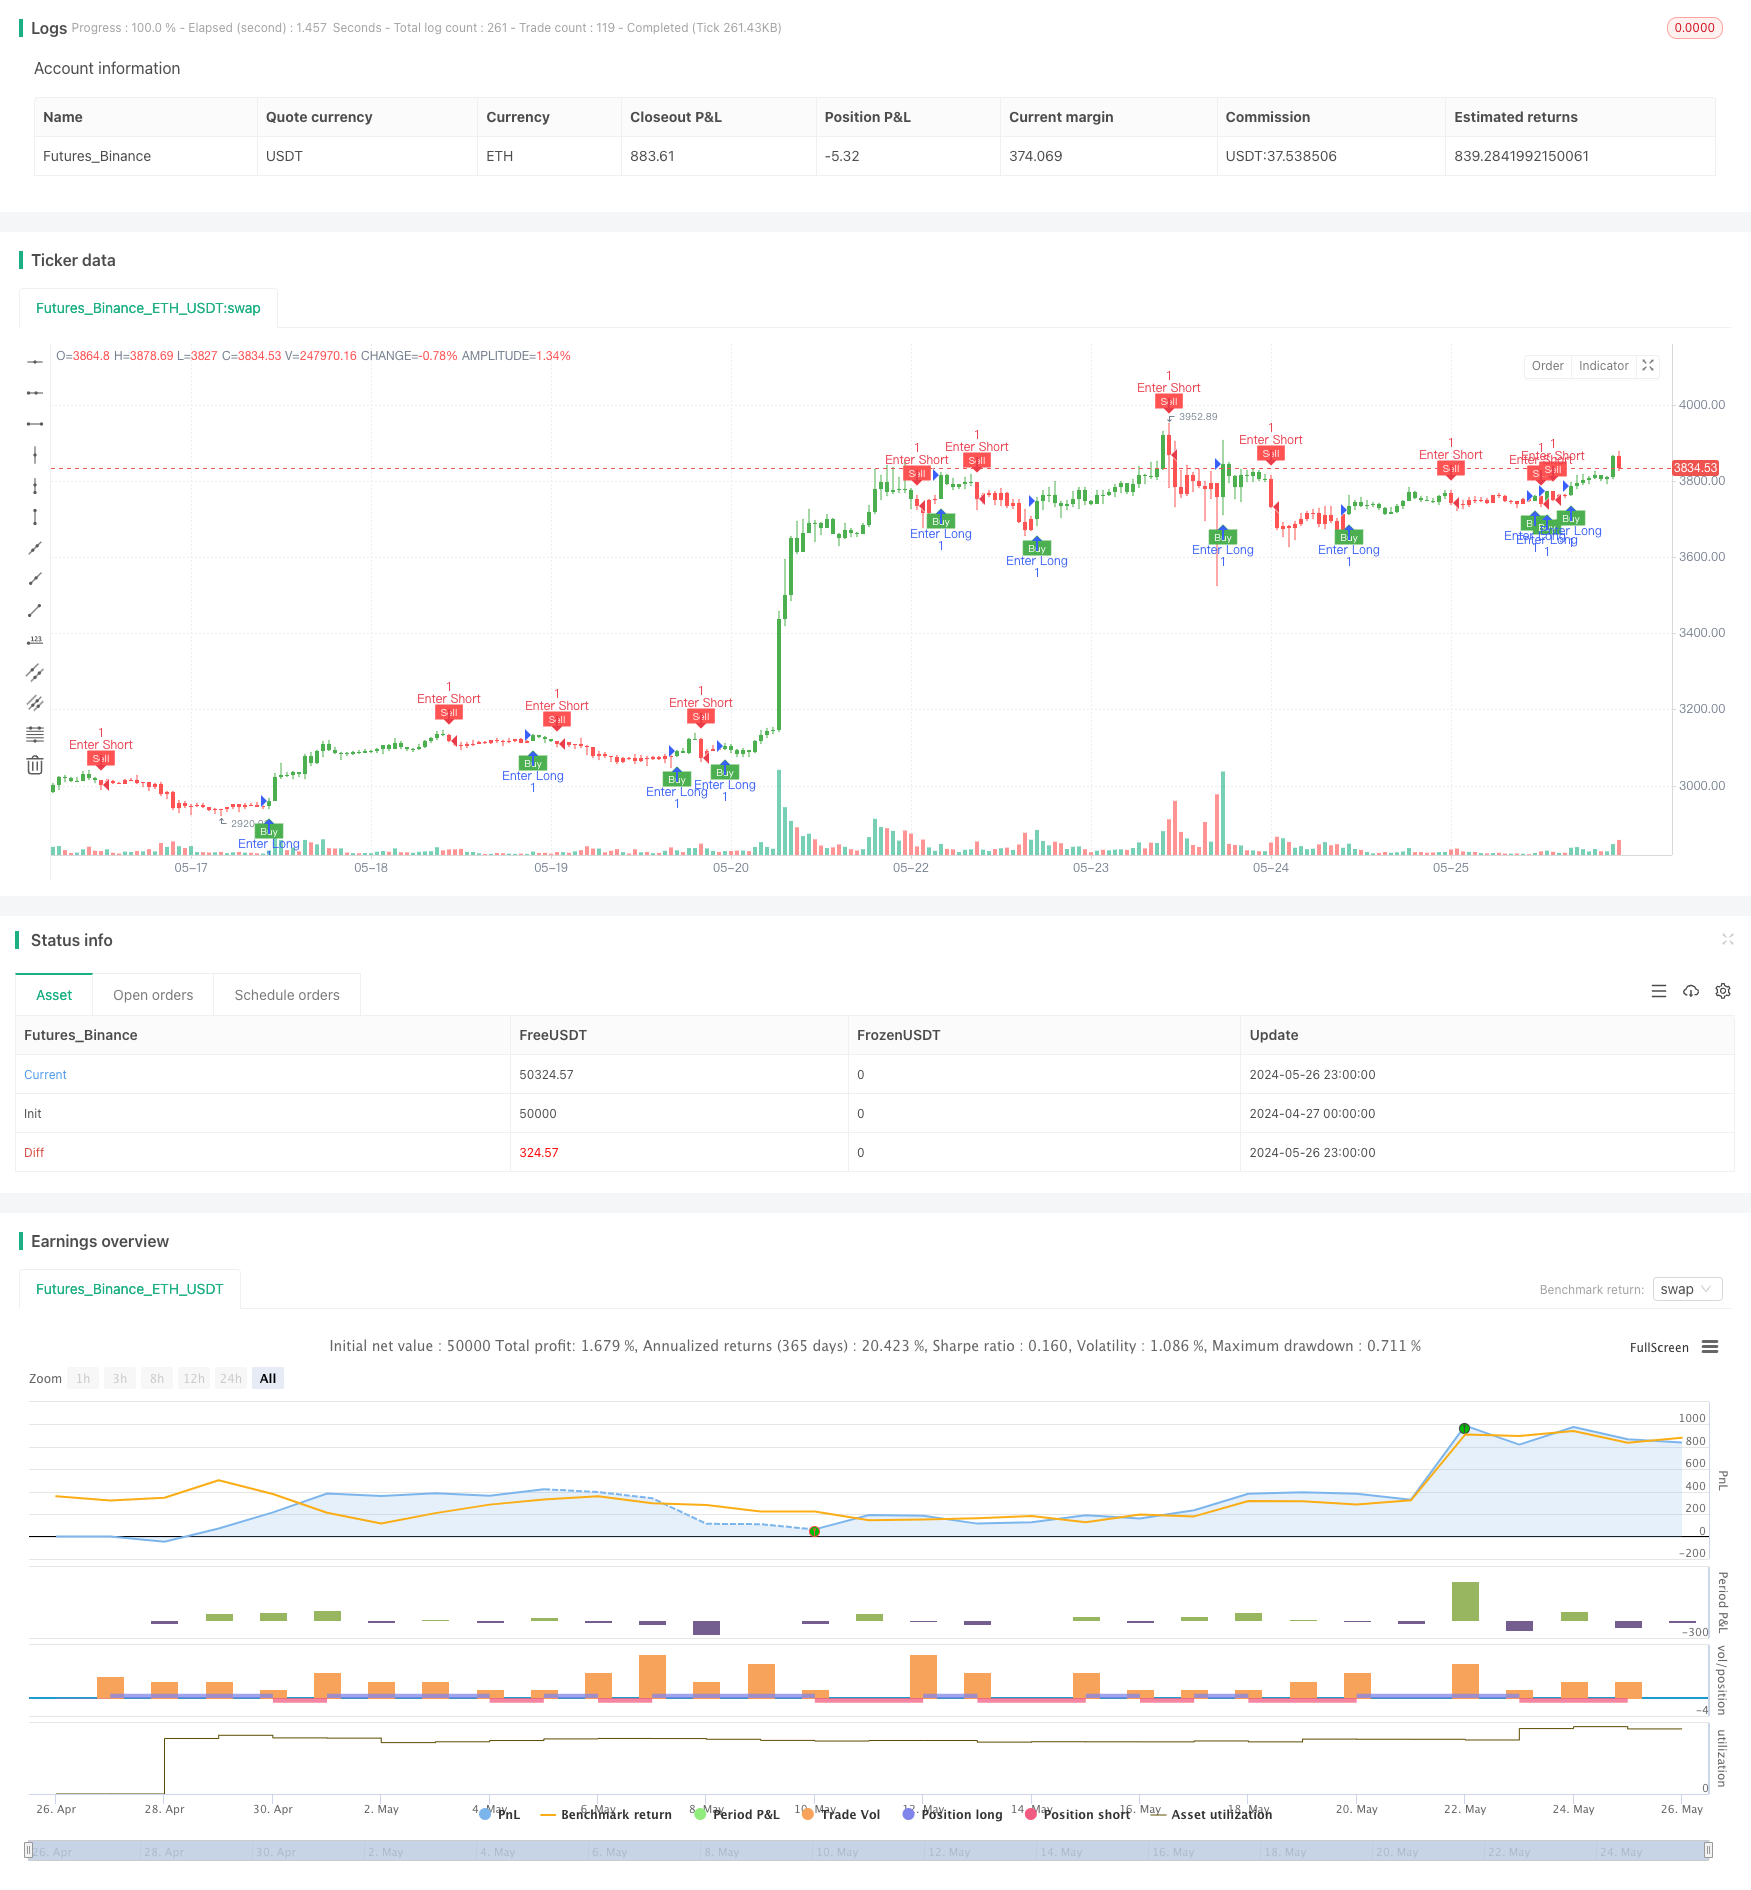
[trans]
概述
该策略使用ATR(平均真实波幅)和EMA(指数移动平均线)两个指标,通过动态调整止盈止损点位来适应市场的波动。策略的主要思路是:利用ATR指标来衡量市场波动率,并根据波动率的大小来设置止盈止损点位;同时使用EMA指标来确定交易方向,当价格向上突破EMA时开多单,向下突破EMA时开空单。该策略能够根据市场波动的变化自动调整止盈止损点位,以达到动态控制风险的目的。
策略原理
- 计算ATR指标,用来衡量市场波动率的大小。
- 根据ATR的值和输入的倍数参数,计算出动态止损点位。
- 使用EMA指标作为过滤条件,当价格向上突破EMA时开多单,向下突破EMA时开空单。
- 持仓时,根据价格的变化和动态止损点位的变化,不断调整止盈止损位置。
- 当价格触及动态止损点位时,平仓并反向开仓。
策略优势
- 自适应性强:通过动态调整止盈止损点位,策略能够适应不同市场状态下的波动率变化,控制风险。
- 趋势跟踪能力强:利用EMA指标来判断交易方向,能够有效捕捉市场趋势。
- 参数可调:通过调整ATR的周期和倍数参数,可以灵活控制策略的风险和收益。
策略风险
- 参数设置风险:ATR周期和倍数参数的设置会直接影响策略的表现,参数设置不当可能导致策略失效。
- 震荡市风险:在震荡市中,频繁的开平仓可能会导致较大的滑点和手续费损失。
- 趋势转折风险:当市场趋势发生转折时,策略可能会出现连续亏损的情况。
策略优化方向
- 引入更多的技术指标,如MACD、RSI等,以提高趋势判断的准确性。
- 优化止盈止损点位的计算方法,如引入移动止盈、动态比率止盈等方法。
- 对参数进行优化,找到最佳的ATR周期和倍数参数组合,提高策略的稳定性和盈利能力。
- 加入仓位管理模块,根据市场波动率和账户风险水平动态调整仓位大小。
总结
该策略利用ATR和EMA两个指标,通过动态调整止盈止损点位来适应市场波动率的变化,同时使用EMA指标来判断交易方向。策略具有较强的自适应性和趋势跟踪能力,但在参数设置、震荡市和趋势转折时可能面临一定的风险。未来可以通过引入更多技术指标、优化止盈止损算法、参数优化和加入仓位管理等方式来提升策略的表现。
||
Overview
This strategy utilizes two indicators, ATR (Average True Range) and EMA (Exponential Moving Average), to dynamically adjust take profit and stop loss levels in order to adapt to market volatility. The main idea of the strategy is to use the ATR indicator to measure market volatility and set take profit and stop loss levels based on the magnitude of volatility. At the same time, the EMA indicator is used to determine the trading direction. When the price breaks above the EMA, a long position is opened, and when the price breaks below the EMA, a short position is opened. This strategy can automatically adjust take profit and stop loss levels according to changes in market volatility, thereby achieving the purpose of dynamic risk control.
Strategy Principle
- Calculate the ATR indicator to measure the magnitude of market volatility.
- Calculate the dynamic stop loss level based on the ATR value and the input multiple parameter.
- Use the EMA indicator as a filter condition. Open a long position when the price breaks above the EMA, and open a short position when the price breaks below the EMA.
- While holding a position, continuously adjust the take profit and stop loss levels based on price changes and dynamic stop loss level changes.
- When the price reaches the dynamic stop loss level, close the position and open a reverse position.
Strategy Advantages
- Strong adaptability: By dynamically adjusting take profit and stop loss levels, the strategy can adapt to changes in volatility under different market conditions and control risks.
- Strong trend-following ability: The EMA indicator is used to determine the trading direction, which can effectively capture market trends.
- Adjustable parameters: By adjusting the ATR period and multiple parameters, the risk and return of the strategy can be flexibly controlled.
Strategy Risks
- Parameter setting risk: The setting of the ATR period and multiple parameters will directly affect the performance of the strategy. Improper parameter settings may lead to strategy failure.
- Oscillating market risk: In an oscillating market, frequent opening and closing of positions may lead to large slippage and transaction fee losses.
- Trend reversal risk: When the market trend reverses, the strategy may experience consecutive losses.
Strategy Optimization Directions
- Introduce more technical indicators, such as MACD and RSI, to improve the accuracy of trend judgment.
- Optimize the calculation method of take profit and stop loss levels, such as introducing trailing stop loss and dynamic ratio stop loss methods.
- Optimize parameters to find the best combination of ATR period and multiple parameters to improve the stability and profitability of the strategy.
- Add a position management module to dynamically adjust position size based on market volatility and account risk level.
Summary
This strategy utilizes the ATR and EMA indicators to dynamically adjust take profit and stop loss levels to adapt to changes in market volatility, while using the EMA indicator to determine the trading direction. The strategy has strong adaptability and trend-following capabilities, but may face certain risks in parameter settings, oscillating markets, and trend reversals. In the future, the performance of the strategy can be improved by introducing more technical indicators, optimizing take profit and stop loss algorithms, parameter optimization, and adding position management modules. [/trans]
Source (PineScript)
/*backtest
start: 2024-04-27 00:00:00
end: 2024-05-27 00:00:00
period: 1h
basePeriod: 15m
exchanges: [{"eid":"Futures_Binance","currency":"ETH_USDT"}]
*/

//@version=5
strategy(title='UT MB&SS Bot', overlay=true)

// Inputs
a = input(1, title='Key Value. \'This changes the sensitivity\'')
c = input(10, title='ATR Period')
h = input(false, title='Signals from Heikin Ashi Candles')
stoploss = input(2.0, title='Stop Loss (ATR Multiples)')

xATR = ta.atr(c)
nLoss = a * xATR

src = h ? request.security(ticker.heikinashi(syminfo.tickerid), timeframe.period, close, lookahead=barmerge.lookahead_off) : close

var xATR_trailing_stop = 0.0
iff_1 = src > nz(xATR_trailing_stop[1], 0) ? src - nLoss : src + nLoss
iff_2 = src < nz(xATR_trailing_stop[1], 0) and src[1] < nz(xATR_trailing_stop[1], 0) ? math.min(nz(xATR_trailing_stop[1]), src + nLoss) : iff_1
xATR_trailing_stop := src > nz(xATR_trailing_stop[1], 0) and src[1] > nz(xATR_trailing_stop[1], 0) ? math.max(nz(xATR_trailing_stop[1]), src - nLoss) : iff_2

pos = 0
iff_3 = src[1] > nz(xATR_trailing_stop[1], 0) and src < nz(xATR_trailing_stop[1], 0) ? -1 : nz(pos[1], 0)
pos := src[1] < nz(xATR_trailing_stop[1], 0) and src > nz(xATR_trailing_stop[1], 0) ? 1 : iff_3

xcolor = pos == -1 ? color.red : pos == 1 ? color.green : color.blue

ema = ta.ema(src, 1)
above = ta.crossover(ema, xATR_trailing_stop)
below = ta.crossover(xATR_trailing_stop, ema)

buy = src > xATR_trailing_stop and above
sell = src < xATR_trailing_stop and below

barbuy = src > xATR_trailing_stop
barsell = src < xATR_trailing_stop

plotshape(buy, title='Buy', text='Buy', style=shape.labelup, location=location.belowbar, color=color.new(color.green, 0), textcolor=color.new(color.white, 0), size=size.tiny)
plotshape(sell, title='Sell', text='Sell', style=shape.labeldown, location=location.abovebar, color=color.new(color.red, 0), textcolor=color.new(color.white, 0), size=size.tiny)

barcolor(barbuy ? color.green : na)
barcolor(barsell ? color.red : na)

stop_level = pos == 1 ? xATR_trailing_stop - stoploss * xATR : xATR_trailing_stop + stoploss * xATR
stop_level := math.max(stop_level, nz(stop_level[1]))

if pos == 1
    strategy.exit('Exit Long', 'UT Long', stop=stop_level)
else if pos == -1
    strategy.exit('Exit Short', 'UT Short', stop=stop_level)


if buy
    strategy.entry("Enter Long", strategy.long)
else if sell
    strategy.entry("Enter Short", strategy.short)
Detail
https://www.fmz.com/strategy/452716
Last Modified
2024-05-28 14:15:56