
9.8 KiB
Name
基于ADXBB-BAO和EMA的量化交易策略Four-factor-Momentum-Tracking-Trading-Strategy-Based-on-ADX-BB-B-AO-and-EMA
Author
ChaoZhang
Strategy Description
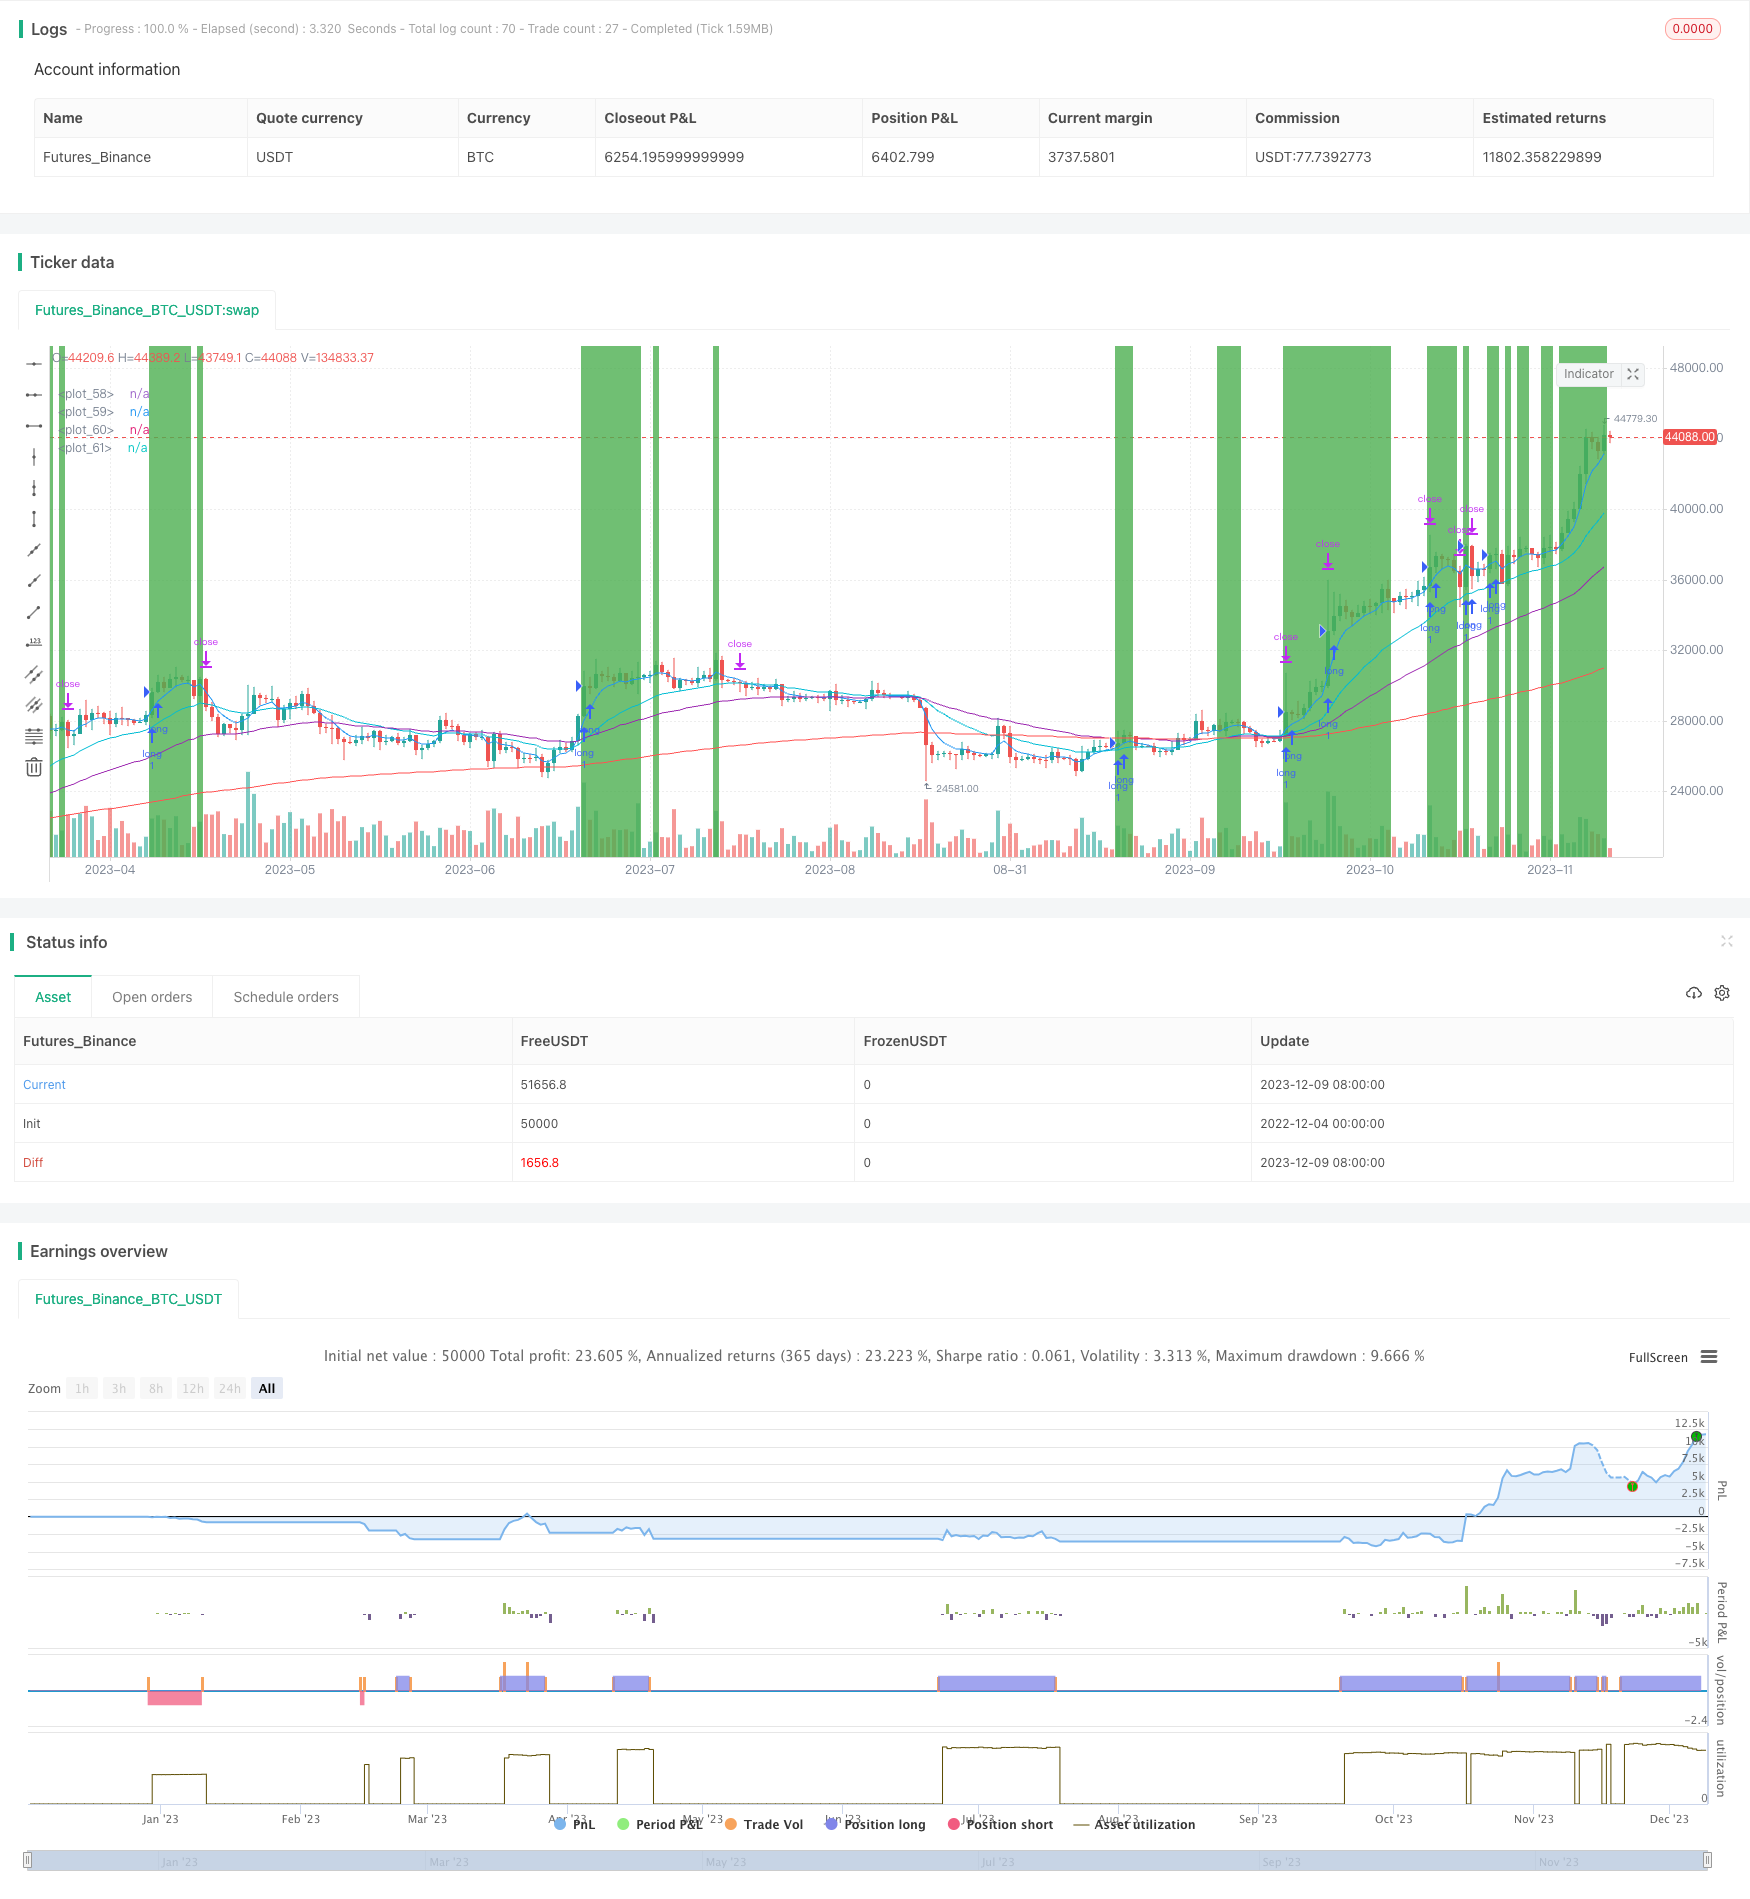 [trans]
概述
本策略名称为“四因子动量追踪策略”。该策略综合运用平均方向运动指标(ADX)判断趋势方向、布林带百分比B波段(BB %B)判断股票相对强弱、神奇均线(AO)判断动量以及不同周期的指数移动平均线(EMA)判断多空,实现对股票价格的动态跟踪,追捧强势股、回避弱势股的效果。
策略原理
该策略运用四个不同的技术指标判断买入和卖出时机。具体判断逻辑如下:
多头进入条件:5日EMA上穿21日EMA,50日EMA上穿200日EMA,BB %B大于设定的过买线,AO大于设定的正值,ADX大于设定值。
空头进入条件:5日EMA下穿21日EMA,50日EMA下穿200日EMA,BB %B小于设定的过卖线,AO小于设定的负值,ADX大于设定值。
策略优势分析
该策略综合多个指标判断趋势方向和 stocks的相对强弱,可以有效过滤假突破。具体优势如下:
-
ADX指标可以有效判断趋势的存在以及趋势的力度,避免在震荡市中频繁开仓;
-
BB %B指标判断个股是否处于“高位”或“低位”,可以有效避免追高杀跌;
-
AO指标判断买入时是否存在较强的动量支撑,保证突破的有效性;
-
EMA指标的金叉/死叉结合判断市场主流方向,避免逆势开仓。
综上,该策略可以有效控制交易风险,追踪市场中的强势个股。
风险分析
尽管该策略综合运用多种指标控制风险,但仍存在一定的风险:
-
多个指数型指标组合使用,对参数调整敏感,不恰当的参数组合可能无法发挥应有效果。
-
过于追求动量可能错过市场真正的反转点位。应适当控制持仓周期,及时止盈止损。
-
EMA等指标具有滞后性,可能无法及时反映突发事件的影响。应适当配合其他指标或适当缩短MA周期。
-
突发重大事件可能导致指标发散,应结合基本面分析,必要时可以暂时关闭策略。
优化方向
该策略还可从以下几个方面进行优化:
-
运用机器学习等方法寻找最佳参数组合。
-
加入其他判断趋势指标,如CCI,MACD等,形成“指标组合”,提高判断准确性。
-
加入止盈止损策略,控制单笔损失。
-
设定持仓时间,避免过度贪婪。
总结
本策略名称为“四因子动量追踪策略”,运用ADX、BB %B、AO和EMA四个指标判断买卖时机,实现对强势个股的动态跟踪。该策略能有效判断趋势方向和股票的相对强弱,控制交易风险。下一步可通过参数优化、加入其他指标以及设置持仓时间等方式进一步完善该策略。
||
##Overview This strategy is named "Four-factor Momentum Tracking Strategy". It integrates Average Directional Movement Index (ADX) to determine trend direction, Bollinger Bands Percentage B (BB %B) to judge the relative strength of stocks, Awesome Oscillator (AO) to determine momentum and different cycle Exponential Moving Averages (EMA) to judge long and short positions, achieving dynamic tracking of stock prices and chasing strong stocks and avoiding weak ones.
##Strategy Principle
The strategy uses four different technical indicators to determine entry and exit points. The specific logic is as follows:
Long entry condition: 5-day EMA crosses above 21-day EMA, 50-day EMA crosses above 200-day EMA, BB %B is greater than the set overbought line, AO is greater than the set positive value, and ADX is greater than the set value.
Short entry condition: 5-day EMA crosses below 21-day EMA, 50-day EMA crosses below 200-day EMA, BB %B is less than the set oversold line, AO is less than the set negative value, and ADX is greater than the set value.
##Advantage Analysis The strategy combines multiple indicators to determine trend direction and relative strength of stocks, which can effectively filter false breakouts. The specific advantages are:
-
The ADX indicator can effectively determine the existence and strength of the trend, avoiding frequent opening in a shock market.
-
The BB %B indicator judges whether the individual stocks are at a "high" or "low" level, which can effectively avoid chasing highs and selling lows.
-
The AO indicator determines whether there is relatively strong momentum support during buying to ensure the effectiveness of the breakout.
-
The EMA indicator’s golden cross/dead cross combined with the judgment of the main direction of the market avoids opening positions against the trend.
In summary, this strategy can effectively control trading risks and track strong stocks in the market.
##Risk Analysis Although the strategy uses multiple indicators to control risks, there are still certain risks:
-
The combination of multiple exponential indicators is sensitive to parameter adjustments. Inappropriate parameter combinations may fail to achieve the desired effect.
-
Excessively pursuing momentum may miss the market's real reversal points. Profits and losses should be controlled in a timely manner.
-
Indicators like EMA have a lagging nature and may not be able to reflect the impact of sudden events in time. The MA period should be appropriately shortened or used with other indicators.
-
Major sudden events may cause indicator divergence. Fundamental analysis should be combined and the strategy can be temporarily closed if necessary.
##Optimization Direction The strategy can also be optimized in several aspects:
-
Use machine learning to find the optimal parameter combination.
-
Add other indicators that determine trends, such as CCI and MACD, to form an "indicator combination" to improve judgment accuracy.
-
Add stop-loss strategies to control single loss.
-
Set holding time to avoid excessive greed.
##Summary This strategy is named "Four-factor Momentum Tracking Strategy". It uses ADX, BB %B, AO and EMA four indicators to determine entry and exit points to dynamically track strong stocks. The strategy can effectively determine the trend direction and relative strength of stocks to control trading risks. Next, parameters optimization, adding other indicators, setting holding time and other methods can be used to further improve the strategy.
[/trans]
Strategy Arguments
| Argument | Default | Description |
|---|---|---|
| v_input_1 | 10 | Take Profit % |
| v_input_2 | 5 | Stop Loss % |
| v_input_3 | 75 | BB %B Overbought |
| v_input_4 | 25 | BB %B Oversold |
| v_input_5 | 2 | Awesome Oscillator |
| v_input_6 | 15 | ADX |
| v_input_7 | true | Start Date |
| v_input_8 | true | Start Month |
| v_input_9 | 2018 | Start Year |
| v_input_10 | 20 | length |
| v_input_11_close | 0 | Source: close |
| v_input_12 | 2 | StdDev |
| v_input_13 | 14 | ADX Smoothing |
| v_input_14 | 14 | DI Length |
Source (PineScript)
/*backtest
start: 2022-12-04 00:00:00
end: 2023-12-10 00:00:00
period: 1d
basePeriod: 1h
exchanges: [{"eid":"Futures_Binance","currency":"BTC_USDT"}]
*/

//@version=4

//ADX + BB %B + AO + EMA

strategy("ADX + BB %B + AO + EMA", overlay=true, initial_capital=10000)
take_profit_perc = input(title="Take Profit %", type=input.integer, defval=10, minval=1, maxval=100)
stop_loss_perc = input(title="Stop Loss %", type=input.integer, defval=5, minval=1, maxval=100)
bb_overbought = input(title="BB %B Overbought", type=input.integer, defval=75, minval=1, maxval=100)
bb_oversold = input(title="BB %B Oversold", type=input.integer, defval=25, minval=1, maxval=100)
ao_value = input(title="Awesome Oscillator", type=input.integer, defval=2)
adx_value = input(title="ADX", type=input.integer, defval=15)

startDate = input(title="Start Date", type=input.integer, defval=1, minval=1, maxval=31)
startMonth = input(title="Start Month", type=input.integer, defval=1, minval=1, maxval=12)
startYear = input(title="Start Year", type=input.integer, defval=2018, minval=2008, maxval=2200)

inDateRange = (time >= timestamp(syminfo.timezone, startYear, startMonth, startDate, 0, 0))

ema5 = ema(close, 5)
ema21 = ema(close, 21)
ema50 = ema(close, 50)
ema200 = ema(close, 200)

//BB %B
length = input(20, minval=1)
src = input(close, title="Source")
mult = input(2.0, minval=0.001, maxval=50, title="StdDev")
basis = sma(src, length)
dev = mult * stdev(src, length)
upper = basis + dev
lower = basis - dev
bbr = (src - lower)/(upper - lower)

//Awesome Oscillator
ao = sma(hl2,5) - sma(hl2,34)

// ADX
adxlen = input(14, title="ADX Smoothing")
dilen = input(14, title="DI Length")
dirmov(len) =>
	up = change(high)
	down = -change(low)
	plusDM = na(up) ? na : (up > down and up > 0 ? up : 0)
	minusDM = na(down) ? na : (down > up and down > 0 ? down : 0)
	truerange = rma(tr, len)
	plus = fixnan(100 * rma(plusDM, len) / truerange)
	minus = fixnan(100 * rma(minusDM, len) / truerange)
	[plus, minus]
adx(dilen, adxlen) =>
	[plus, minus] = dirmov(dilen)
	sum = plus + minus
	adx = 100 * rma(abs(plus - minus) / (sum == 0 ? 1 : sum), adxlen)
sig = adx(dilen, adxlen)

long_strategy = ema5>ema21 and ema50>ema200 and bbr>(bb_overbought/100) and ao>ao_value and sig>adx_value
short_strategy = ema5<ema21 and ema50<ema200 and bbr<(bb_oversold/100) and ao<-ao_value and sig>adx_value

plot(ema5, color=color.blue)
plot(ema21, color=color.aqua)
plot(ema50, color=color.purple)
plot(ema200, color=color.red)
bgcolor(color=long_strategy ? color.green : na, transp=80)
bgcolor(color=short_strategy ? color.purple : na, transp=80)

if inDateRange and long_strategy
    strategy.entry("long", strategy.long)
    strategy.exit("exit", "long", stop=close*(100-stop_loss_perc)/100, limit=close*(100+take_profit_perc)/100)
if inDateRange and short_strategy
    strategy.entry("short", strategy.short)
    strategy.exit("exit", "short", stop=close*(100+stop_loss_perc)/100, limit=close*(100-take_profit_perc)/100)
Detail
https://www.fmz.com/strategy/435003
Last Modified
2023-12-11 16:24:11