
8.8 KiB
Name
基于统计偏差的市场极端下跌策略-Statistical-Deviation-Based-Market-Extreme-Drawdown-Strategy
Author
ChaoZhang
Strategy Description
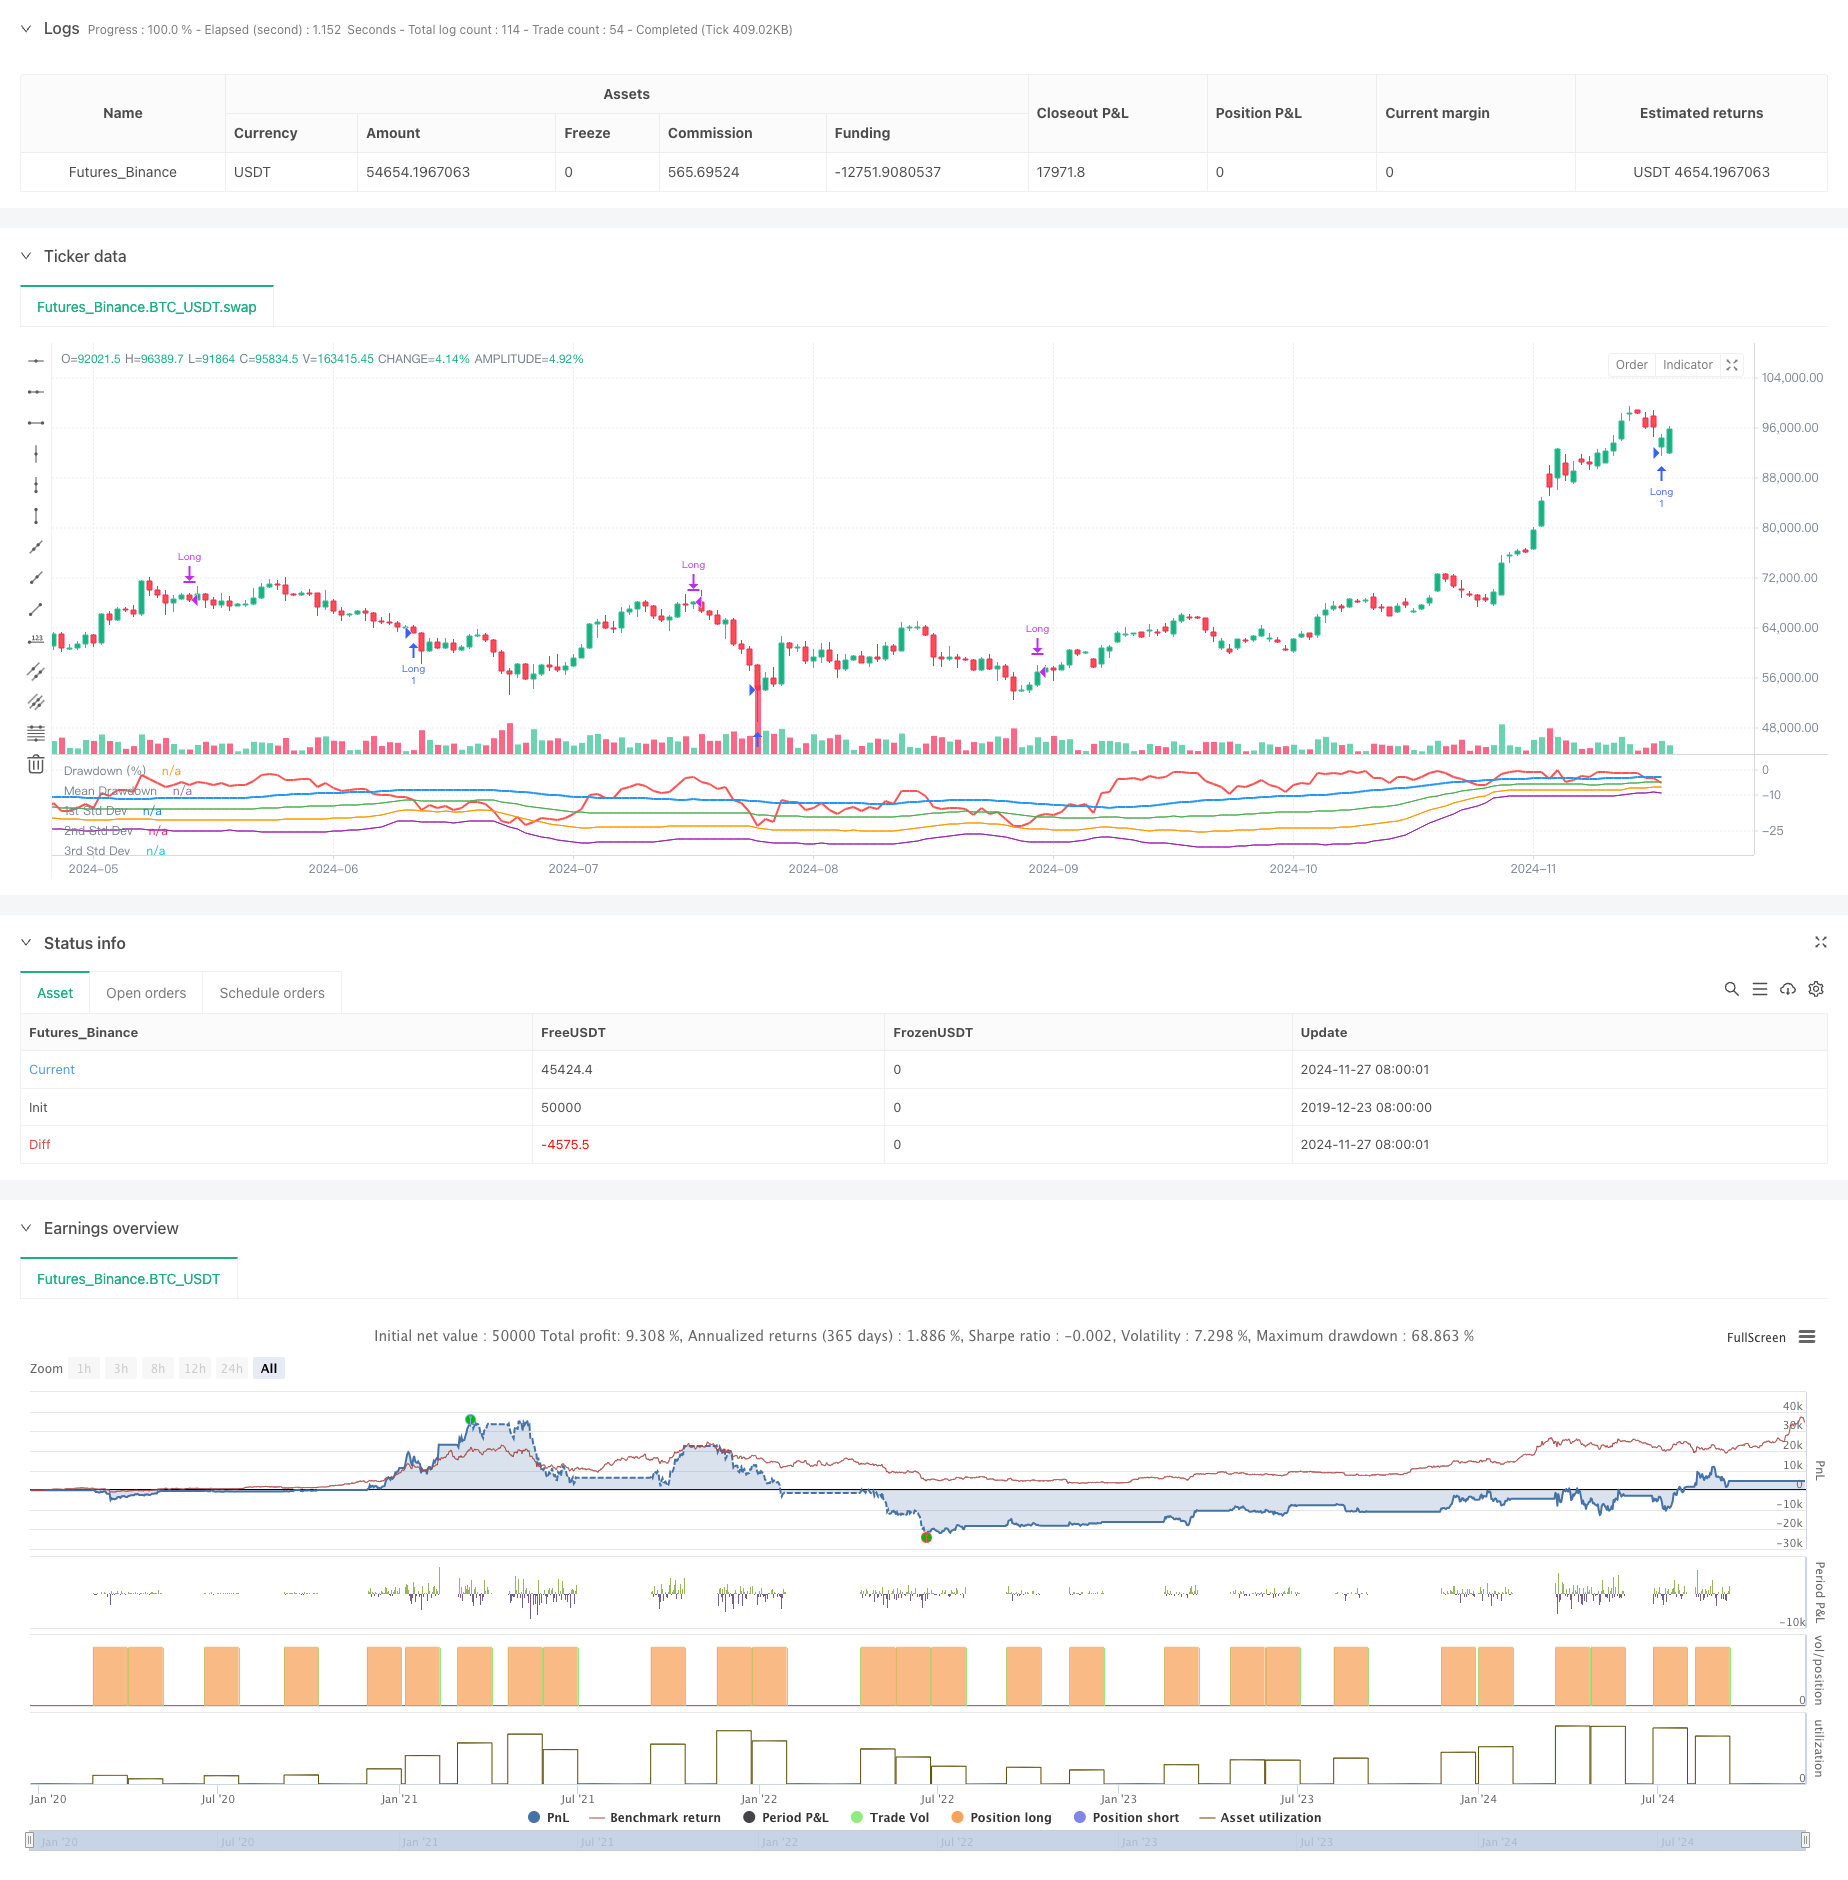
[trans]
概述
该策略基于市场极端下跌时的统计特性进行交易。通过对回撤的统计分析,利用标准差衡量市场波动的极端程度,在市场出现超出正常范围的下跌时进行买入。策略的核心思想是捕捉市场恐慌情绪导致的超跌机会,通过数学统计方法识别市场非理性行为带来的投资机会。
策略原理
策略采用滚动时间窗口计算价格的最大回撤和回撤的统计特征。首先计算过去50个周期内的最高价,然后计算当前收盘价相对最高价的回撤百分比。接着计算回撤的均值和标准差,设置-1倍标准差作为触发阈值。当市场回撤超过均值减去设定倍数的标准差时,表明市场可能出现超跌,此时进入多头头寸。持仓35个周期后自动平仓。策略还绘制了回撤曲线以及一倍、两倍和三倍标准差水平线,用于直观判断市场的超跌程度。
策略优势
- 策略基于统计学原理,具有扎实的理论基础。通过标准差衡量市场波动的极端程度,方法客观科学。
- 策略能够有效捕捉市场恐慌时期的投资机会。在市场出现非理性下跌时入场,符合价值投资的理念。
- 采用固定周期平仓的方式,避免了追踪止损可能错过反弹的问题。
- 策略参数可调整性强,可以根据不同市场环境和交易品种特点灵活设置。
- 回撤和标准差指标计算简单,策略逻辑清晰,易于理解和执行。
策略风险
- 市场可能出现持续下跌,导致策略频繁入场但均亏损。建议设置最大持仓数量限制。
- 固定周期平仓可能错过更大的上涨空间。可以考虑增加趋势跟踪的平仓方式。
- 回撤统计特征可能随市场环境变化而改变。建议定期更新参数设置。
- 策略未考虑成交量等其他市场信息。建议结合多个指标进行交叉验证。
- 在剧烈波动的市场环境下,标准差可能失真。建议设置风险控制措施。
策略优化方向
- 引入成交量指标,确认市场恐慌程度。
- 增加趋势指标,避免在下跌趋势中频繁入场。
- 优化平仓机制,根据市场表现动态调整持仓时间。
- 增加止损设置,控制单次交易风险。
- 考虑使用自适应参数,提高策略对市场变化的适应性。
总结
该策略通过统计学方法捕捉市场超跌机会,具有良好的理论基础和实用价值。策略逻辑简单清晰,参数可调整性强,适合作为基础策略进行扩展和优化。通过增加其他技术指标和风险控制措施,可以进一步提升策略的稳定性和盈利能力。在实盘交易中,建议结合市场环境和交易品种特点,谨慎设置参数,做好风险控制。 ||
Overview
This strategy is based on the statistical characteristics of extreme market downturns. By analyzing drawdowns statistically and using standard deviations to measure market volatility extremes, it initiates buying positions when market declines exceed normal ranges. The core idea is to capture oversold opportunities caused by market panic, identifying investment opportunities through mathematical statistical methods that arise from market irrationality.
Strategy Principle
The strategy employs a rolling time window to calculate price maximum drawdowns and their statistical characteristics. It first calculates the highest price over the past 50 periods, then computes the drawdown percentage of current closing price relative to the highest price. It then calculates the mean and standard deviation of drawdowns, setting -1 standard deviation as the trigger threshold. When market drawdown exceeds the mean minus a set multiple of standard deviations, indicating potential oversold conditions, a long position is entered. Positions are automatically closed after 35 periods. The strategy also plots drawdown curves and one, two, and three standard deviation levels for visual assessment of market oversold conditions.
Strategy Advantages
- The strategy is based on statistical principles with solid theoretical foundation. Using standard deviation to measure market volatility extremes is objective and scientific.
- Effectively captures investment opportunities during market panic periods. Entering positions during irrational market declines aligns with value investing principles.
- Fixed-period position closure avoids missing rebounds that might occur with trailing stops.
- Highly adjustable parameters allow flexibility for different market environments and trading instruments.
- Simple calculation of drawdown and standard deviation indicators makes the strategy logic clear and easy to understand and execute.
Strategy Risks
- Markets may experience continuous decline, leading to frequent losing entries. Consider setting maximum position limits.
- Fixed-period exits may miss larger upside potential. Consider adding trend-following exit methods.
- Drawdown statistical characteristics may change with market conditions. Consider regular parameter updates.
- Strategy doesn't consider volume and other market information. Consider cross-validation with multiple indicators.
- Standard deviation may become unreliable in highly volatile markets. Consider implementing risk control measures.
Optimization Directions
- Incorporate volume indicators to confirm market panic levels.
- Add trend indicators to avoid frequent entries in downtrends.
- Optimize exit mechanism with dynamic holding period adjustments based on market performance.
- Add stop-loss settings to control single-trade risk.
- Consider using adaptive parameters to improve strategy adaptation to market changes.
Summary
This strategy captures market oversold opportunities through statistical methods, with strong theoretical foundation and practical value. The strategy logic is simple and clear with adjustable parameters, suitable as a base strategy for expansion and optimization. Strategy stability and profitability can be further enhanced by adding technical indicators and risk control measures. In live trading, carefully set parameters considering market conditions and trading instrument characteristics, while maintaining proper risk control.[/trans]
Source (PineScript)
/*backtest
start: 2019-12-23 08:00:00
end: 2024-11-28 00:00:00
period: 1d
basePeriod: 1d
exchanges: [{"eid":"Futures_Binance","currency":"BTC_USDT"}]
*/

//@version=5
strategy("Buy When There's Blood in the Streets Strategy", overlay=false, shorttitle="BloodInTheStreets")


//This strategy identifies opportunities to buy during extreme market drawdowns based on standard deviation thresholds.
//It calculates the maximum drawdown over a user-defined lookback period, identifies extreme deviations from the mean,
//and triggers long entries when specific conditions are met. The position is exited after a defined number of bars.


// User Inputs
lookbackPeriod = input.int(50, title="Lookback Period", minval=1, tooltip="Period to calculate the highest high for drawdown")
stdDevLength = input.int(50, title="Standard Deviation Length", minval=1, tooltip="Length of the period to calculate standard deviation")
stdDevThreshold = input.float(-1.0, title="Standard Deviation Threshold", tooltip="Trigger level for long entry based on deviations")
exitBars = input.int(35, title="Exit After (Bars)", minval=1, tooltip="Number of bars after which to exit the trade")

// Drawdown Calculation
peakHigh = ta.highest(high, lookbackPeriod)
drawdown = ((close - peakHigh) / peakHigh) * 100

// Standard Deviation Calculation
drawdownStdDev = ta.stdev(drawdown, stdDevLength)
meanDrawdown = ta.sma(drawdown, stdDevLength)

// Define Standard Deviation Levels
stdDev1 = meanDrawdown - drawdownStdDev
stdDev2 = meanDrawdown - 2 * drawdownStdDev
stdDev3 = meanDrawdown - 3 * drawdownStdDev

// Plot Drawdown and Levels
plot(drawdown, color=color.red, linewidth=2, title="Drawdown (%)")
plot(meanDrawdown, color=color.blue, linewidth=2, title="Mean Drawdown")
plot(stdDev1, color=color.green, linewidth=1, title="1st Std Dev")
plot(stdDev2, color=color.orange, linewidth=1, title="2nd Std Dev")
plot(stdDev3, color=color.purple, linewidth=1, title="3rd Std Dev")

// Entry Condition
var float entryBar = na
goLong = drawdown <= meanDrawdown + stdDevThreshold * drawdownStdDev

if (goLong and strategy.position_size == 0)
    strategy.entry("Long", strategy.long)
    entryBar := bar_index

// Exit Condition
if (strategy.position_size > 0 and not na(entryBar) and bar_index - entryBar >= exitBars)
    strategy.close("Long")
Detail
https://www.fmz.com/strategy/473402
Last Modified
2024-11-29 16:46:33