
14 KiB
Name
基于移动平均线和超级趋势指标的双重过滤指数基金策略Dual-Filter-Index-Fund-Strategy-Based-on-Moving-Averages-and-Supertrend-Indicator
Author
ChaoZhang
Strategy Description
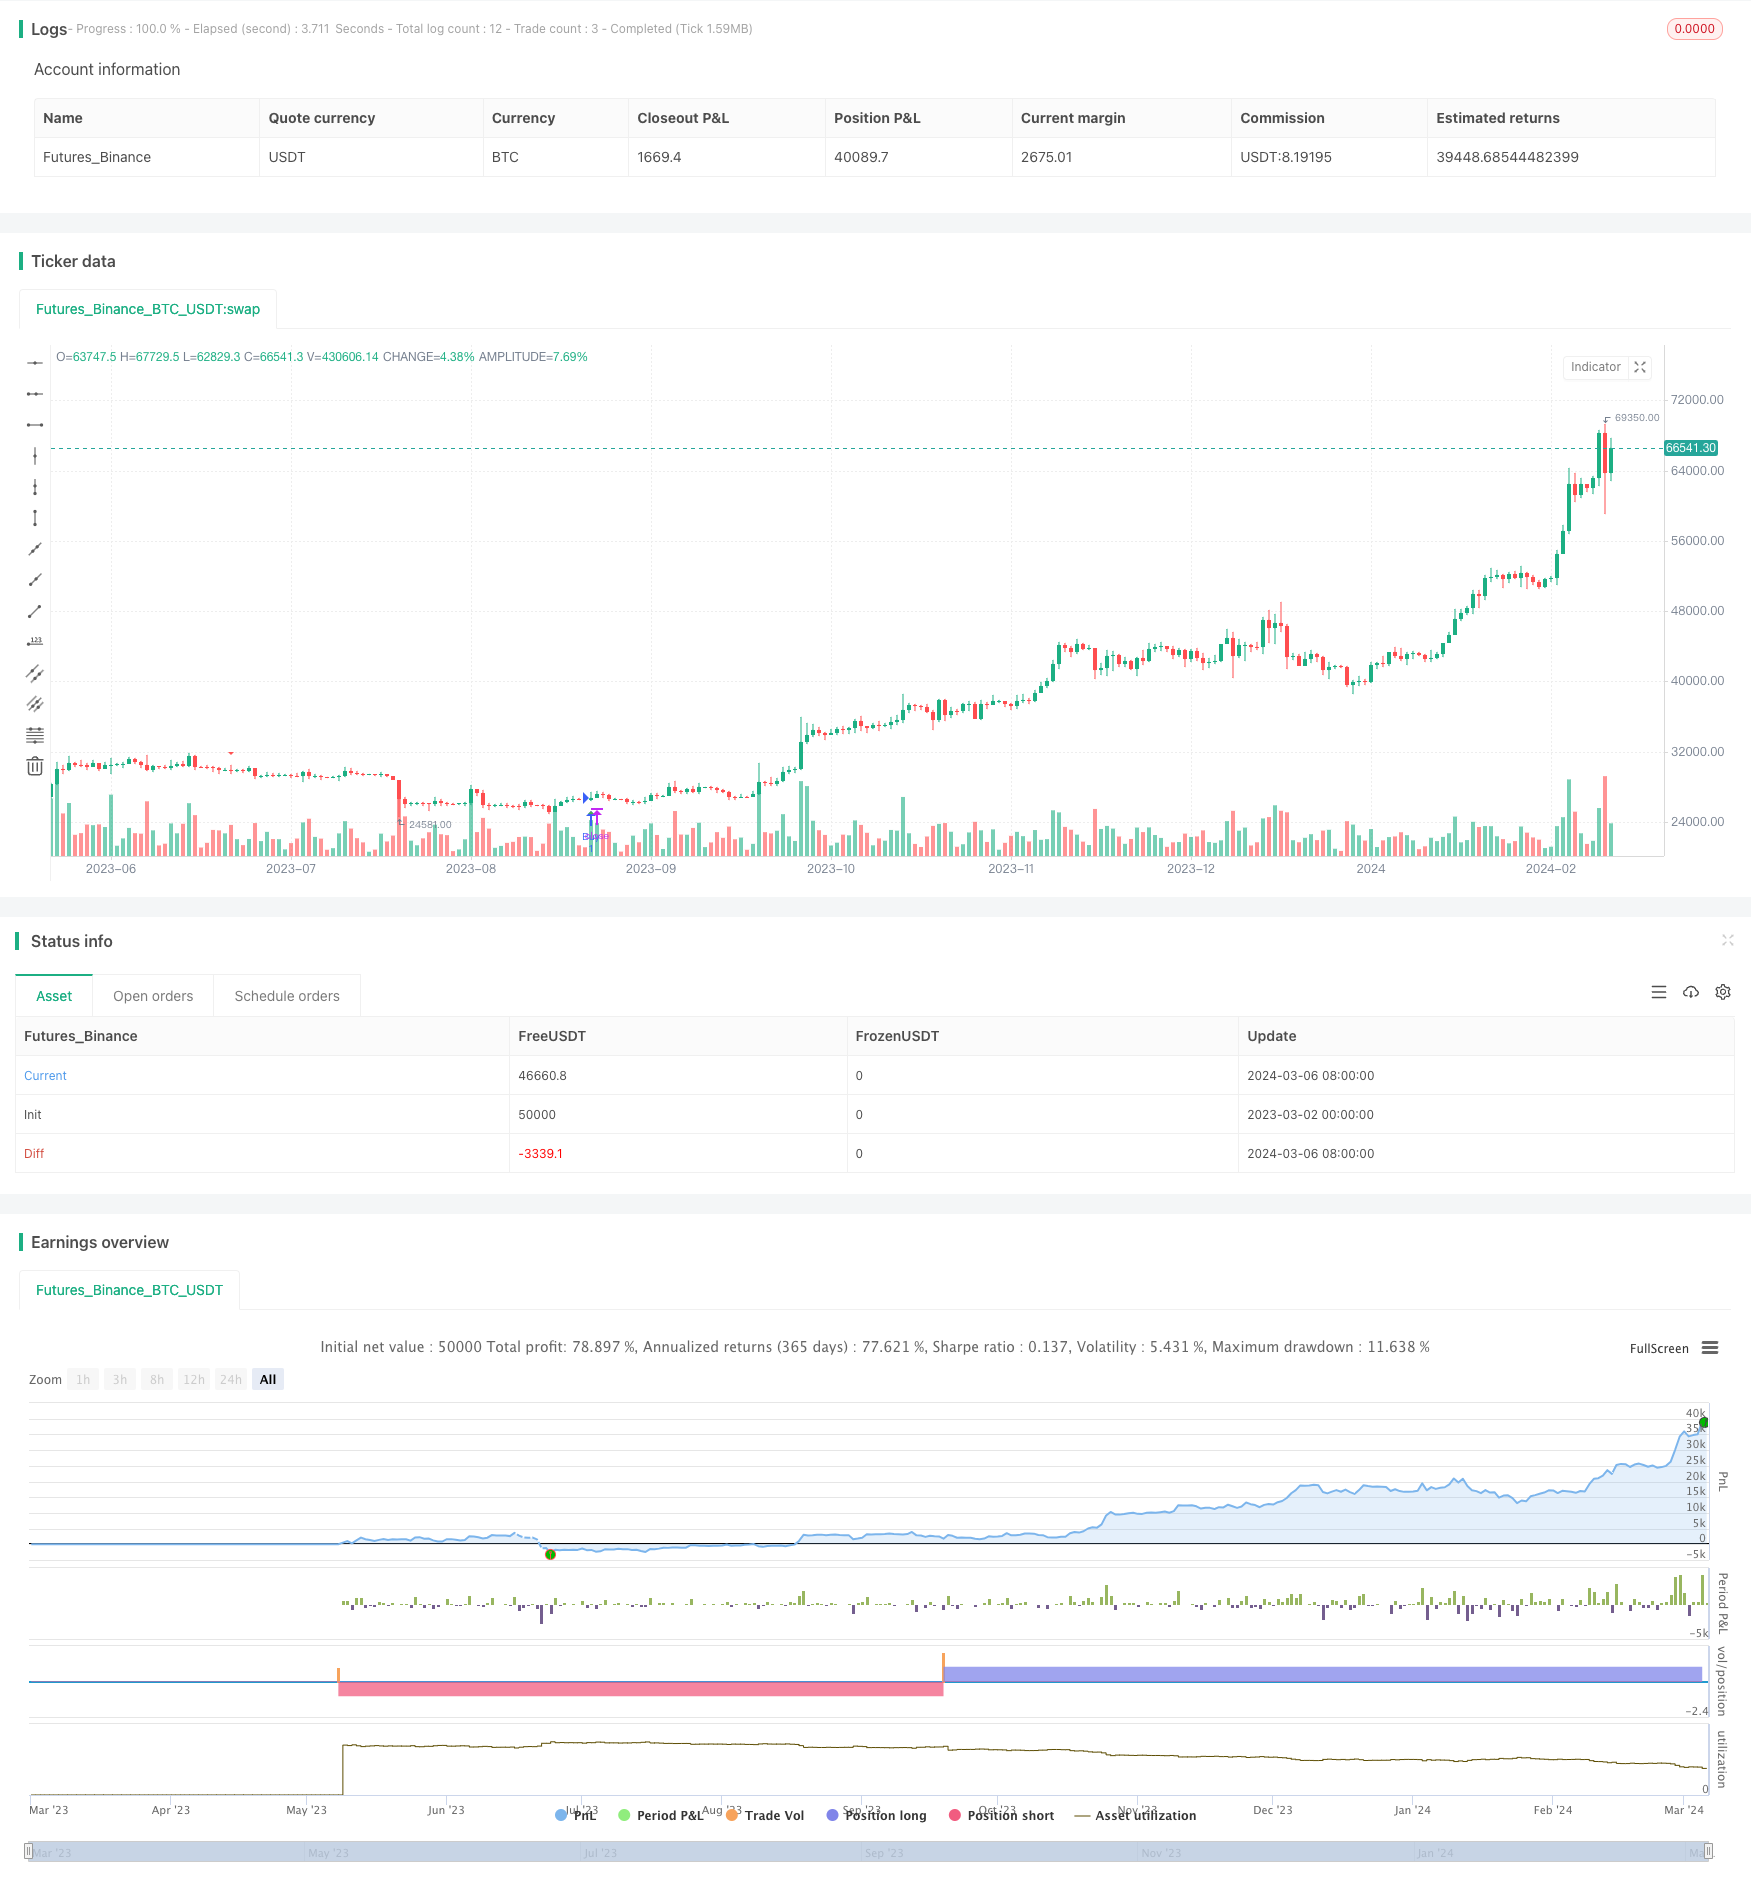 [trans]
概述
该策略结合了两个常用的技术指标:移动平均线和超级趋势指标,通过双重过滤的方式来捕捉市场趋势,并根据趋势方向进行交易。策略的主要思想是利用快慢两条移动平均线的交叉来判断趋势的形成,同时使用超级趋势指标来确认趋势的方向,以此来过滤掉假信号,提高交易的准确性。
策略原理
该策略使用了两个技术指标:移动平均线和超级趋势指标。
移动平均线是一种常用的趋势跟踪指标,通过计算一段时间内收盘价的平均值来判断价格的走势。该策略使用了两条不同周期的简单移动平均线(SMA),分别为10期和30期。当快线(10期SMA)上穿慢线(30期SMA)时,表明上升趋势可能形成;当快线下穿慢线时,表明下降趋势可能形成。
超级趋势指标是一种趋势跟踪指标,通过比较当前收盘价与一定周期内的平均真实波幅(ATR)来判断趋势方向。该策略使用了7个周期的ATR和2.0的乘数因子来计算超级趋势指标。当超级趋势指标显示上升趋势时,表明市场可能处于多头行情;当超级趋势指标显示下降趋势时,表明市场可能处于空头行情。
该策略通过结合移动平均线和超级趋势指标来生成交易信号。当快线上穿慢线且超级趋势指标显示上升趋势时,触发买入信号;当快线下穿慢线且超级趋势指标显示下降趋势时,触发卖出信号。这种双重过滤机制可以有效地减少假信号,提高交易的准确性。
在交易执行方面,该策略使用了固定的止损和止盈策略。当买入时,止损价格设置为最低价减去1%的波动幅度,止盈价格设置为最高价加上2%的波动幅度;当卖出时,止损价格设置为最高价加上1%的波动幅度,止盈价格设置为最低价减去2%的波动幅度。这种固定的止损止盈策略可以有效地控制风险和锁定利润。
优势分析
-
双重过滤机制:该策略结合了移动平均线和超级趋势指标,通过双重过滤的方式来生成交易信号,可以有效地减少假信号,提高交易的准确性。
-
趋势跟踪能力强:移动平均线和超级趋势指标都是常用的趋势跟踪指标,能够较好地捕捉市场趋势,适合在趋势市场中进行交易。
-
风险控制措施:该策略使用了固定的止损和止盈策略,可以有效地控制风险和锁定利润,避免了过度亏损和利润回吐的情况。
-
参数可调:该策略的参数,如移动平均线的周期、超级趋势指标的参数等,都可以根据不同的市场环境和交易风格进行调整,具有一定的灵活性。
风险分析
-
参数优化风险:该策略的表现可能对参数选择较为敏感,不同的参数组合可能导致不同的结果。因此,在实际应用中需要对参数进行优化和测试,以找到最佳的参数组合。
-
市场风险:该策略适用于趋势市场,在震荡市或者突发事件频发的市场中,可能会出现较多的假信号,导致交易频繁和资金损失。因此,在实际应用中需要结合市场情况和其他分析方法来综合判断。
-
止损止盈风险:该策略使用了固定的止损和止盈策略,虽然可以控制风险和锁定利润,但也可能限制了策略的获利空间。在实际应用中,可以考虑使用更加灵活的止损止盈策略,如追踪止损、动态止盈等。
优化方向
-
参数优化:对策略的关键参数,如移动平均线的周期、超级趋势指标的参数等进行优化,通过回测和前向测试来找到最佳的参数组合,提高策略的稳定性和盈利能力。
-
加入其他过滤条件:除了移动平均线和超级趋势指标外,还可以考虑加入其他技术指标或者基本面因素作为过滤条件,如成交量、相对强弱指标(RSI)、宏观经济数据等,以进一步提高交易信号的可靠性。
-
改进止损止盈策略:可以考虑使用更加灵活的止损止盈策略,如追踪止损、动态止盈等,以适应不同的市场环境和价格走势。这样可以在控制风险的同时,给予策略更大的获利空间。
-
加入仓位管理:可以根据市场趋势的强度、账户风险承受能力等因素,动态调整仓位大小,在趋势强劲时加大仓位,在趋势疲弱或者不确定时减小仓位,以更好地控制风险和提高收益。
总结
该策略通过结合移动平均线和超级趋势指标,形成了一个双重过滤机制来捕捉市场趋势并进行交易。其优势在于趋势跟踪能力强,可以有效地减少假信号,同时通过固定的止损止盈策略来控制风险。但该策略也存在一定的风险,如参数优化风险、市场风险和止损止盈风险等,需要在实际应用中进行优化和改进。
优化方向包括参数优化、加入其他过滤条件、改进止损止盈策略和加入仓位管理等。通过对策略的不断优化和完善,可以提高其稳定性和盈利能力,更好地适应不同的市场环境。
总的来说,该策略为指数基金交易提供了一种可行的思路,通过技术分析手段来捕捉市场趋势,并采取适当的风控措施,有望实现稳定的投资回报。但任何策略都有其局限性,在实际应用中需要结合具体的市场情况和自身的风险偏好,灵活调整和优化,才能发挥其最大的效用。
||
Overview
This strategy combines two commonly used technical indicators: moving averages and the supertrend indicator. It captures market trends through a dual-filter approach and makes trades based on the trend direction. The main idea of the strategy is to use the crossover of fast and slow moving averages to determine the formation of a trend, while using the supertrend indicator to confirm the trend direction, thereby filtering out false signals and improving trading accuracy.
Strategy Principle
The strategy utilizes two technical indicators: moving averages and the supertrend indicator.
Moving averages are a popular trend-following indicator that determines price movements by calculating the average price over a certain period. This strategy uses two simple moving averages (SMA) with different periods: a 10-period SMA and a 30-period SMA. When the fast moving average (10-period SMA) crosses above the slow moving average (30-period SMA), it indicates a potential uptrend; when the fast moving average crosses below the slow moving average, it indicates a potential downtrend.
The supertrend indicator is a trend-following indicator that determines the trend direction by comparing the current closing price with the average true range (ATR) over a certain period. This strategy uses a 7-period ATR and a multiplier factor of 2.0 to calculate the supertrend indicator. When the supertrend indicator shows an uptrend, it suggests that the market may be in a bullish phase; when the supertrend indicator shows a downtrend, it suggests that the market may be in a bearish phase.
The strategy generates trading signals by combining moving averages and the supertrend indicator. When the fast moving average crosses above the slow moving average and the supertrend indicator shows an uptrend, a buy signal is triggered; when the fast moving average crosses below the slow moving average and the supertrend indicator shows a downtrend, a sell signal is triggered. This dual-filter mechanism can effectively reduce false signals and improve trading accuracy.
In terms of trade execution, the strategy employs a fixed stop-loss and take-profit approach. When buying, the stop-loss price is set at the lowest price minus 1% of the price range, and the take-profit price is set at the highest price plus 2% of the price range. When selling, the stop-loss price is set at the highest price plus 1% of the price range, and the take-profit price is set at the lowest price minus 2% of the price range. This fixed stop-loss and take-profit approach can effectively control risks and lock in profits.
Advantage Analysis
-
Dual-filter mechanism: The strategy combines moving averages and the supertrend indicator to generate trading signals through a dual-filter approach, which can effectively reduce false signals and improve trading accuracy.
-
Strong trend-following ability: Both moving averages and the supertrend indicator are commonly used trend-following indicators that can effectively capture market trends, making them suitable for trading in trending markets.
-
Risk control measures: The strategy employs a fixed stop-loss and take-profit approach, which can effectively control risks and lock in profits, avoiding excessive losses and profit givebacks.
-
Adjustable parameters: The parameters of the strategy, such as the periods of moving averages and the parameters of the supertrend indicator, can be adjusted based on different market conditions and trading styles, providing a certain level of flexibility.
Risk Analysis
-
Parameter optimization risk: The performance of the strategy may be sensitive to parameter selection, and different parameter combinations may lead to different results. Therefore, in practical application, parameters need to be optimized and tested to find the optimal combination.
-
Market risk: The strategy is suitable for trending markets. In choppy markets or markets with frequent unexpected events, it may generate more false signals, leading to frequent trades and capital losses. Therefore, in practical application, it is necessary to combine market conditions and other analysis methods for comprehensive judgment.
-
Stop-loss and take-profit risk: The strategy uses a fixed stop-loss and take-profit approach, which can control risks and lock in profits, but it may also limit the profit potential of the strategy. In practical application, more flexible stop-loss and take-profit strategies, such as trailing stop-loss and dynamic take-profit, can be considered.
Optimization Directions
-
Parameter optimization: Optimize the key parameters of the strategy, such as the periods of moving averages and the parameters of the supertrend indicator, and find the optimal parameter combination through backtesting and forward testing to improve the stability and profitability of the strategy.
-
Adding other filter conditions: In addition to moving averages and the supertrend indicator, other technical indicators or fundamental factors can be considered as filter conditions, such as trading volume, relative strength index (RSI), macroeconomic data, etc., to further improve the reliability of trading signals.
-
Improving stop-loss and take-profit strategies: Consider using more flexible stop-loss and take-profit strategies, such as trailing stop-loss and dynamic take-profit, to adapt to different market conditions and price movements. This can provide the strategy with more profit potential while controlling risks.
-
Incorporating position management: Based on factors such as the strength of market trends and the risk tolerance of the account, dynamically adjust position sizes. Increase positions when the trend is strong, and decrease positions when the trend is weak or uncertain, to better control risks and improve returns.
Summary
This strategy captures market trends and makes trades by combining moving averages and the supertrend indicator, forming a dual-filter mechanism. Its advantages lie in its strong trend-following ability and its effectiveness in reducing false signals, while controlling risks through a fixed stop-loss and take-profit approach. However, the strategy also has certain risks, such as parameter optimization risk, market risk, and stop-loss and take-profit risk, which need to be optimized and improved in practical application.
Optimization directions include parameter optimization, adding other filter conditions, improving stop-loss and take-profit strategies, and incorporating position management. By continuously optimizing and refining the strategy, its stability and profitability can be improved to better adapt to different market conditions.
Overall, this strategy provides a feasible approach for index fund trading by capturing market trends through technical analysis and adopting appropriate risk control measures, with the potential to achieve stable investment returns. However, every strategy has its limitations, and in practical application, it needs to be flexibly adjusted and optimized based on specific market conditions and one's own risk preferences to maximize its effectiveness. [/trans]
Strategy Arguments
| Argument | Default | Description |
|---|---|---|
| v_input_int_1 | 7 | ATR Length |
| v_input_float_1 | 2 | Factor |
Source (PineScript)
/*backtest
start: 2023-03-02 00:00:00
end: 2024-03-07 00:00:00
period: 1d
basePeriod: 1h
exchanges: [{"eid":"Futures_Binance","currency":"BTC_USDT"}]
*/

//@version=5
strategy("Index Fund Strategy", overlay=true)

// Moving Averages
fastMA = ta.sma(close, 10)
slowMA = ta.sma(close, 30)

// Supertrend Indicator
atrLength = input.int(7, "ATR Length", minval=1)
factor = input.float(2.0, "Factor", minval=0.1, step=0.1)
[supertrend, direction] = ta.supertrend(factor, atrLength)

// Entry Conditions
longCondition = ta.crossover(fastMA, slowMA) and direction > 0
shortCondition = ta.crossunder(fastMA, slowMA) and direction < 0

// Plot Entry Signals
plotshape(longCondition, style=shape.triangleup, location=location.belowbar, color=color.green, size=size.small, title="Buy Signal")
plotshape(shortCondition, style=shape.triangledown, location=location.abovebar, color=color.red, size=size.small, title="Sell Signal")

// Strategy
if (longCondition)
    stopLoss = low - (high - low) * 0.01 // 1% stop loss
    takeProfit = high + (high - low) * 0.02 // 2% take profit
    strategy.entry("Buy", strategy.long, stop=stopLoss, limit=takeProfit)
else if (shortCondition)
    stopLoss = high + (high - low) * 0.01 // 1% stop loss
    takeProfit = low - (high - low) * 0.02 // 2% take profit
    strategy.entry("Sell", strategy.short, stop=stopLoss, limit=takeProfit)
Detail
https://www.fmz.com/strategy/443986
Last Modified
2024-03-08 14:13:40