
13 KiB
Name
基于布林带和分形突破的动态转折点策略-Dynamic-Reversal-Point-Strategy-Based-on-Bollinger-Bands-and-Fractal-Breakouts
Author
ChaoZhang
Strategy Description
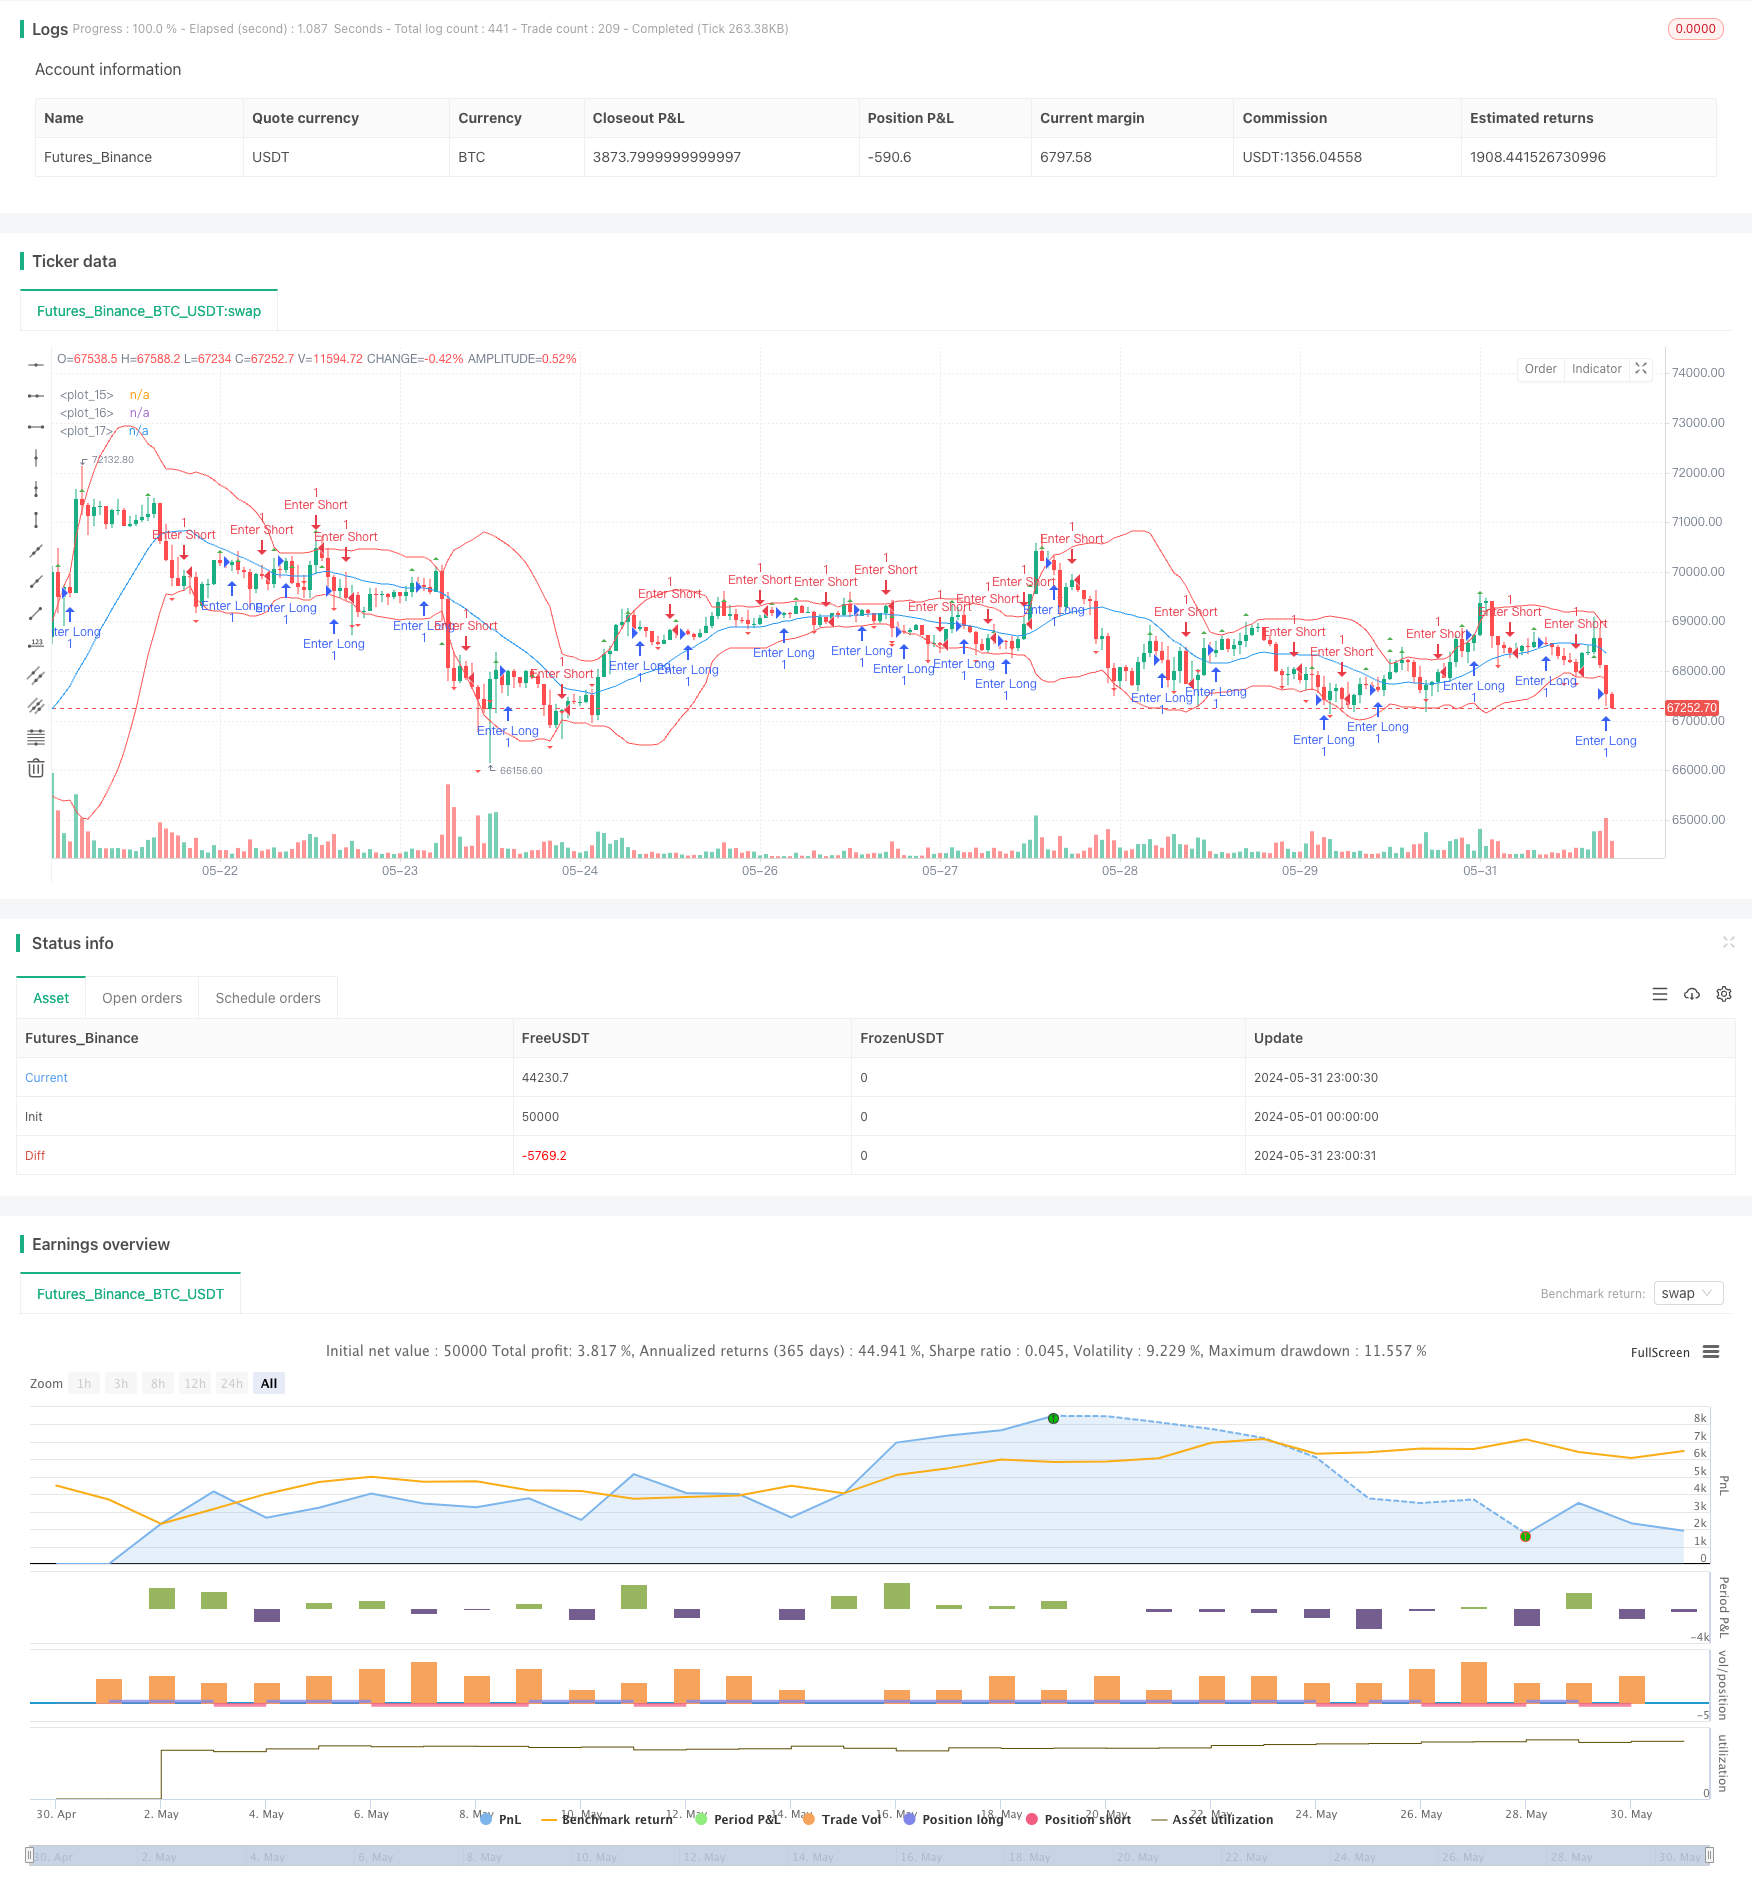 [trans]
概述
这个策略是一个结合了布林带和价格分形的动态转折点识别系统。它旨在捕捉市场的主要反转点,通过识别价格突破布林带以及突破重要分形水平来生成交易信号。该策略利用了技术分析中常用的布林带指标和价格分形理论,试图在波动的市场中找到高概率的交易机会。
策略原理
策略的核心原理基于以下几个关键元素:
-
布林带:使用20周期的简单移动平均线(SMA)作为中轨,上下轨分别为中轨加减2倍标准差。布林带用于判断价格是否处于超买或超卖状态。
-
价格分形:策略使用5根K线来识别看涨和看跌分形。看涨分形出现在当前K线的高点高于前后两根K线的高点时;看跌分形则相反。
-
突破信号:
- 当价格跌破布林带下轨时,标记为潜在的下跌突破。
- 如果在下跌突破后,价格上涨突破最近的看涨分形高点,则生成做多信号。
- 当价格突破布林带上轨时,标记为潜在的上涨突破。
- 如果在上涨突破后,价格下跌突破最近的看跌分形低点,则生成做空信号。
-
交易执行:
- 在识别到看涨分形时开仓做多。
- 在识别到看跌分形时开仓做空。
这种设计结合了趋势跟踪和反转交易的元素,旨在捕捉主要的市场转折点。
策略优势
-
多重确认:策略结合了布林带和价格分形两个独立的技术指标,提供了多重确认,可以降低假突破的风险。
-
动态适应:布林带能够根据市场波动性自动调整,使策略能够适应不同的市场环境。
-
趋势和反转兼顾:策略既可以捕捉趋势的延续(通过分形突破),又可以识别潜在的反转点(通过布林带突破),增加了策略的灵活性。
-
清晰的进场点:通过明确的条件(布林带突破和分形突破)定义了清晰的交易信号,减少了主观判断的需要。
-
可视化辅助:策略在图表上绘制了布林带和分形点,有助于交易者直观地理解市场结构和潜在的交易机会。
策略风险
-
滞后性:使用20周期的布林带和5根K线的分形可能导致信号产生的滞后,在快速市场中可能错过一些机会。
-
假突破:在震荡市场中,价格可能频繁突破布林带或分形水平,但并未形成真正的趋势,可能导致频繁的假信号。
-
缺乏止损机制:当前策略没有明确的止损规则,可能导致在错误的交易中承受过大损失。
-
过度交易:在波动较大的市场中,策略可能生成过多的交易信号,增加交易成本。
-
单一时间框架:策略仅基于单一时间框架的数据,可能忽视了更大时间框架的重要市场结构。
策略优化方向
-
引入止损和止盈:可以考虑在布林带中轨或对侧布林带设置止损点,并根据ATR(平均真实波幅)动态调整止损水平。
-
增加交易过滤器:可以引入额外的指标(如RSI或MACD)来过滤潜在的假突破信号,提高交易质量。
-
多时间框架分析:结合更大时间框架的趋势信息,只有在大趋势方向上的信号才执行交易,可以提高胜率。
-
优化参数:对布林带周期、分形K线数量等参数进行回测优化,找到最适合特定市场的参数组合。
-
加入波动性过滤:在低波动性时期可能需要收紧交易条件,以避免在盘整市场中过度交易。
-
考虑加入移动止损:随着交易盈利的增加,可以逐步提高止损点,锁定部分利润。
-
引入交易量确认:可以结合交易量信息来确认突破的有效性,提高信号的可靠性。
总结
基于布林带和分形突破的动态转折点策略是一个结合了趋势跟踪和反转交易思想的综合系统。它通过布林带来判断价格的相对位置,同时利用价格分形来识别关键的支撑和阻力水平。这种方法旨在捕捉市场的主要转折点,特别适合中长期交易者。
策略的主要优势在于其多重确认机制和动态适应市场波动的能力。然而,它也面临着信号滞后和可能产生假突破的风险。为了提高策略的稳健性,建议引入止损机制、多时间框架分析和额外的交易过滤器。
通过持续优化和调整,这个策略有潜力成为一个可靠的交易系统。但是,像所有交易策略一样,它需要在实际交易中进行充分的测试和验证。交易者在使用此策略时,应当结合自身的风险承受能力和市场经验,并始终保持对市场的警惕和学习态度。
||
Overview
This strategy is a dynamic reversal point identification system that combines Bollinger Bands and price fractals. It aims to capture major market reversal points by identifying price breakouts of Bollinger Bands and important fractal levels to generate trading signals. The strategy utilizes the commonly used Bollinger Bands indicator and price fractal theory in technical analysis, attempting to find high-probability trading opportunities in volatile markets.
Strategy Principles
The core principles of the strategy are based on the following key elements:
-
Bollinger Bands: Uses a 20-period Simple Moving Average (SMA) as the middle band, with upper and lower bands set at 2 standard deviations above and below. Bollinger Bands are used to determine if the price is in overbought or oversold conditions.
-
Price Fractals: The strategy uses 5 candles to identify bullish and bearish fractals. A bullish fractal occurs when the high of the current candle is higher than the highs of the two candles before and after it; a bearish fractal is the opposite.
-
Breakout Signals:
- When the price breaks below the lower Bollinger Band, it's marked as a potential downward breakout.
- If after a downward breakout, the price rises and breaks above the most recent bullish fractal high, a long signal is generated.
- When the price breaks above the upper Bollinger Band, it's marked as a potential upward breakout.
- If after an upward breakout, the price falls and breaks below the most recent bearish fractal low, a short signal is generated.
-
Trade Execution:
- Open a long position when a bullish fractal is identified.
- Open a short position when a bearish fractal is identified.
This design combines elements of trend-following and reversal trading, aiming to capture major market turning points.
Strategy Advantages
-
Multiple Confirmations: The strategy combines two independent technical indicators, Bollinger Bands and price fractals, providing multiple confirmations and reducing the risk of false breakouts.
-
Dynamic Adaptation: Bollinger Bands automatically adjust based on market volatility, allowing the strategy to adapt to different market environments.
-
Balanced Trend and Reversal Approach: The strategy can capture both trend continuation (through fractal breakouts) and potential reversal points (through Bollinger Band breakouts), increasing its flexibility.
-
Clear Entry Points: Clear trading signals are defined through specific conditions (Bollinger Band breakouts and fractal breakouts), reducing the need for subjective judgment.
-
Visual Assistance: The strategy plots Bollinger Bands and fractal points on the chart, helping traders intuitively understand market structure and potential trading opportunities.
Strategy Risks
-
Lag: Using 20-period Bollinger Bands and 5-candle fractals may lead to delayed signals, potentially missing opportunities in fast-moving markets.
-
False Breakouts: In range-bound markets, prices may frequently break Bollinger Bands or fractal levels without forming a real trend, potentially leading to frequent false signals.
-
Lack of Stop-Loss Mechanism: The current strategy doesn't have explicit stop-loss rules, which may lead to excessive losses in incorrect trades.
-
Overtrading: In highly volatile markets, the strategy may generate too many trading signals, increasing transaction costs.
-
Single Timeframe: The strategy is based on data from a single timeframe, potentially overlooking important market structures in larger timeframes.
Strategy Optimization Directions
-
Introduce Stop-Loss and Take-Profit: Consider setting stop-loss points at the middle Bollinger Band or the opposite Bollinger Band, and dynamically adjust stop-loss levels based on ATR (Average True Range).
-
Add Trade Filters: Introduce additional indicators (such as RSI or MACD) to filter potential false breakout signals and improve trade quality.
-
Multi-Timeframe Analysis: Incorporate trend information from larger timeframes, executing trades only in the direction of the larger trend to improve win rates.
-
Optimize Parameters: Conduct backtests to optimize parameters such as Bollinger Band periods and the number of fractal candles to find the best combination for specific markets.
-
Add Volatility Filters: Tighten trading conditions during low volatility periods to avoid overtrading in range-bound markets.
-
Consider Trailing Stops: Gradually raise stop-loss points as trades become profitable to lock in partial profits.
-
Incorporate Volume Confirmation: Combine volume information to confirm the validity of breakouts, improving signal reliability.
Summary
The Dynamic Reversal Point Strategy based on Bollinger Bands and Fractal Breakouts is a comprehensive system that combines trend-following and reversal trading ideas. It uses Bollinger Bands to judge the relative position of prices while utilizing price fractals to identify key support and resistance levels. This method aims to capture major market turning points and is particularly suitable for medium to long-term traders.
The main advantages of the strategy lie in its multiple confirmation mechanisms and ability to dynamically adapt to market volatility. However, it also faces risks of signal lag and potential false breakouts. To improve the robustness of the strategy, it is recommended to introduce stop-loss mechanisms, multi-timeframe analysis, and additional trade filters.
Through continuous optimization and adjustment, this strategy has the potential to become a reliable trading system. However, like all trading strategies, it requires thorough testing and validation in actual trading. Traders using this strategy should combine it with their own risk tolerance and market experience, always maintaining vigilance and a learning attitude towards the market.
[/trans]
Source (PineScript)
/*backtest
start: 2024-05-01 00:00:00
end: 2024-05-31 23:59:59
period: 1h
basePeriod: 15m
exchanges: [{"eid":"Futures_Binance","currency":"BTC_USDT"}]
*/

//@version=5
strategy("Breakdown and Breakup Strategy", overlay=true)

// Bollinger Bands settings
length = input.int(20, title="Bollinger Bands Length")
src = close
mult = input.float(2.0, title="Bollinger Bands Multiplier")

// Calculate Bollinger Bands
basis = ta.sma(src, length)
dev = mult * ta.stdev(src, length)
upper = basis + dev
lower = basis - dev

plot(upper, color=color.red, linewidth=1)
plot(lower, color=color.red, linewidth=1)
plot(basis, color=color.blue, linewidth=1)

// Fractals identification
isBullishFractal = ta.highest(high, 5)[2] == high[2] and high[2] > high[1] and high[2] > high[3]
isBearishFractal = ta.lowest(low, 5)[2] == low[2] and low[2] < low[1] and low[2] < low[3]

// Variables to store the latest fractal values
var float latestBullishFractal = na
var float latestBearishFractal = na

if (isBullishFractal)
    latestBullishFractal := high[2]

if (isBearishFractal)
    latestBearishFractal := low[2]

// Conditions
breakdownCondition = close < lower
breakupCondition = close > latestBullishFractal
breakupUpperCondition = close > upper
breakdownBearishCondition = close < latestBearishFractal

// Variables to track state
var bool breakdownOccurred = false
var bool breakupUpperOccurred = false

// Signals
var bool plotBreakupSignal = false
var bool plotBreakdownSignal = false

// Logic for breakdown and breakup above bullish fractal
if (breakdownCondition)
    breakdownOccurred := true

if (breakdownOccurred and breakupCondition)
    plotBreakupSignal := true
    breakdownOccurred := false

// Logic for breakup and breakdown below bearish fractal
if (breakupUpperCondition)
    breakupUpperOccurred := true

if (breakupUpperOccurred and breakdownBearishCondition)
    plotBreakdownSignal := true
    breakupUpperOccurred := false

// Plot signals as icons
plotshape(series=plotBreakupSignal, location=location.abovebar, color=color.green, style=shape.triangleup, title="Breakup", size=size.small)
plotshape(series=plotBreakdownSignal, location=location.belowbar, color=color.red, style=shape.triangledown, title="Breakdown", size=size.small)

// Plotting fractals for reference
plotshape(series=isBullishFractal, location=location.abovebar, color=color.green, style=shape.triangleup, title="Bullish Fractal", offset=-2)
plotshape(series=isBearishFractal, location=location.belowbar, color=color.red, style=shape.triangledown, title="Bearish Fractal", offset=-2)

// Reset signals
plotBreakupSignal := false
plotBreakdownSignal := false


if isBullishFractal
    strategy.entry("Enter Long", strategy.long)
else if isBearishFractal
    strategy.entry("Enter Short", strategy.short)
Detail
https://www.fmz.com/strategy/455357
Last Modified
2024-06-28 15:06:36