
9.0 KiB
Name
基于多因子模型的自适应趋势追踪策略Trend-Tracking-Strategy-Based-on-Multi-factor-Model-with-Adaptive-Trailing-Stoploss
Author
ChaoZhang
Strategy Description
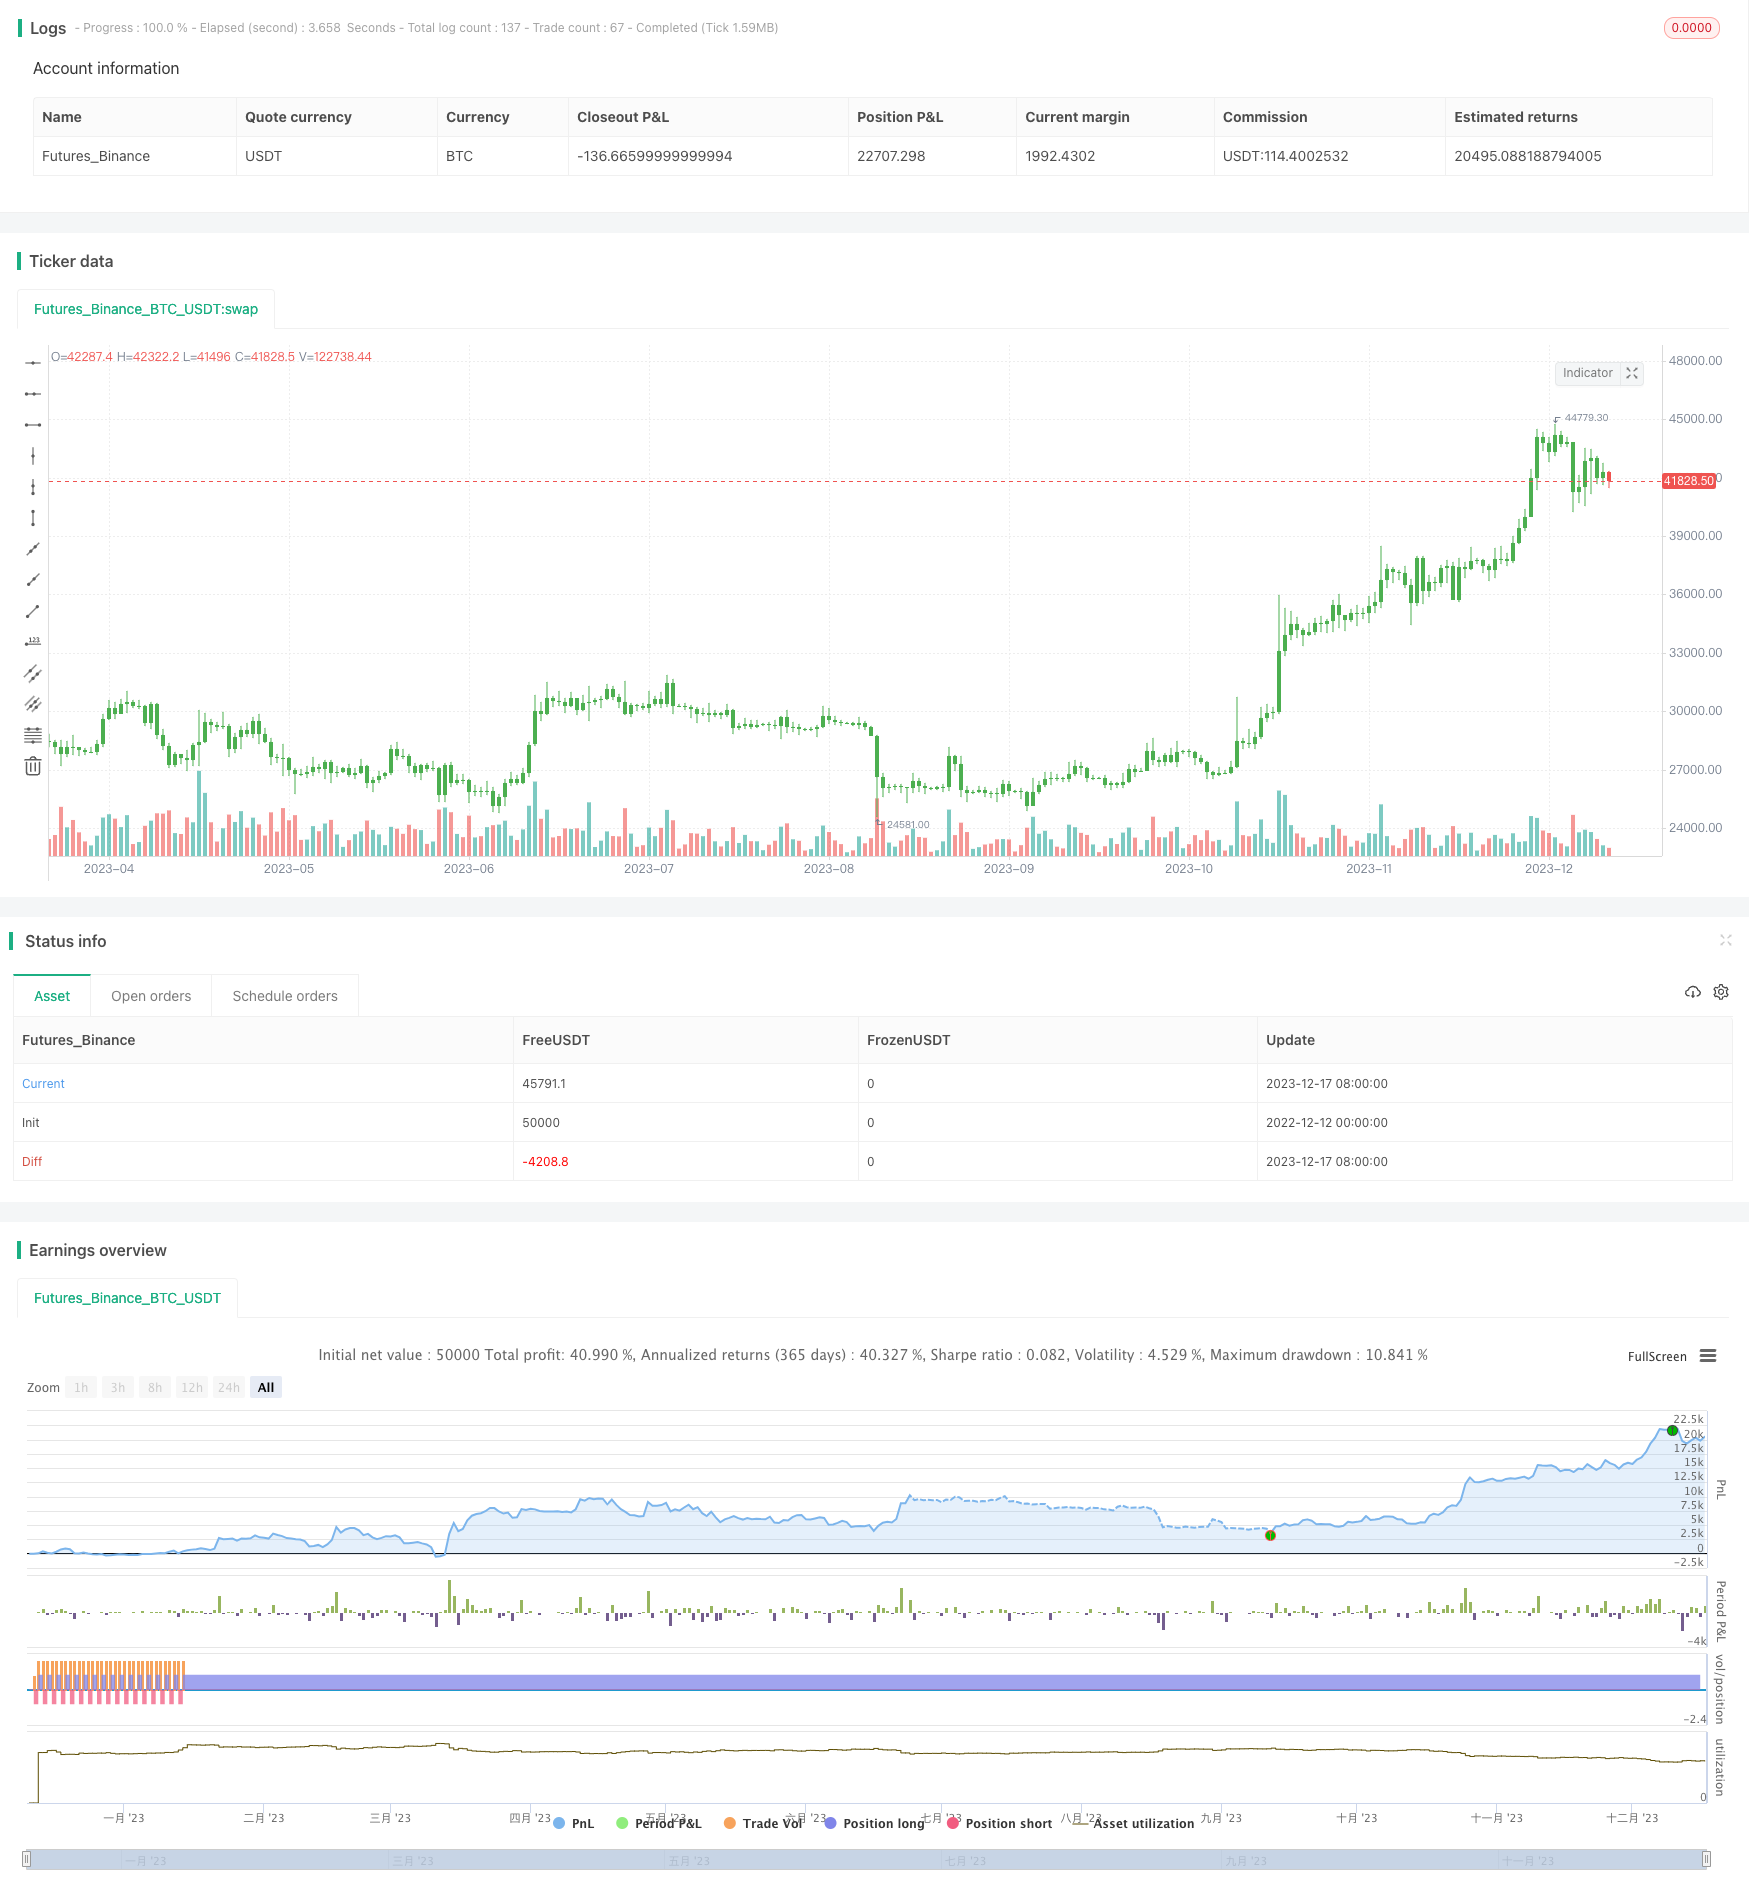 [trans]
概述
该策略是一个多因子模型驱动的自适应趋势追踪策略。它整合了RSI、MACD、Stochastics等多个指标,构建多因子模型判断趋势方向。同时,它具有自适应止损机制,可以根据ATR动态调整止损价格,实现风险控制。
原理
该策略运用多个指标构建判断趋势的模型。首先,它结合RSI、MACD判断趋势方向;然后,结合Stochastics判断是否超买超卖,过滤掉部分信号。在进入订单后,它利用ATR计算风险参数,实现自适应止损。
具体来说,当RSI高于52并且MACD金叉时产生买入信号;当RSI低于48并且MACD死叉时产生卖出信号。为了过滤假信号,它还会检测Stochastics是否超买超卖。在止损方面,它根据ATR计算参数,实现自适应止损,可以有效控制单笔止损风险。
优势
该策略最大的优势在于风险控制能力强。通过多因子模型判断趋势方向,可以过滤掉部分噪音,提高信号质量。同时,自适应止损机制可以根据市场波动程度调整止损幅度,有效控制单笔损失。
此外,该策略参数设置合理,回测效果较好。不同周期资产可以通过调整参数实现最佳化。它可以通过参数优化适应更多市场环境。
风险
该策略主要风险在于多因子模型构建的质量。如果模型构建不当,不能有效判别趋势,则会产生大量错误信号。此外,止损策略本身就存在被套利的风险。
为降低这些风险,可以从调整模型权重、优化参数设置、组合其他止损策略等方面进行改进。当出现异常市场时,手工干预也是必要的。
优化方向
该策略可以从以下几个方面进行优化:
-
调整多因子模型中的指标权重,找到最优权重组合
-
测试更多指标,如CCI、波动率等,丰富多因子模型
-
优化参数设置,适应更多品种和周期
-
尝试不同的止损策略,寻找最佳组合
-
增加模型训练和策略评估模块,实现机器学习驱动
总结
该策略整合多因子模型和自适应止损机制,实现了趋势判断和风险控制的有机结合。它回测效果良好,具有扩展性。通过持续优化,它可以成为一个值得长期持有的定量策略。
||
Overview
This strategy is a trend tracking strategy driven by a multi-factor model with adaptive trailing stoploss. It incorporates multiple indicators like RSI, MACD, Stochastics to build a multi-factor model to determine the trend direction. Meanwhile, it features an adaptive trailing stoploss mechanism that dynamically adjusts stoploss price based on ATR to realize risk control.
Principles
This strategy leverages multiple indicators to build a model for judging trend. Firstly, it combines RSI and MACD to determine trend direction; then it uses Stochastics to filter excessively overbought or oversold signals. After entering orders, it utilizes ATR to calculate risk parameter and implement adaptive stoploss.
Specifically, it generates buy signal when RSI is above 52 and MACD golden cross happens; it generates sell signal when RSI is below 48 and MACD dead cross occurs. To filter fake signals, it also detects whether Stochastics is overbought or oversold. For stoploss, it calculates parameter based on ATR to realize adaptive stoploss, which can effectively control single stoploss risk.
Advantages
The biggest advantage of this strategy lies in its strong risk control capability. By judging trend direction with multi-factor model, it can filter some noise and improve signal quality. Meanwhile, the adaptive stoploss mechanism can adjust stoploss range based on market volatility to effectively control single loss.
In addition, parameters of this strategy are reasonably set with good backtesting results. Different cycle assets can achieve optimization through parameter tuning. It can fit more market environments through parameter optimization.
Risks
The main risk of this strategy is the quality of multi-factor model construction. If the model fails to effectively determine the trend, it would generate massive fake signals. Also, stoploss strategies inherently bear the risk of being hunted.
To mitigate these risks, improvements can be made from aspects like adjusting model weight, optimizing parameter settings, combining with other stoploss strategies. Manual intervention is also necessary when abnormal market occurs.
Optimization Directions
This strategy can be optimized from the following aspects:
-
Adjust weights of indicators in the multi-factor model to find optimal combination
-
Test more indicators like CCI, volatility etc to enrich the multi-factor model
-
Optimize parameter settings to fit more products and cycles
-
Try different stoploss strategies to find optimal combination
-
Add model training and strategy assessment modules to enable machine learning drive
Summary
This strategy integrates multi-factor model and adaptive stoploss mechanism to achieve organic combination of trend judgment and risk control. It has good backtesting results and scalability. With continuous optimization, it can become a quantitative strategy worthwhile for long term holding.
[/trans]
Strategy Arguments
| Argument | Default | Description |
|---|---|---|
| v_input_1_hlc3 | 0 | SOURCE: hlc3 |
| v_input_2 | 14 | RSI LENGTH |
| v_input_3 | 52 | RSI CENTER LINE |
| v_input_4 | 7 | MACD FAST LENGTH |
| v_input_5 | 12 | MACD SLOW LENGTH |
| v_input_6 | 12 | MACD SIGNAL SMOOTHING |
| v_input_7 | 10 | Key Vaule. 'This changes the sensitivity' |
| v_input_8 | 3 | SmoothK |
| v_input_9 | 3 | SmoothD |
| v_input_10 | 14 | LengthRSI |
| v_input_11 | 14 | LengthStoch |
| v_input_12_close | 0 | RSISource: close |
| v_input_13 | 10 | ATR Period |
Source (PineScript)
/*backtest
start: 2022-12-12 00:00:00
end: 2023-12-18 00:00:00
period: 1d
basePeriod: 1h
exchanges: [{"eid":"Futures_Binance","currency":"BTC_USDT"}]
*/

//@version=2
strategy(title="TradersAI_UTBot", overlay = true)
// CREDITS to @HPotter for the orginal code.
// CREDITS to @Yo_adriiiiaan for recently publishing the UT Bot study based on the original code -
// I just added some simple code to turn it into a strategy so that you all can backtest it to see the results for yourself!
// Use this strategy on your favorite instrumnet and timeframe, with your favorite settings
// While @Yo_adriiiiaan mentions it works best on a 4-hour timeframe or above,
// I am  happy to share here this working on a 15-minute chart on e-mini S&P 500 Index (using the KeyValue setting at 10)
// I am sure different people would discover different settings that work best for their preferred instrumnet/timeframe etc.
// Play with it and enjoy! And, don't forget to share any positive results you might get! Good luck with your trading!

SOURCE = input(hlc3)
RSILENGTH = input(14, title = "RSI LENGTH")
RSICENTERLINE = input(52, title = "RSI CENTER LINE")
MACDFASTLENGTH = input(7, title = "MACD FAST LENGTH")
MACDSLOWLENGTH = input(12, title = "MACD SLOW LENGTH")
MACDSIGNALSMOOTHING = input(12, title = "MACD SIGNAL SMOOTHING")
a = input(10, title = "Key Vaule. 'This changes the sensitivity'")
SmoothK = input(3)
SmoothD = input(3)
LengthRSI = input(14)
LengthStoch = input(14)
RSISource = input(close)
c = input(10, title="ATR Period")
xATR = atr(c)
nLoss = a * xATR
xATRTrailingStop = iff(close > nz(xATRTrailingStop[1], 0) and close[1] > nz(xATRTrailingStop[1], 0), max(nz(xATRTrailingStop[1]), close - nLoss),
     iff(close < nz(xATRTrailingStop[1], 0) and close[1] < nz(xATRTrailingStop[1], 0), min(nz(xATRTrailingStop[1]), close + nLoss),
     iff(close > nz(xATRTrailingStop[1], 0), close - nLoss, close + nLoss)))
pos =	iff(close[1] < nz(xATRTrailingStop[1], 0) and close > nz(xATRTrailingStop[1], 0), 1,
     iff(close[1] > nz(xATRTrailingStop[1], 0) and close < nz(xATRTrailingStop[1], 0), -1, nz(pos[1], 0)))
color = pos == -1 ? red: pos == 1 ? green : blue
ema= ema(close,1)
above = crossover(ema,xATRTrailingStop )
below = crossover(xATRTrailingStop,ema)
buy = close > xATRTrailingStop and above
sell = close < xATRTrailingStop and below
barbuy = close > xATRTrailingStop
barsell = close < xATRTrailingStop
plotshape(buy, title = "Buy", text = 'Buy', style = shape.labelup, location = location.belowbar, color= green,textcolor = white, transp = 0, size = size.tiny)
plotshape(sell, title = "Sell", text = 'Sell', style = shape.labeldown, location = location.abovebar, color= red,textcolor = white, transp = 0, size = size.tiny)
barcolor(barbuy? green:na)
barcolor(barsell? red:na)
alertcondition(buy, title='Buy', message='Buy')
alertcondition(sell, title='Sell', message='Sell')

if(buy)
    strategy.entry("UTBotBuy",strategy.long)
if(sell)
    strategy.entry("UTBotSell",strategy.short)
Detail
https://www.fmz.com/strategy/435835
Last Modified
2023-12-19 11:04:27