
7.7 KiB
Name
基于动量增强型简单移动平均线和RSI的趋势跟踪策略-Momentum-Enhanced-Simple-Moving-Average-and-RSI-Strategy-for-Trend-Following
Author
ianzeng123
Strategy Description
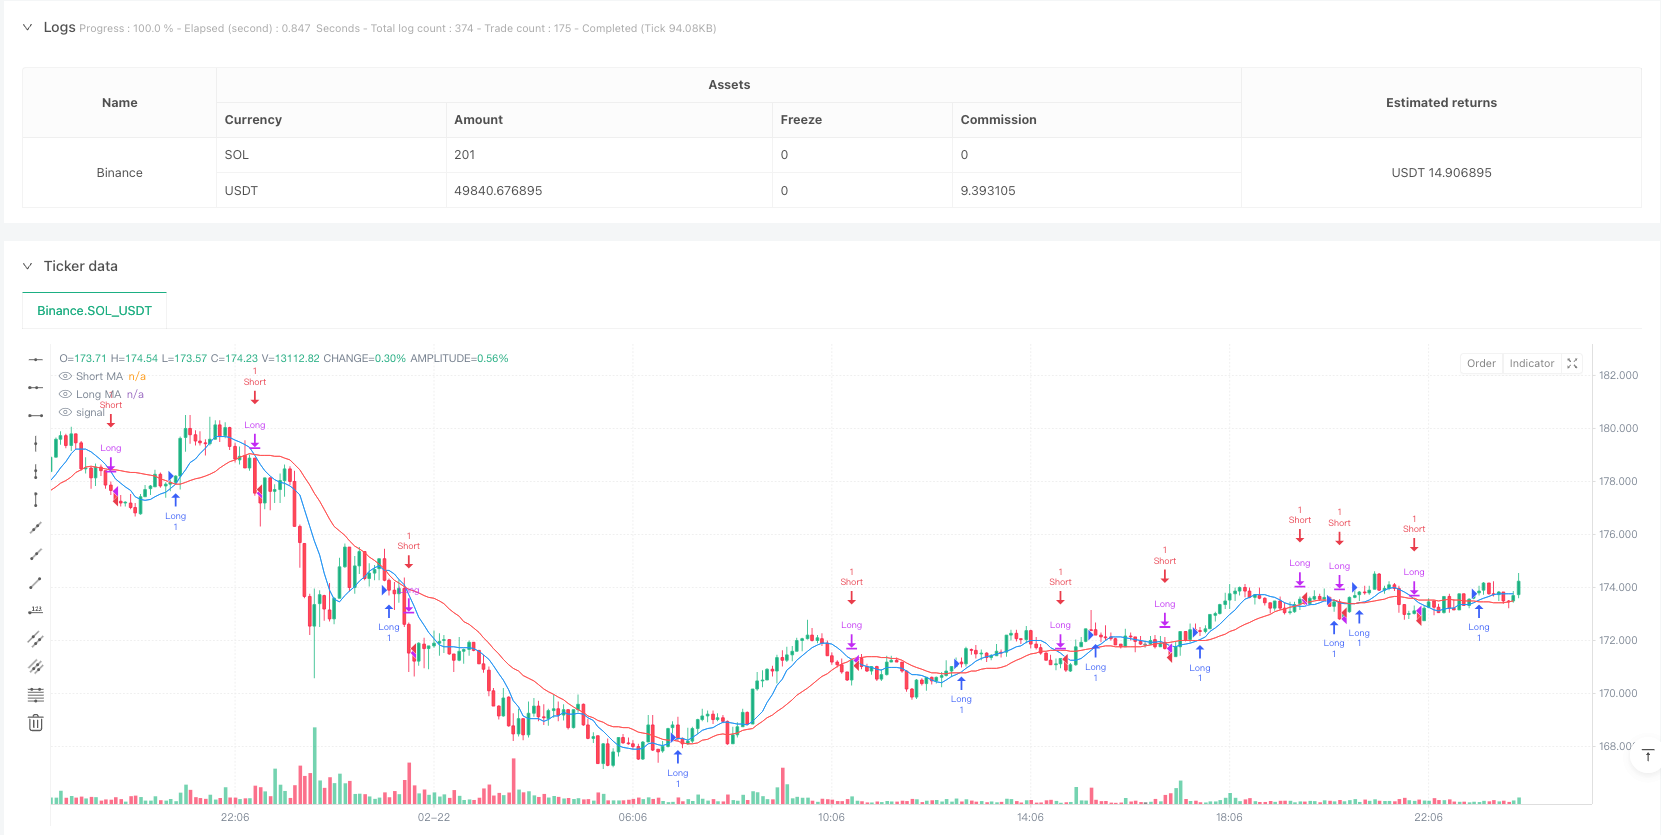
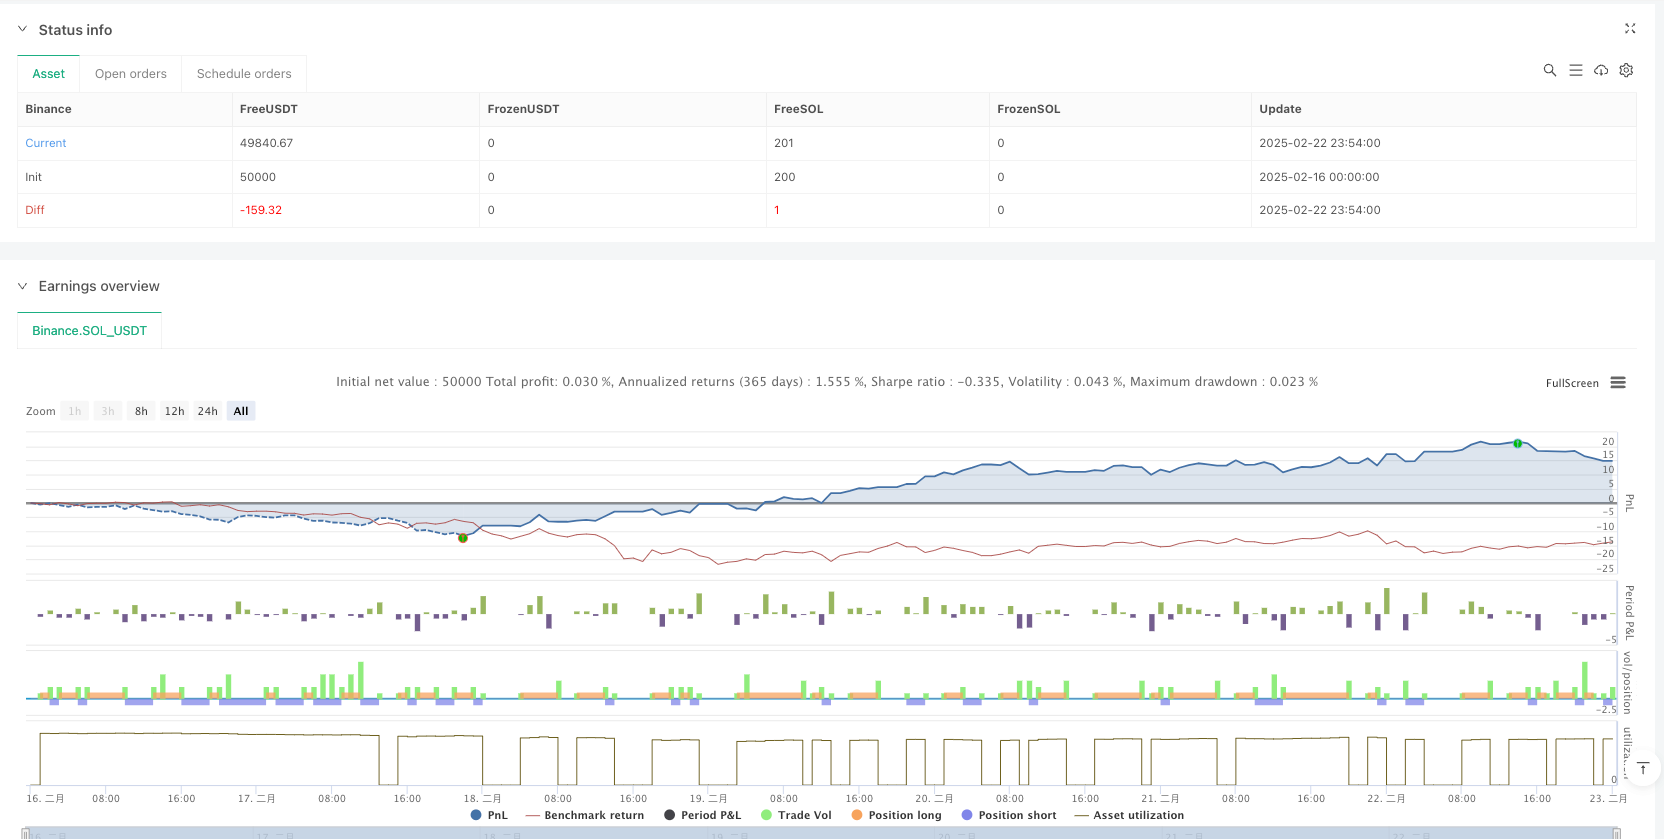
[trans]
概述
本策略是一个结合简单移动平均线(SMA)与相对强弱指标(RSI)的趋势跟踪交易系统。它通过短期和长期移动平均线的交叉来识别趋势方向,并利用RSI进行动量确认,从而在市场中寻找高概率的交易机会。该策略还包含了完整的风险管理模块,可以有效控制每笔交易的风险。
策略原理
策略的核心逻辑基于两个技术指标的配合使用:
- 双均线系统: 采用8周期和21周期的简单移动平均线,通过均线交叉识别趋势变化。当短期均线向上穿越长期均线时产生做多信号,向下穿越时产生做空信号。
- RSI过滤器: 使用14周期的RSI指标进行动量确认。只有当RSI低于70时才执行做多,高于30时才执行做空,以避免在过度买入或卖出的区域进行交易。
- 风险控制: 每笔交易都设置了1%的止损和2%的止盈水平,以保护资金安全和锁定利润。
策略优势
- 指标组合优势: 结合了趋势跟踪和动量指标,能够更准确地识别市场转折点。
- 风险管理完善: 内置止损和止盈机制,可以有效控制风险。
- 参数灵活可调: 所有关键参数都可以根据不同市场环境进行优化。
- 适用性广泛: 可应用于多个市场和多个时间周期。
- 逻辑清晰简单: 策略规则明确,易于理解和执行。
策略风险
- 震荡市场风险: 在横盘震荡市场中可能产生频繁假信号。
- 滞后性风险: 移动平均线本身具有滞后性,可能错过部分盈利机会。
- 参数敏感性: 不同市场环境下可能需要调整参数以保持策略有效性。
- 趋势依赖性: 策略在强趋势市场表现较好,但在其他市场环境下效果可能不佳。
策略优化方向
- 引入市场环境识别机制,在不同市场条件下使用不同的参数组合。
- 增加成交量指标作为辅助确认信号。
- 优化止损止盈机制,可考虑使用动态止损方案。
- 添加趋势强度过滤器,只在强趋势市场下交易。
- 开发自适应参数调整机制,提高策略的适应性。
总结
这是一个结构完整、逻辑清晰的趋势跟踪策略。通过结合SMA和RSI,既能捕捉趋势,又能避免在过度买卖区域交易。内置的风险管理机制确保了策略的稳定性。虽然存在一些固有的局限性,但通过建议的优化方向可以进一步提升策略的性能。该策略特别适合追求稳健收益的交易者使用。
||
Overview
This strategy is a trend-following trading system that combines Simple Moving Averages (SMA) with the Relative Strength Index (RSI). It identifies trend directions through crossovers of short-term and long-term moving averages, uses RSI for momentum confirmation, and seeks high-probability trading opportunities in the market. The strategy includes a comprehensive risk management module for effective control of trading risks.
Strategy Principles
The core logic is based on the combination of two technical indicators:
- Dual MA System: Uses 8-period and 21-period simple moving averages to identify trend changes. Buy signals are generated when the short-term MA crosses above the long-term MA, and sell signals when it crosses below.
- RSI Filter: Employs a 14-period RSI for momentum confirmation. Long positions are only executed when RSI is below 70, and short positions when RSI is above 30, avoiding trades in overextended areas.
- Risk Control: Each trade includes a 1% stop loss and 2% take profit level to protect capital and secure profits.
Strategy Advantages
- Indicator Synergy: Combines trend-following and momentum indicators for more accurate identification of market turning points.
- Robust Risk Management: Built-in stop loss and take profit mechanisms effectively control risk.
- Flexible Parameters: All key parameters can be optimized for different market conditions.
- Wide Applicability: Can be applied across multiple markets and timeframes.
- Clear Logic: Strategy rules are explicit, easy to understand and execute.
Strategy Risks
- Choppy Market Risk: May generate frequent false signals in sideways markets.
- Lag Risk: Moving averages have inherent lag, potentially missing some profit opportunities.
- Parameter Sensitivity: May require parameter adjustments in different market environments.
- Trend Dependency: Strategy performs best in strong trending markets but may underperform in other conditions.
Optimization Directions
- Introduce market environment recognition mechanism for different parameter combinations.
- Add volume indicators as confirmatory signals.
- Optimize stop loss and take profit mechanisms, consider implementing dynamic stop loss.
- Add trend strength filters to trade only in strong trending markets.
- Develop adaptive parameter adjustment mechanisms to improve strategy adaptability.
Summary
This is a comprehensively structured trend-following strategy with clear logic. By combining SMA and RSI, it captures trends while avoiding trades in overextended areas. The built-in risk management ensures strategy stability. While there are some inherent limitations, the suggested optimization directions can further enhance strategy performance. This strategy is particularly suitable for traders seeking stable returns.[/trans]
Source (PineScript)
/*backtest
start: 2025-02-16 00:00:00
end: 2025-02-23 00:00:00
period: 6m
basePeriod: 6m
exchanges: [{"eid":"Binance","currency":"SOL_USDT"}]
*/

//@version=6
strategy("WEN - SMA with RSI Strategy", overlay=true)

// Define input parameters
// SMA Inputs
shortLength = input(8, title="Short MA Length")
longLength = input(21, title="Long MA Length")

// RSI Inputs
rsiLength = input(14, title="RSI Length")
rsiOverbought = input(70, title="RSI Overbought")
rsiOversold = input(30, title="RSI Oversold")

// Calculate indicators
// Moving Averages
shortMA = ta.sma(close, shortLength)
longMA = ta.sma(close, longLength)

// RSI
rsi = ta.rsi(close, rsiLength)

// Plot indicators
plot(shortMA, title="Short MA", color=color.blue)
plot(longMA, title="Long MA", color=color.red)
// RSI is typically plotted in a separate panel in trading platforms

// Entry conditions with RSI confirmation
smaLongCondition = ta.crossover(shortMA, longMA)
smaShortCondition = ta.crossunder(shortMA, longMA)

rsiLongCondition = rsi < rsiOverbought  // Not overbought for long entry
rsiShortCondition = rsi > rsiOversold   // Not oversold for short entry

// Combined entry conditions
longCondition = smaLongCondition and rsiLongCondition
shortCondition = smaShortCondition and rsiShortCondition

// Execute trades
if (longCondition)
    strategy.entry("Long", strategy.long)
if (shortCondition)
    strategy.close("Long")
    strategy.entry("Short", strategy.short)

// Set stop loss and take profit
stopLoss = input(1, title="Stop Loss (%)") / 100
takeProfit = input(2, title="Take Profit (%)") / 100

longStopLossPrice = strategy.position_avg_price * (1 - stopLoss)
longTakeProfitPrice = strategy.position_avg_price * (1 + takeProfit)
shortStopLossPrice = strategy.position_avg_price * (1 + stopLoss)
shortTakeProfitPrice = strategy.position_avg_price * (1 - takeProfit)

strategy.exit("Take Profit / Stop Loss", from_entry="Long", stop=longStopLossPrice, limit=longTakeProfitPrice)
strategy.exit("Take Profit / Stop Loss", from_entry="Short", stop=shortStopLossPrice, limit=shortTakeProfitPrice)
Detail
https://www.fmz.com/strategy/483525
Last Modified
2025-02-24 10:19:03