
7.3 KiB
Name
基于动量与均线组合的多重技术指标趋势跟踪策略-Multi-Technical-Indicator-Momentum-MA-Trend-Following-Strategy
Author
ChaoZhang
Strategy Description
[trans]
概述
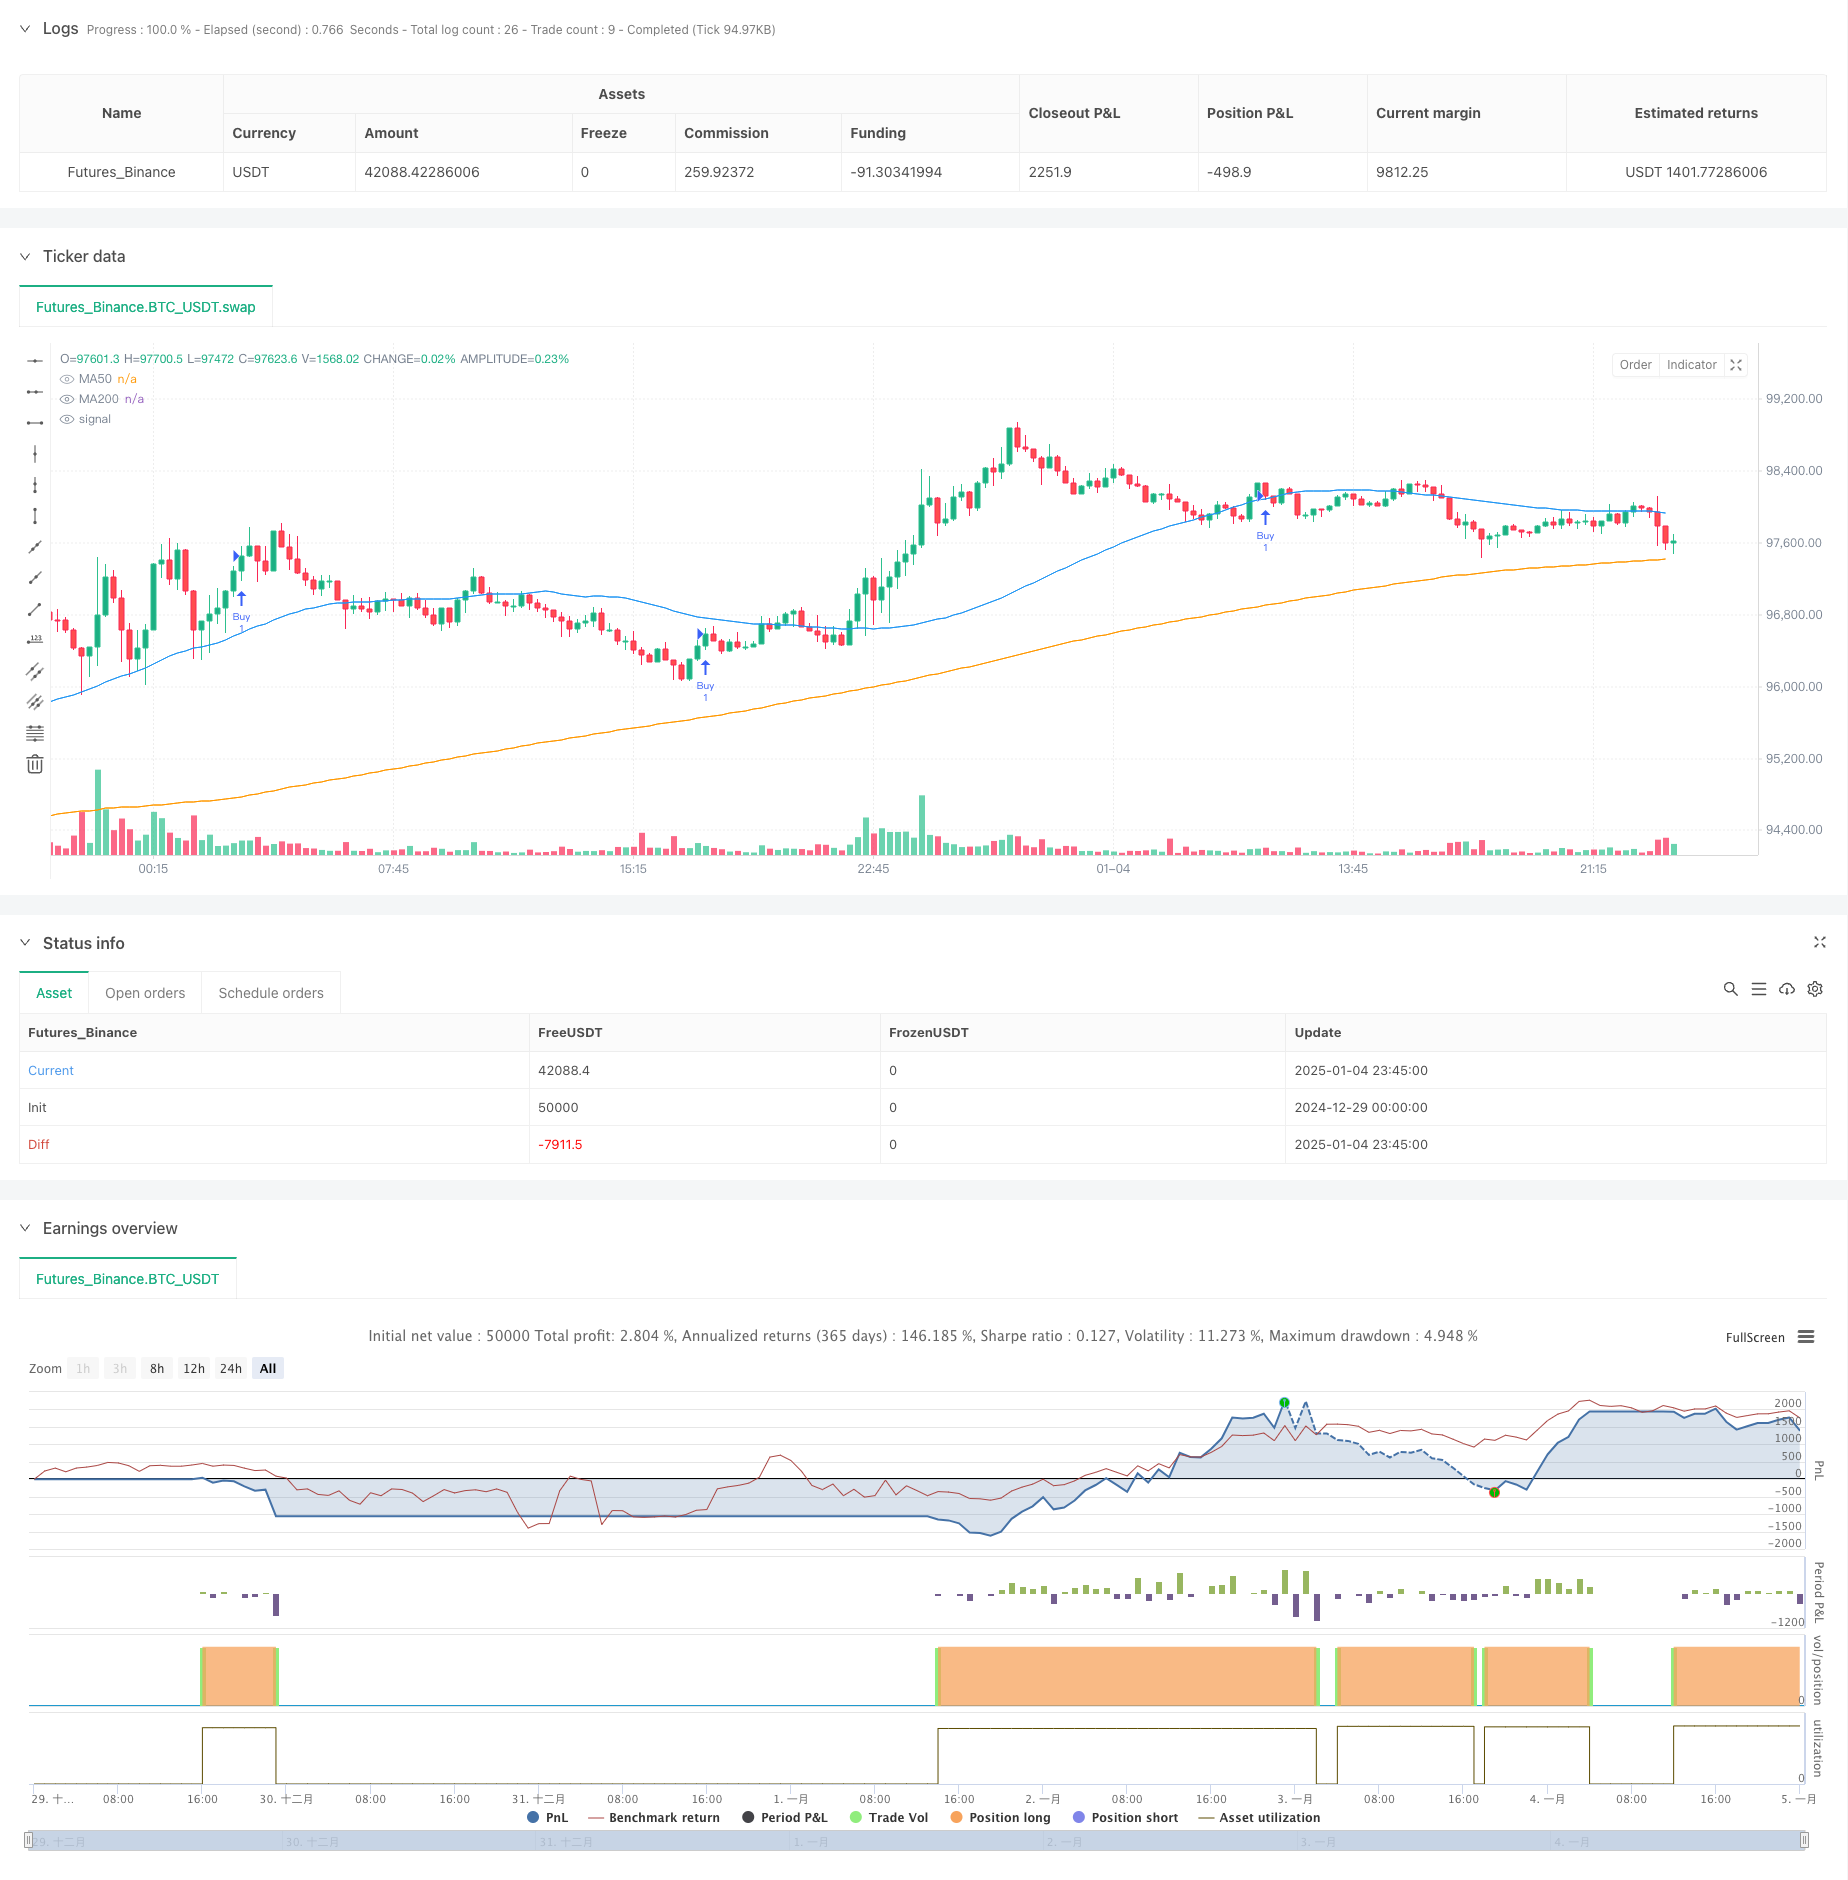
该策略是一个基于多重技术指标的趋势跟踪交易系统,主要结合了MACD指标、RSI指标和移动平均线(MA)进行交易信号的确认。策略采用保守的资金管理方法,通过设定止损和多重获利目标来控制风险。该策略专注于捕捉市场的上涨趋势,仅执行多头交易。
策略原理
策略的核心逻辑基于三重技术指标的协同确认:
- 使用MACD指标识别动量 - 当MACD线上穿信号线时产生初步买入信号
- 使用RSI指标确认强度 - 要求RSI值大于设定阈值(默认50)以确认上涨动能
- 使用均线系统确认趋势 - MA50位于MA200之上时确认整体向上趋势 同时,策略实现了完善的资金管理机制:
- 基于账户总资金设定风险敞口
- 设置固定百分比止损以控制单笔交易风险
- 采用双重获利目标(TP1和TP2)以优化收益
策略优势
- 多重技术指标交叉验证,提高交易信号的可靠性
- 完善的资金管理体系,有效控制风险
- 策略参数可调,适应性强
- 采用双重获利目标,在保护利润的同时不错过大行情
- 代码结构清晰,易于维护和优化
策略风险
- 可能在震荡市场产生过多假信号
- 多重指标确认可能导致入场时机略有滞后
- 仅支持做多,在下跌市场中缺乏对冲机制
- 参数优化过度可能导致过拟合
策略优化方向
- 引入成交量指标作为辅助确认
- 增加市场波动率过滤机制
- 优化出场机制,可考虑加入移动止损
- 引入自适应参数机制,根据市场状态动态调整
- 增加回撤控制机制
总结
该策略通过多重技术指标的协同配合,构建了一个稳健的趋势跟踪系统。完善的资金管理机制和可调参数设计,使其具有良好的实用性和适应性。后续可通过增加市场状态识别、优化出场机制等方式进一步提升策略的稳定性和盈利能力。
||
Overview
This strategy is a trend-following trading system based on multiple technical indicators, combining MACD, RSI, and Moving Averages (MA) for trade signal confirmation. It employs a conservative money management approach with stop-loss and multiple profit targets for risk control. The strategy focuses on capturing upward market trends through long-only positions.
Strategy Principle
The core logic is based on triple technical indicator confirmation:
- MACD for momentum identification - generates initial buy signal when MACD line crosses above signal line
- RSI for strength confirmation - requires RSI value above set threshold (default 50) to confirm upward momentum
- Moving Average system for trend confirmation - MA50 above MA200 confirms overall uptrend Additionally, the strategy implements comprehensive money management:
- Risk exposure based on total account capital
- Fixed percentage stop-loss for individual trade risk control
- Dual profit targets (TP1 and TP2) for optimized returns
Strategy Advantages
- Multiple technical indicator cross-validation increases signal reliability
- Comprehensive money management system for effective risk control
- Adjustable strategy parameters for high adaptability
- Dual profit targets protect profits while capturing larger trends
- Clear code structure for easy maintenance and optimization
Strategy Risks
- Potential false signals in consolidating markets
- Multiple indicator confirmation may lead to slightly delayed entries
- Long-only approach lacks hedging in declining markets
- Parameter optimization risks overfitting
Optimization Directions
- Incorporate volume indicators for additional confirmation
- Add market volatility filtering mechanism
- Enhance exit mechanism with trailing stops
- Implement adaptive parameter system based on market conditions
- Add drawdown control mechanism
Summary
This strategy builds a robust trend-following system through the synergy of multiple technical indicators. Its comprehensive money management mechanism and adjustable parameter design provide good practicality and adaptability. Future improvements can focus on market state identification and exit mechanism optimization to further enhance strategy stability and profitability.
[/trans]
Source (PineScript)
/*backtest
start: 2024-12-29 00:00:00
end: 2025-01-05 00:00:00
period: 15m
basePeriod: 15m
exchanges: [{"eid":"Futures_Binance","currency":"BTC_USDT"}]
*/

//@version=6
strategy("Saudi Market Buy-Only Strategy (Customizable)", overlay=true)

// مدخلات المستخدم لتخصيص القيم
// رأس المال وإدارة المخاطر
capital = input.float(10000, title="رأس المال (ريال)", minval=1000)    // رأس المال الافتراضي
riskPercent = input.float(2, title="نسبة المخاطرة (%)", minval=0.1, maxval=10) / 100  // نسبة المخاطرة
buySLPercent = input.float(1, title="وقف الخسارة (%)", minval=0.1, maxval=10) / 100  // وقف الخسارة
tp1Percent = input.float(2, title="الهدف الأول (%)", minval=0.1, maxval=20) / 100   // الهدف الأول
tp2Percent = input.float(3, title="الهدف الثاني (%)", minval=0.1, maxval=30) / 100 // الهدف الثاني

// إعدادات المؤشرات الفنية
macdFastLength = input.int(12, title="MACD - فترة المتوسط السريع", minval=1)
macdSlowLength = input.int(26, title="MACD - فترة المتوسط البطيء", minval=1)
macdSignalLength = input.int(9, title="MACD - فترة الإشارة", minval=1)

rsiLength = input.int(14, title="RSI - فترة المؤشر", minval=1)
rsiThreshold = input.int(50, title="RSI - مستوى الدخول", minval=1, maxval=100)

ma50Length = input.int(50, title="MA50 - فترة المتوسط المتحرك", minval=1)
ma200Length = input.int(200, title="MA200 - فترة المتوسط المتحرك", minval=1)

// حساب إدارة المخاطر
riskAmount = capital * riskPercent  // قيمة المخاطرة

// حساب المؤشرات الفنية
[macdLine, signalLine, _] = ta.macd(close, macdFastLength, macdSlowLength, macdSignalLength)
rsiValue = ta.rsi(close, rsiLength)
ma50 = ta.sma(close, ma50Length)
ma200 = ta.sma(close, ma200Length)

// تعريف الاتجاه العام للسوق باستخدام المتوسطات
isBullishTrend = ma50 > ma200

// شروط الدخول شراء فقط
if ta.crossover(macdLine, signalLine) and rsiValue > rsiThreshold and isBullishTrend
    entryPrice = close
    stopLoss = entryPrice * (1 - buySLPercent)   // وقف الخسارة أسفل نقطة الدخول
    takeProfit1 = entryPrice * (1 + tp1Percent) // الهدف الأول
    takeProfit2 = entryPrice * (1 + tp2Percent) // الهدف الثاني
    strategy.entry("Buy", strategy.long)        // فتح صفقة شراء
    strategy.exit("TP1", "Buy", limit=takeProfit1, stop=stopLoss)
    strategy.exit("TP2", "Buy", limit=takeProfit2)

// رسم خطوط المتوسطات
plot(ma50, color=color.blue, title="MA50")
plot(ma200, color=color.orange, title="MA200")
Detail
https://www.fmz.com/strategy/477612
Last Modified
2025-01-06 16:56:14