
7.0 KiB
Name
均线-MACD趋势反转量化交易策略-EMA-MACD-Trend-Reversal-Quantitative-Trading-Strategy
Author
ianzeng123
Strategy Description
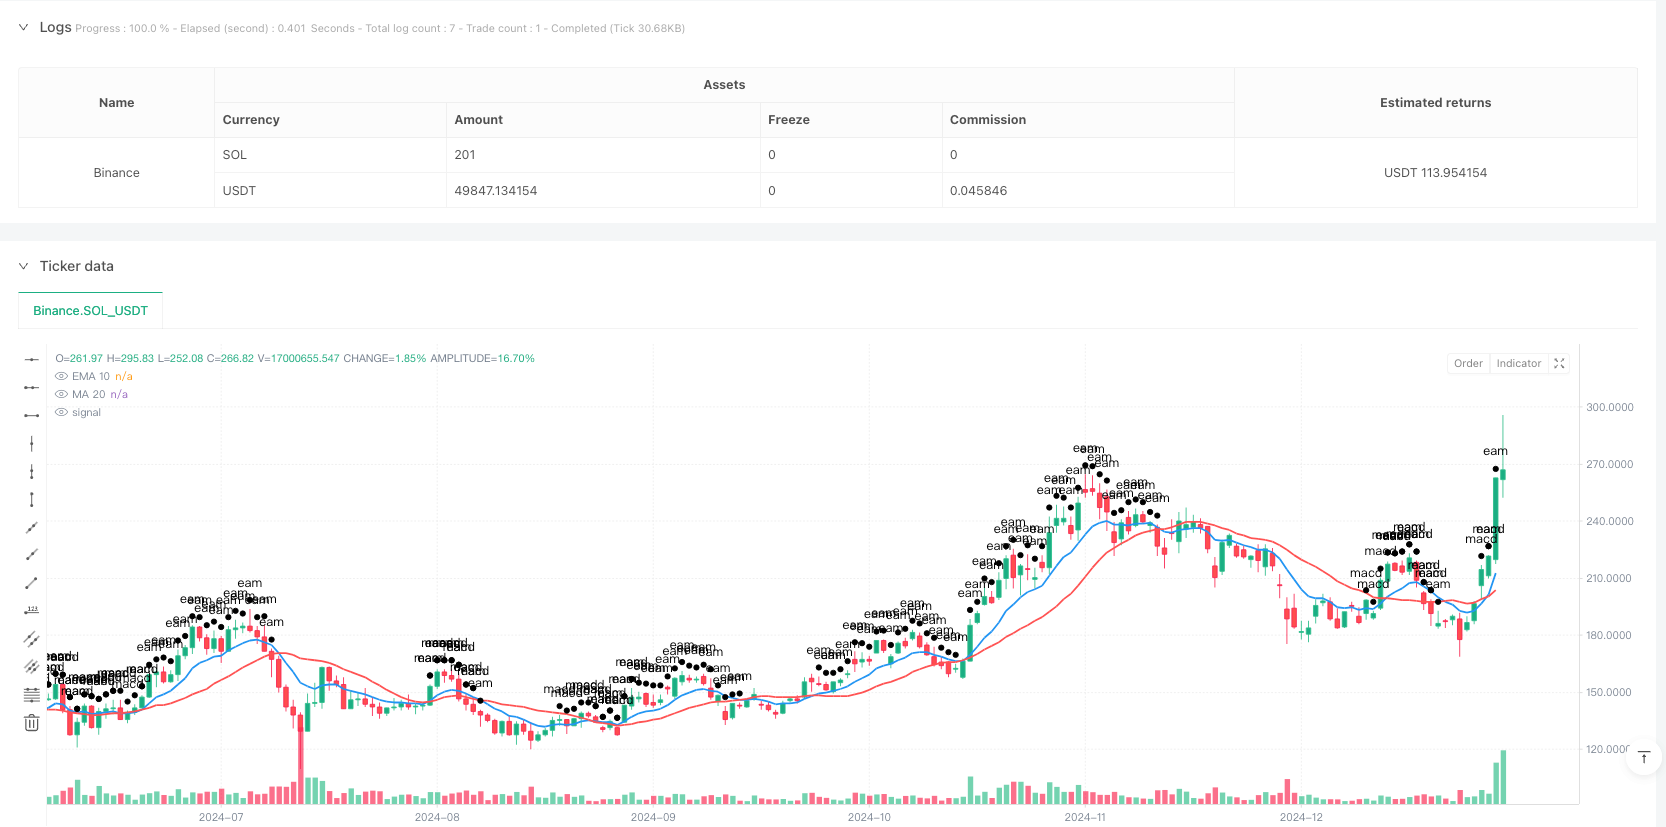
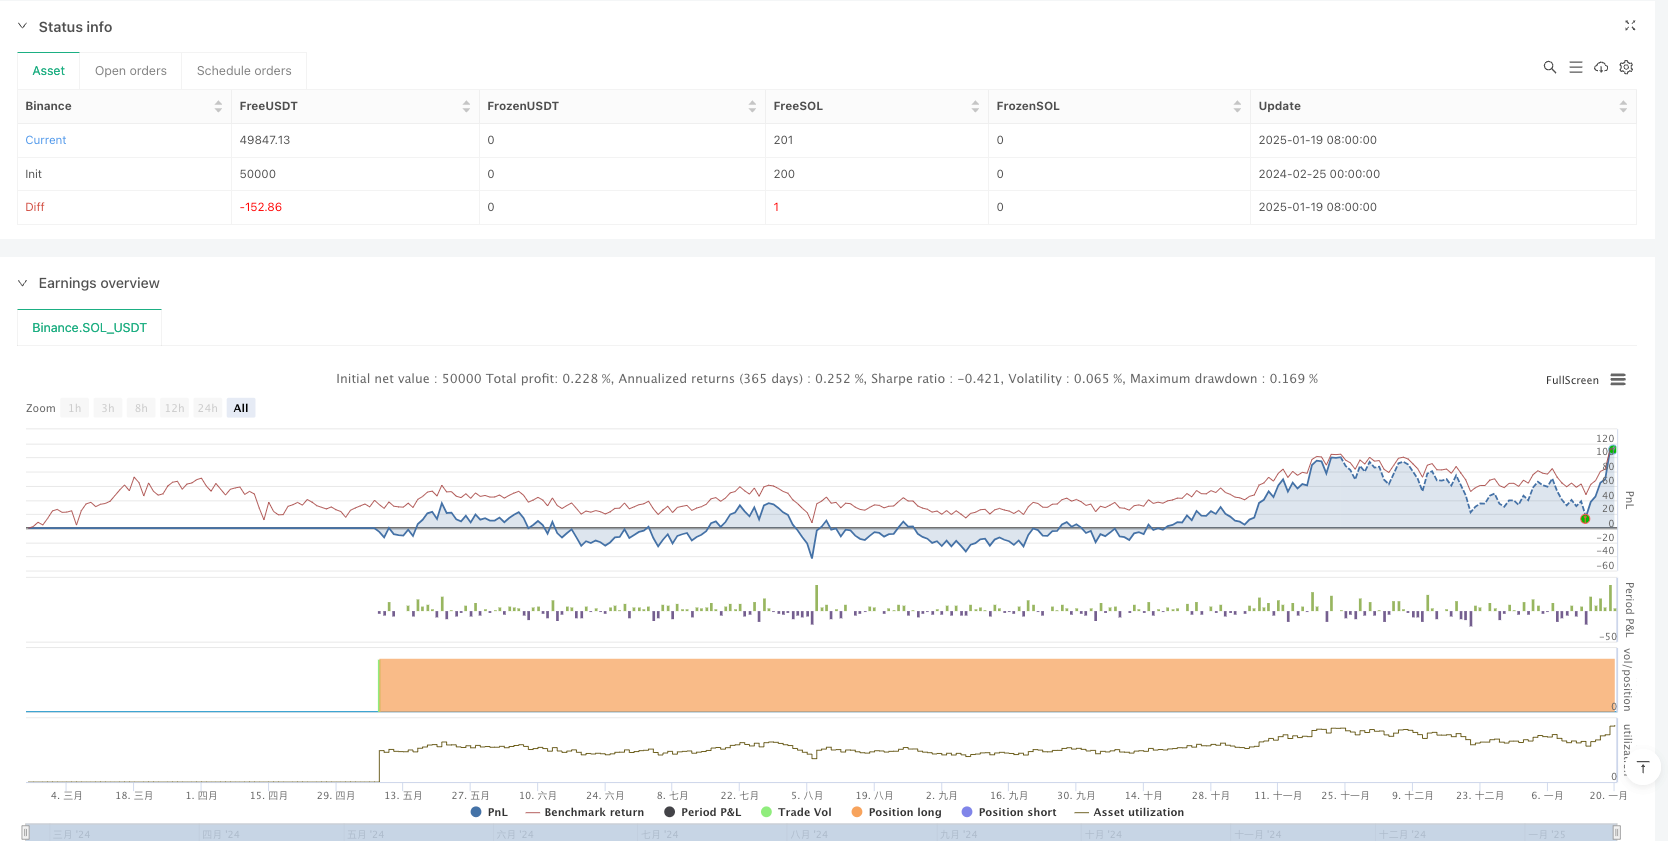
[trans]
概述
本策略是一个基于均线和MACD指标的趋势反转交易系统。它结合了快速指数移动平均线(EMA)、简单移动平均线(SMA)以及MACD指标,通过捕捉市场趋势变化中的买入机会来获取收益。该策略主要关注价格突破均线、MACD指标在零轴下方的底部反转等技术特征,从而在市场即将转势时进行布局。
策略原理
策略采用EMA(10)和MA(20)这两条均线作为趋势判断的基准,同时结合MACD指标(12,26,9)进行信号确认。具体来说,入场信号需要同时满足以下条件:
- EMA(10)上穿MA(20),表明短期走势开始强于中期走势
- MACD指标和信号线都位于零轴以下,但MACD线在信号线上方,显示出潜在的底部反转信号 策略的平仓条件是在MACD差值下穿0且MACD和信号线都位于零轴上方时,表明上涨趋势可能已经结束。
策略优势
- 多重技术指标交叉验证,提高了信号的可靠性
- 结合了趋势和动量指标,既能把握大趋势,又能精确定位入场时机
- 采用EMA和SMA两种均线,既保证了对市场变化的敏感度,又能过滤掉部分虚假信号
- 清晰的平仓条件有助于及时止盈,避免套牢
策略风险
- 在震荡市场中可能产生频繁的假突破信号
- 均线系统具有一定滞后性,可能错过最佳入场时机
- MACD指标在剧烈波动的市场中可能产生滞后信号
- 没有明确的止损机制,在市场剧烈波动时可能带来较大损失
策略优化方向
- 引入波动率指标(如ATR),用于动态调整持仓规模和止损位置
- 增加趋势强度过滤器,避免在弱趋势中交易
- 优化均线参数,可以根据不同市场特征选择最优参数组合
- 添加成交量指标验证,提高信号可靠性
- 构建更完善的资金管理系统,包括分批建仓和动态调仓机制
总结
该策略通过均线系统和MACD指标的配合使用,构建了一个相对完整的趋势反转交易系统。虽然存在一定的滞后性和假信号风险,但通过合理的参数优化和风险控制措施,仍然具有较好的实战应用价值。建议在实盘使用时,结合市场环境和个人风险偏好,对策略参数进行针对性调整。 ||
Overview
This strategy is a trend reversal trading system based on moving averages and MACD indicators. It combines Fast Exponential Moving Average (EMA), Simple Moving Average (SMA), and MACD indicator to capture profit opportunities during market trend changes. The strategy focuses on price breakouts above moving averages and MACD bottom reversal signals below the zero line to position trades before potential market reversals.
Strategy Principle
The strategy uses EMA(10) and MA(20) as trend judgment benchmarks, combined with MACD indicator (12,26,9) for signal confirmation. Specifically, entry signals require the following conditions to be met simultaneously:
- EMA(10) crosses above MA(20), indicating short-term momentum is becoming stronger than medium-term trend
- Both MACD and signal lines are below the zero line, but MACD line is above the signal line, showing potential bottom reversal signals The exit condition is triggered when the MACD delta crosses below 0 while both MACD and signal lines are above the zero line, suggesting the uptrend may have ended.
Strategy Advantages
- Multiple technical indicators cross-validation improves signal reliability
- Combines trend and momentum indicators for both trend capture and precise entry timing
- Uses both EMA and SMA to balance market sensitivity and false signal filtering
- Clear exit conditions help secure profits and avoid being trapped
Strategy Risks
- May generate frequent false breakout signals in ranging markets
- Moving average system has inherent lag, potentially missing optimal entry points
- MACD indicator may generate lagging signals in volatile markets
- Lacks explicit stop-loss mechanism, potentially leading to significant losses in volatile markets
Strategy Optimization Directions
- Introduce volatility indicators (like ATR) for dynamic position sizing and stop-loss placement
- Add trend strength filters to avoid trading in weak trends
- Optimize moving average parameters based on different market characteristics
- Add volume indicator verification to improve signal reliability
- Build a more comprehensive money management system, including staged position building and dynamic position adjustment
Summary
This strategy constructs a relatively complete trend reversal trading system through the combination of moving average system and MACD indicator. Although it has certain inherent lag and false signal risks, it still holds practical value through reasonable parameter optimization and risk control measures. When implementing in live trading, it's recommended to adjust strategy parameters based on market conditions and personal risk preference.[/trans]
Source (PineScript)
/*backtest
start: 2024-02-25 00:00:00
end: 2025-01-20 00:00:00
period: 1d
basePeriod: 1d
exchanges: [{"eid":"Binance","currency":"SOL_USDT"}]
*/

//@version=5
strategy("MACD Strategy", overlay=true)

//Macd 参数
fastLength = input(12, title="快线长度")
slowLength = input(26, title="慢线长度")
MACDLength = input(9, title="MACD 信号线长度")

// 计算 MACD
MACD = ta.ema(close, fastLength) - ta.ema(close, slowLength)
aMACD = ta.ema(MACD, MACDLength)
delta = MACD - aMACD


// 计算 EMA(10) 和 MA(20)
ema10 = ta.ema(close, 10)
ma20 = ta.sma(close, 20)
// 在图表上绘制 EMA(10) 和 MA(20),用于调试
plot(ema10, title="EMA 10", color=color.blue, linewidth=2)
plot(ma20, title="MA 20", color=color.red, linewidth=2)

// 实时检查条件
// 检查 EMA(10) 是否高于 MA(20)
bool emaAboveMa = ema10 > ma20

// 检查 MACD 是否在信号线上方,且 MACD 和信号线均在 0 轴下方
bool macdCondition = (MACD > aMACD) and (MACD < 0) and (aMACD < 0)

// 添加调试信息 - 当条件满足时绘制图形
plotshape(emaAboveMa, title="EMA Above MA Condition",  size=size.small, text="eam")
plotshape(macdCondition, title="MACD Condition", size=size.small, text="macd")

// 当两个条件都满足时,触发买入操作
if (emaAboveMa and macdCondition)
    strategy.entry("多头", strategy.long, comment="买入信号")
    // 显示买入信号的标签
    label.new(bar_index, high, "买入", textcolor=color.white, style=label.style_label_up, size=size.normal)

// 平仓条件
if (ta.crossunder(delta, 0) and MACD > 0 and aMACD > 0)
    strategy.close("MacdLE", comment="Close Long")
//if (ta.crossunder(delta, 0))
//	strategy.entry("MacdSE", strategy.short, comment="MacdSE")
//plot(strategy.equity, title="equity", color=color.red, linewidth=2, style=plot.style_areabr)
Detail
https://www.fmz.com/strategy/483508
Last Modified
2025-02-27 16:49:52