
9.4 KiB
Name
双重移动平均线反转策略Dual-Moving-Average-Reversal-Strategy
Author
ChaoZhang
Strategy Description
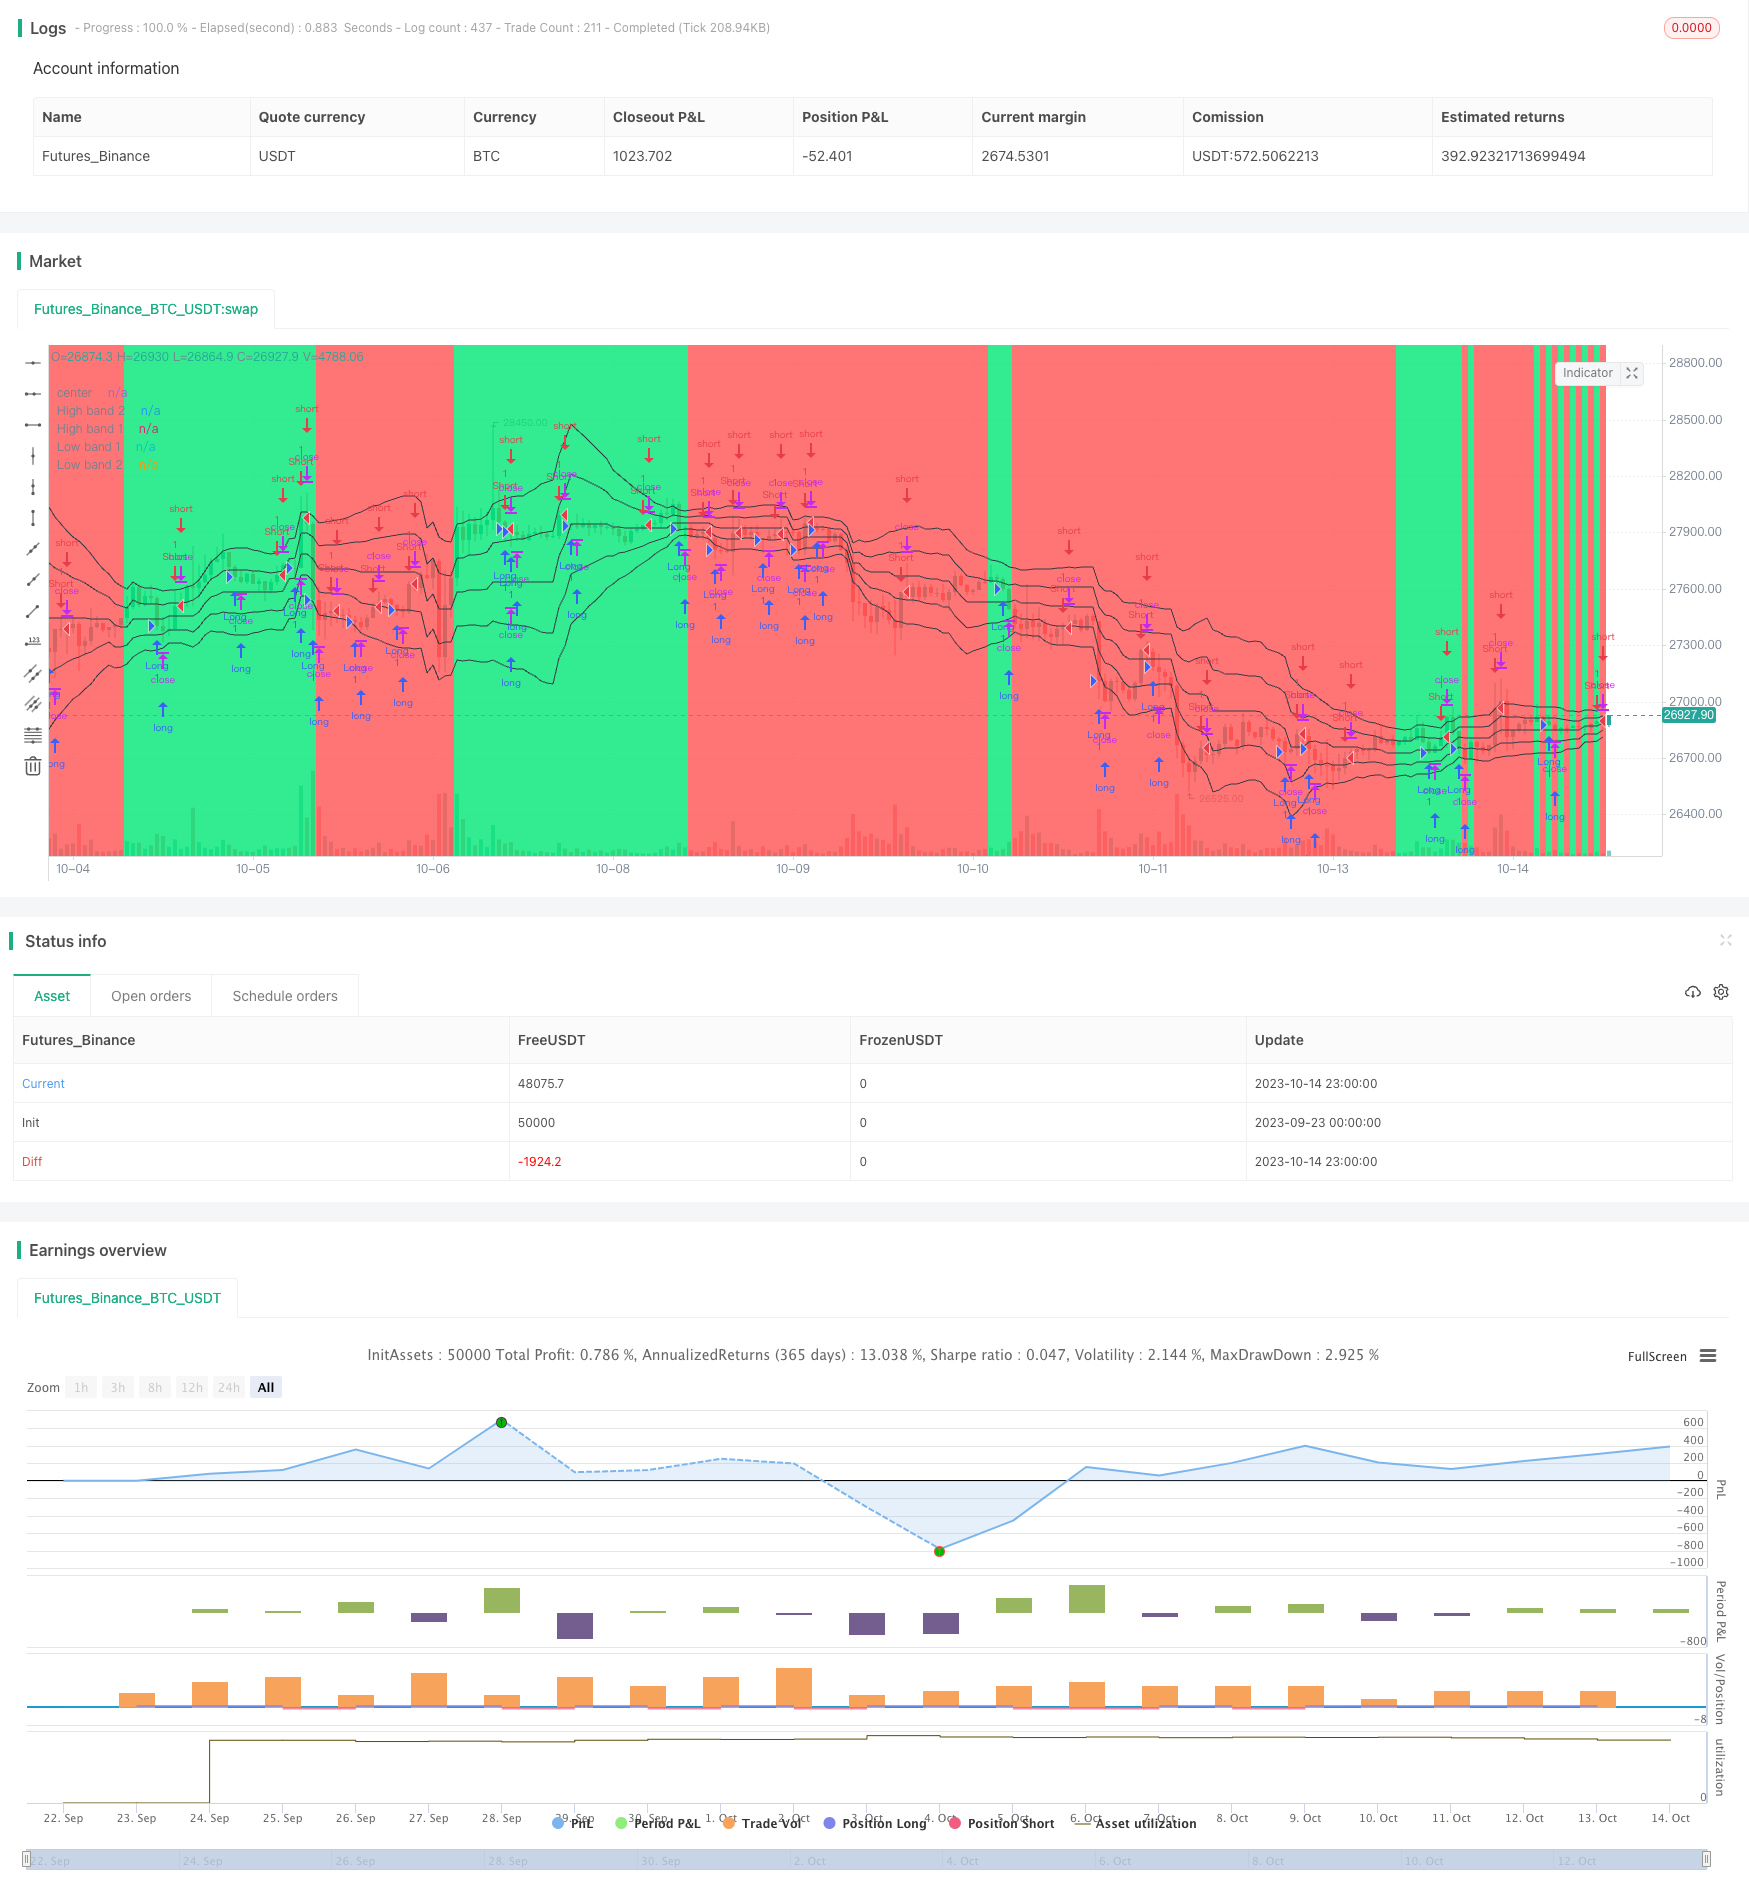
[trans]
概述
该策略主要利用双重移动平均线作为买入和卖出信号,在趋势反转时获利。当短期移动平均线上穿长期移动平均线时做多,当短期移动平均线下穿长期移动平均线时做空,属于常见的跟踪止损策略。
策略原理
该策略首先设置两个移动平均线,一个较短期的20日均线,一个较长期的60日均线。然后判断短期均线和长期均线的交叉情况来决定入场。
具体来说,当短期均线上穿长期均线时,表示目前处于上升趋势,这时做多;当短期均线下穿长期均线时,表示目前处于下降趋势,这时做空。
做多做空后的止损方式是跟踪止损,根据最高价和最低价来trailing stop,可以锁定最大利润。
代码主要逻辑如下:
- 计算20日EMA和60日EMA
- 判断20日EMA是否上穿60日EMA,如果是则做多
- 判断20日EMA是否下穿60日EMA,如果是则做空
- 进入做多仓位后,以最高价的3%作为止损线
- 进入做空仓位后,以最低价的3%作为止损线
- 持仓时持续调整止损线
优势分析
该策略具有以下优势:
- 思路简单易懂,容易实现。
- 采用双重均线,可以有效过滤假突破。
- 采用跟踪止损,可以锁定最大利润。
- 在趋势转换时,可以及时捕捉信号。
- 回撤控制得当,相对稳定。
风险分析
该策略也存在一些风险:
- 当趋势不明显时,双重均线可能出现频繁交叉,导致频繁交易亏损。
- 止损范围设定不当可能导致止损过于宽松或过于激进。
- 参数设定如周期长度不当,可能导致错过关键信号点。
- 交易费用较高,影响盈利空间。
针对风险,可以通过以下方式进行优化:
- 在趋势不明显时,采用过滤系统,避免盲目交易。
- 对止损范围进行测试优化,设置合适的止损范围。
- 通过回测和参数调优找到最佳的参数设定。
- 适当缩减开仓手数,降低交易费用。
优化思路
该策略可以从以下几个方面进行进一步优化:
-
增加其他指标过滤,形成多重条件入场机制,避免假突破。例如可以加入RSI指标判定。
-
优化移动均线的周期参数,找到最佳参数组合。可以通过步进遍历方式测试不同周期参数。
-
优化止损范围。可以通过回测数据计算出最佳的止损范围。也可以设置动态止损范围。
-
设置再入场机制。在止损退出后,可以设置合理的再入场逻辑,减少交易次数。
-
结合趋势判断指标,在趋势不明显时暂停交易,避免无效交易。
-
加入仓位管理机制,根据市场情况动态调整仓位和止损范围。
总结
该双重移动平均线反转策略整体来说较为简单实用,通过双均线判断趋势转折点,属于一种常见而有效的方法。但存在一定风险,需要对参数设定及止损范围进行优化测试,并加入其他过滤指标进行配合使用,才能发挥策略最大效用。如果经过细致优化和严格的风险管理,该策略可以成为稳定盈利的波段交易策略。
||
Overview
This strategy mainly uses dual moving averages as buy and sell signals to profit from trend reversals. It goes long when the short-term moving average crosses above the long-term moving average, and goes short when the short-term moving average crosses below the long-term moving average. It belongs to a common trailing stop loss strategy.
Strategy Logic
The strategy first sets up two moving averages, one shorter-term 20-day MA and one longer-term 60-day MA. It then judges the crossing situations between the two MAs to determine entry.
Specifically, when the short-term MA crosses above the long-term MA, it signals an uptrend, so go long. When the short-term MA crosses below the long-term MA, it signals a downtrend, so go short.
The stop loss method after going long or short is trailing stop based on highest price and lowest price to lock in maximum profit.
The main logic of the code is:
- Calculate the 20-day EMA and 60-day EMA
- Judge if 20-day EMA crosses above 60-day EMA, if yes go long
- Judge if 20-day EMA crosses below 60-day EMA, if yes go short
- After going long, set stop loss at 3% below highest price
- After going short, set stop loss at 3% above lowest price
- Keep adjusting stop loss when in positions
Advantage Analysis
The advantages of this strategy are:
- Simple logic easy to implement.
- Dual MA can effectively filter false breaks.
- Trailing stop locks in maximum profit.
- Can timely capture signals when trend changes.
- Proper drawdown control, relatively stable.
Risk Analysis
There are also some risks:
- Frequent crosses between MAs when trend is unclear, leading to overtrading losses.
- Improper stop loss setting can be too loose or too aggressive.
- Wrong parameter settings like period length may miss key signals.
- High trading costs erodes profit margin.
To address the risks:
- Adopt filters when trend is unclear to avoid blind trading.
- Test and optimize stop loss range for proper setting.
- Find optimum parameters through backtest and tuning.
- Reduce position size to lower trading costs.
Optimization Ideas
The strategy can be further optimized in the following areas:
-
Add other filters like RSI for multi-condition entry, avoiding false breaks.
-
Optimize MA periods to find best parameter mix. Can test different periods by incremental walk forward.
-
Optimize stop loss range through backtest calculation to find optimum range. Can also use dynamic stop loss.
-
Set re-entry logic after stop loss exit to reduce trade frequency.
-
Combine with trend indicator to pause trading when trend is unclear.
-
Add position sizing and dynamic stop loss based on market conditions.
Summary
In summary, the dual MA reversal strategy is simple and practical overall, identifying trend turning points through dual MA crossovers. But there are risks that need parameter tuning, stop loss optimization, and adding filters to maximize strategy efficacy. With meticulous optimization and disciplined risk management, it can become a steady profit-bearing swing trading strategy.
[/trans]
Strategy Arguments
| Argument | Default | Description |
|---|---|---|
| v_input_1 | true | Long |
| v_input_2 | true | Short |
| v_input_3 | false | take, % |
| v_input_4 | true | Bands Entry |
| v_input_5 | false | Counter-trend entry |
| v_input_6 | true | Double Body |
| v_input_7 | 20 | Period |
| v_input_8 | true | Show Bands |
| v_input_9 | true | Show Background |
Source (PineScript)
/*backtest
start: 2023-09-23 00:00:00
end: 2023-10-15 00:00:00
period: 1h
basePeriod: 15m
exchanges: [{"eid":"Futures_Binance","currency":"BTC_USDT"}]
*/


//@version=2
strategy("Noro's Bands Scalper Strategy v1.4", shorttitle = "Scalper str 1.4", overlay=true, default_qty_type = strategy.percent_of_equity, default_qty_value=100.0, pyramiding=0)

//Settings
needlong = input(true, defval = true, title = "Long")
needshort = input(true, defval = true, title = "Short")
takepercent = input(0, defval = 0, minval = 0, maxval = 1000, title = "take, %")
needbe = input(true, defval = true, title = "Bands Entry")
needct = input(false, defval = false, title = "Counter-trend entry")
needdb = input(true, defval = true, title = "Double Body")
len = input(20, defval = 20, minval = 2, maxval = 200, title = "Period")
needbb = input(true, defval = true, title = "Show Bands")
needbg = input(true, defval = true, title = "Show Background")
src = close

//PriceChannel 1
lasthigh = highest(src, len)
lastlow = lowest(src, len)
center = (lasthigh + lastlow) / 2

//Distance
dist = abs(src - center)
distsma = sma(dist, len)
hd = center + distsma
ld = center - distsma
hd2 = center + distsma * 2
ld2 = center - distsma * 2

//Trend
trend = close < ld and high < center ? -1 : close > hd and low > center ? 1 : trend[1]

//Lines
colo = needbb == false ? na : black
plot(hd2, color = colo, linewidth = 1, transp = 0, title = "High band 2")
plot(hd, color = colo, linewidth = 1, transp = 0, title = "High band 1")
plot(center, color = colo, linewidth = 1, transp = 0, title = "center")
plot(ld, color = colo, linewidth = 1, transp = 0, title = "Low band 1")
plot(ld2, color = colo, linewidth = 1, transp = 0, title = "Low band 2")

//Background
col = needbg == false ? na : trend == 1 ? lime : red
bgcolor(col, transp = 80)

//Body
body = abs(close - open)
smabody = needdb == false ? ema(body, 30) : ema(body, 30) * 2
candle = high - low

//Signals
bar = close > open ? 1 : close < open ? -1 : 0
up7 = trend == 1 and ((bar == -1 and bar[1] == -1) or (body > smabody and bar == -1)) ? 1 : 0
dn7 = trend == 1 and ((bar == 1 and bar[1] == 1) or (close > hd and needbe == true)) and close > strategy.position_avg_price * (100 + takepercent) / 100 ? 1 : 0
up8 = trend == -1 and ((bar == -1 and bar[1] == -1) or (close < ld2 and needbe == true)) and close < strategy.position_avg_price * (100 - takepercent) / 100 ? 1 : 0
dn8 = trend == -1 and ((bar == 1 and bar[1] == 1) or (body > smabody and bar == 1)) ? 1 : 0

if up7 == 1 or up8 == 1
    strategy.entry("Long", strategy.long, needlong == false ? 0 : trend == -1 and needct == false ? 0 : na)

if dn7 == 1 or dn8 == 1
    strategy.entry("Short", strategy.short, needshort == false ? 0 : trend == 1 and needct == false ? 0 : na)
Detail
https://www.fmz.com/strategy/430007
Last Modified
2023-10-24 10:56:08