
7.8 KiB
Name
双指数移动平均线趋势跟踪与分步退出交易策略-Dual-EMA-Trend-Following-Strategy-with-Staged-Position-Exit
Author
ianzeng123
Strategy Description
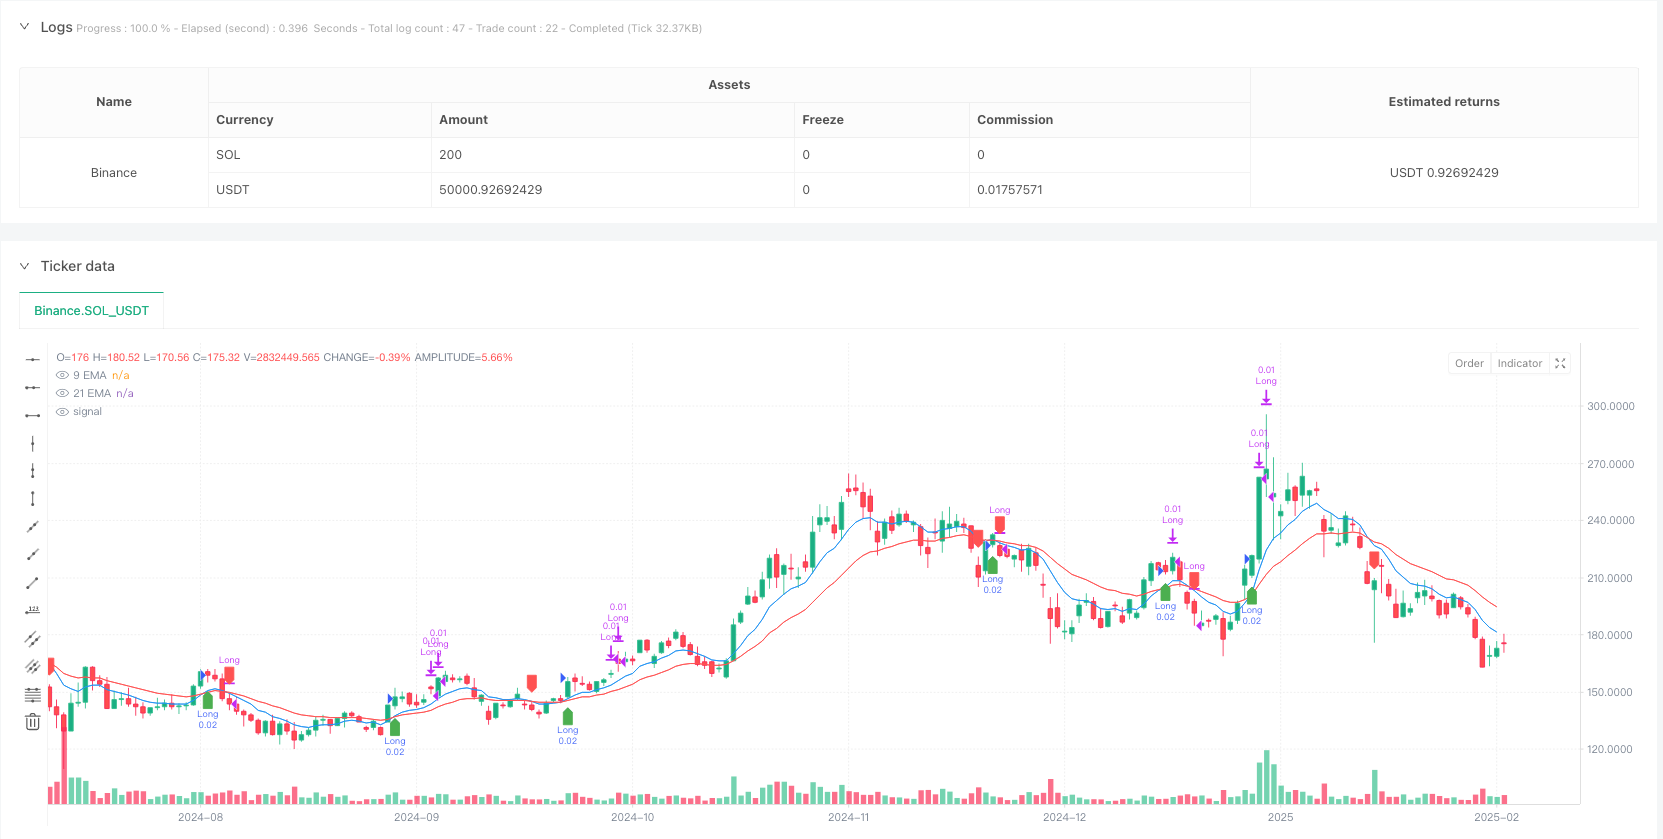
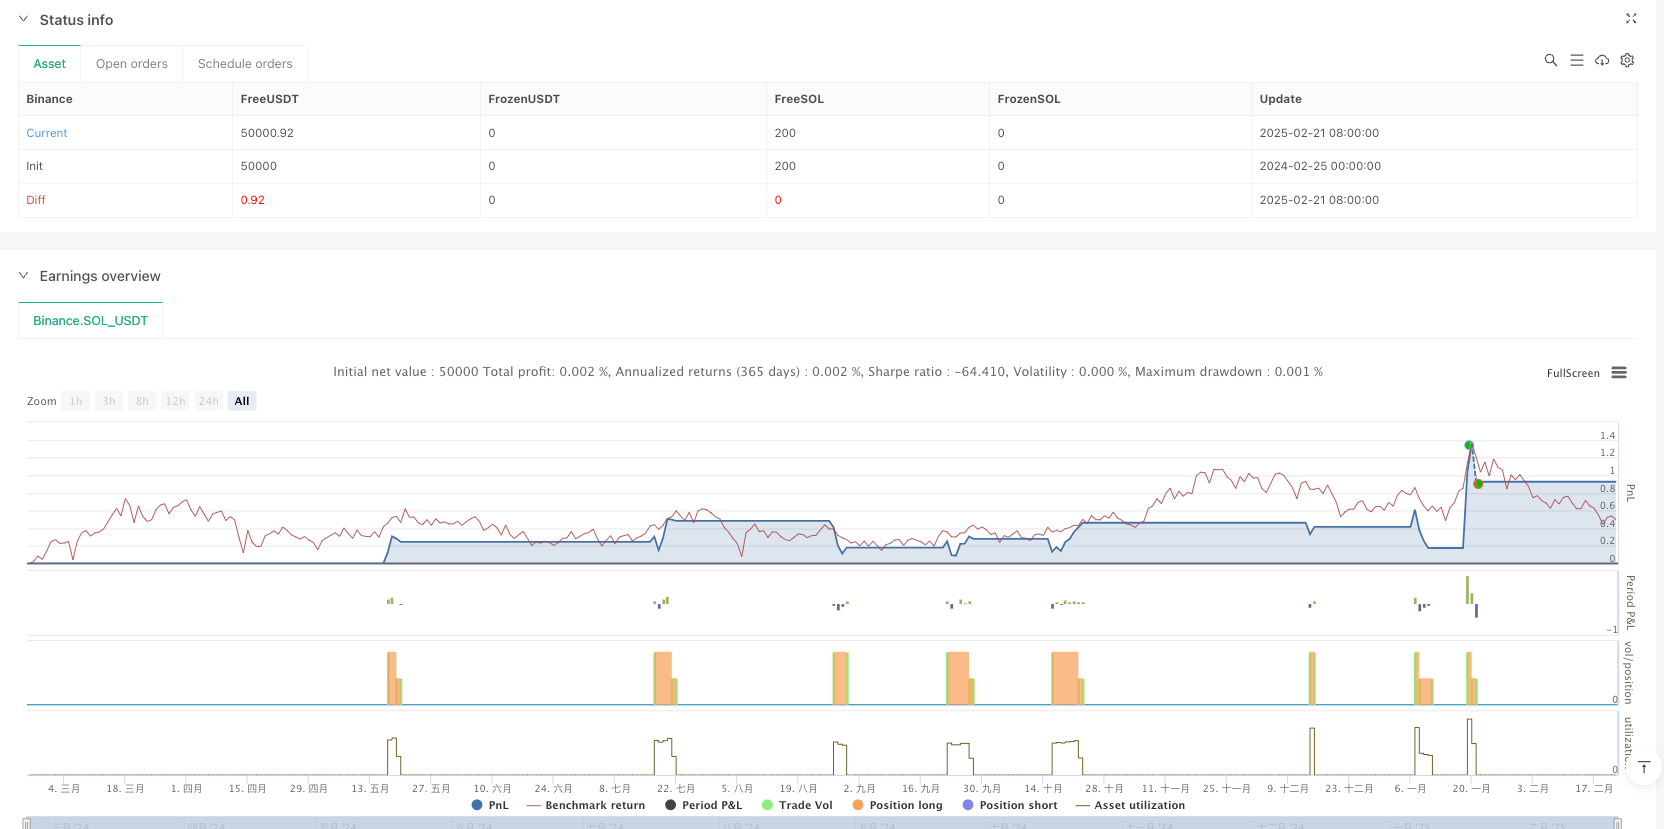
[trans]
概述
该策略是一个基于双指数移动平均线(EMA)交叉的趋势跟踪系统,结合了分步退出机制来优化交易收益。策略使用9周期和21周期的EMA作为快线和慢线,通过它们的交叉来识别市场趋势的变化,同时采用两阶段的仓位退出方案来平衡风险和收益。
策略原理
策略的核心逻辑基于快速EMA(9周期)和慢速EMA(21周期)的交叉信号。当快线上穿慢线时,系统以0.02手开立多头仓位;当快线下穿慢线时,系统以0.02手开立空头仓位。在持仓期间,策略采用两阶段退出机制:第一阶段是在盈利达到200点时平掉一半仓位(0.01手);第二阶段是在出现反向交叉信号时平掉剩余仓位。这种分步退出的设计旨在在保留上涨空间的同时锁定部分利润。
策略优势
- 趋势捕捉能力强:通过使用两个不同周期的EMA,策略能够有效识别市场趋势的转折点。
- 风险管理完善:分步退出机制既能锁定部分利润,又不会完全错过趋势的延续。
- 参数设置合理:9和21周期的EMA组合在市场中被广泛验证,具有较好的可靠性。
- 执行逻辑清晰:策略的进场和出场规则明确,便于实盘操作和回测验证。
策略风险
- 震荡市场风险:在横盘震荡市场中,频繁的交叉信号可能导致连续的假突破亏损。
- 滑点影响:在快速波动的市场中,分步退出的执行可能受到滑点影响。
- 趋势反转风险:如果市场趋势突然反转,策略可能在高点平掉一半仓位后,剩余仓位承受较大回撤。
策略优化方向
- 引入趋势过滤器:可以添加长周期均线或趋势指标来过滤假信号。
- 动态止损设置:根据市场波动率动态调整止损位置,提高风险控制的灵活性。
- 优化分步退出比例:可以根据不同市场环境调整首次退出的仓位比例和盈利目标。
- 增加时间过滤:添加交易时间窗口限制,避免在市场低流动性时段交易。
总结
这是一个将经典的均线交叉策略与现代化仓位管理相结合的完整交易系统。策略通过分步退出机制提升了传统均线交叉策略的盈利能力,但仍需要交易者根据具体市场环境和自身风险承受能力进行适当调整。未来的优化方向主要集中在信号过滤和动态风险管理两个方面。 ||
Overview
This strategy is a trend following system based on dual Exponential Moving Average (EMA) crossovers, combined with a staged position exit mechanism to optimize trading returns. The strategy utilizes 9-period and 21-period EMAs as fast and slow lines, identifying market trend changes through their crossovers while implementing a two-stage position exit plan to balance risk and reward.
Strategy Principles
The core logic is based on crossover signals between the fast EMA (9-period) and slow EMA (21-period). When the fast line crosses above the slow line, the system opens a long position with 0.02 lots; when the fast line crosses below the slow line, it opens a short position with 0.02 lots. During position holding, the strategy employs a two-stage exit mechanism: the first stage closes half the position (0.01 lots) when profit reaches 200 points; the second stage closes the remaining position when a reverse crossover signal appears. This staged exit design aims to lock in partial profits while maintaining exposure to trend continuation.
Strategy Advantages
- Strong trend capture capability: Using two EMAs with different periods effectively identifies market trend turning points.
- Comprehensive risk management: The staged exit mechanism locks in partial profits while maintaining exposure to trend continuation.
- Well-validated parameters: The 9 and 21-period EMA combination has been widely tested in markets and proves reliable.
- Clear execution logic: The entry and exit rules are explicit, facilitating live trading and backtesting.
Strategy Risks
- Choppy market risk: In ranging markets, frequent crossover signals may lead to consecutive false breakout losses.
- Slippage impact: In rapidly moving markets, staged exit execution may be affected by slippage.
- Trend reversal risk: If market trends suddenly reverse, the strategy might close half the position at peaks, leaving remaining positions exposed to significant drawdowns.
Strategy Optimization Directions
- Introduce trend filters: Add longer-period moving averages or trend indicators to filter false signals.
- Dynamic stop-loss settings: Adjust stop-loss positions based on market volatility for more flexible risk control.
- Optimize staged exit ratios: Adjust first exit position size and profit targets based on different market conditions.
- Add time filters: Implement trading time windows to avoid low liquidity periods.
Summary
This is a complete trading system that combines classic moving average crossover strategy with modern position management. The strategy enhances the profitability of traditional moving average crossover strategies through staged exit mechanisms, but traders still need to make appropriate adjustments based on specific market conditions and their risk tolerance. Future optimization directions mainly focus on signal filtering and dynamic risk management.[/trans]
Source (PineScript)
/*backtest
start: 2024-02-25 00:00:00
end: 2025-02-22 08:00:00
period: 1d
basePeriod: 1d
exchanges: [{"eid":"Binance","currency":"SOL_USDT"}]
*/

//@version=5
strategy("EMA Crossover with Partial Exit", overlay=true, default_qty_type=strategy.cash, default_qty_value=50)

// Define lot sizes
lotSize = 0.02   // Initial trade size
partialLot = 0.01 // Half quantity to close at 20 pips profit
profitTarget = 200 // 20 pips = 200 points (for Forex, adjust accordingly)

// Define EMA lengths
fastLength = 9
slowLength = 21

// Compute EMAs
fastEMA = ta.ema(close, fastLength)
slowEMA = ta.ema(close, slowLength)

// Define crossover conditions
longEntry = ta.crossover(fastEMA, slowEMA)   // Buy when 9 EMA crosses above 21 EMA
shortEntry = ta.crossunder(fastEMA, slowEMA) // Sell when 9 EMA crosses below 21 EMA

// Track trade state
var float entryPrice = na
var bool inTrade = false
var bool isLong = false

// Entry Logic (Enter with 0.02 lot size)
if (longEntry and not inTrade)
    strategy.entry("Long", strategy.long, qty=lotSize)
    entryPrice := close
    inTrade := true
    isLong := true

if (shortEntry and not inTrade)
    strategy.entry("Short", strategy.short, qty=lotSize)
    entryPrice := close
    inTrade := true
    isLong := false

// Partial Exit Logic (Close 0.01 lot after 20 pips profit)
if (isLong and inTrade and close >= entryPrice + profitTarget * syminfo.mintick)
    strategy.close("Long", qty=partialLot)

if (not isLong and inTrade and close <= entryPrice - profitTarget * syminfo.mintick)
    strategy.close("Short", qty=partialLot)

// Full Exit (Close remaining 0.01 lot at the next major crossover)
if (isLong and shortEntry)
    strategy.close("Long") // Close remaining position
    inTrade := false

if (not isLong and longEntry)
    strategy.close("Short") // Close remaining position
    inTrade := false

// Plot EMAs
plot(fastEMA, color=color.blue, title="9 EMA")
plot(slowEMA, color=color.red, title="21 EMA")

// Mark Buy/Sell Signals
plotshape(series=longEntry, location=location.belowbar, color=color.green, style=shape.labelup, title="BUY Signal")
plotshape(series=shortEntry, location=location.abovebar, color=color.red, style=shape.labeldown, title="SELL Signal")
Detail
https://www.fmz.com/strategy/483526
Last Modified
2025-02-24 10:23:24