
10 KiB
Name
压力平衡高概率突破交易策略High-Probability-Breakthrough-Trading-Strategy-Based-on-Pressure-Balance
Author
ChaoZhang
Strategy Description
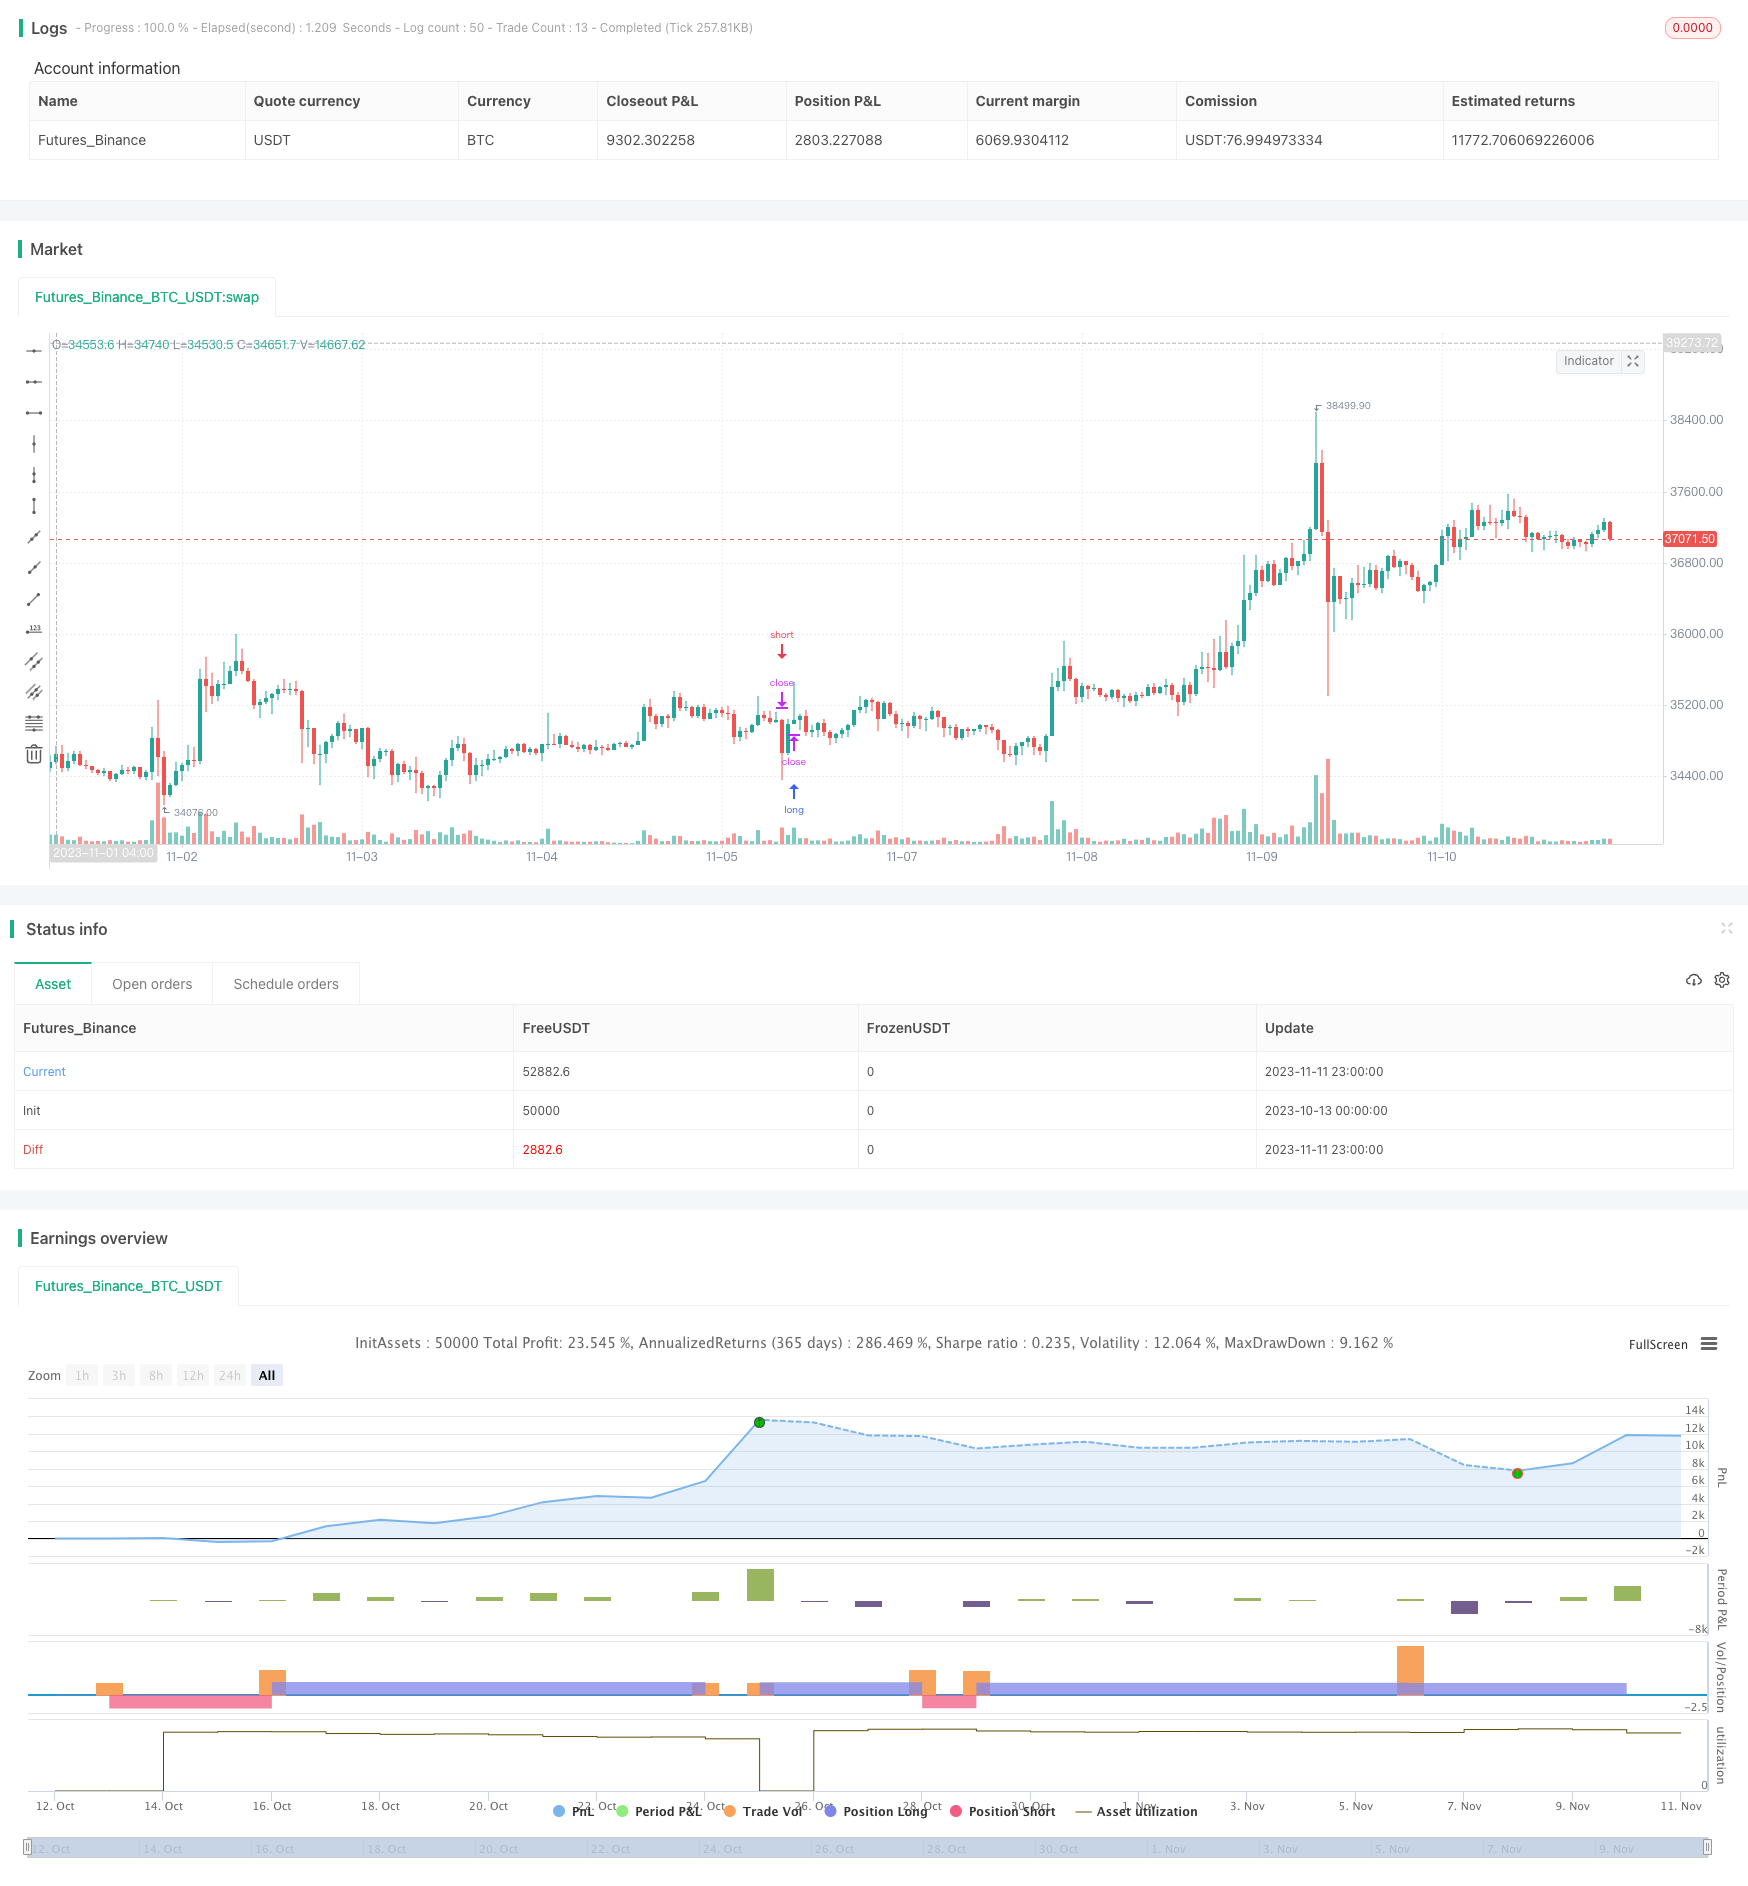 [trans]
概述
这个策略利用多种指标组合判断趋势方向和交易时机,采用压力平衡的方法提高交易胜率。主要使用MACD,PSAR和EMA三个指标进行判断,结合止损止盈实现高效盈利。
策略原理
-
使用EMA计算均线,判断整体趋势方向。EMA值较大代表目前处于上升趋势,EMA值较小代表目前处于下降趋势。
-
使用MACD计算快线和慢线的差值,当差值大于0代表目前处于上升趋势,当差值小于0代表目前处于下降趋势。
-
使用PSAR计算连续变动点,当PSAR值较大代表目前处于下降趋势,当PSAR值较小代表目前处于上升趋势。
-
结合上述三个指标,判断趋势一致性。当三个指标判断结果一致时,代表趋势较为明确,可以进行买入或卖出操作。
-
根据买入和卖出条件开仓,并设置止损止盈点,在达到止损或止盈条件时平仓,实现盈利。
-
具体操作规则如下:
- 买入条件:非上升趋势,MACD差值小于0,收盘价高于EMA均线
- 卖出条件:上升趋势,MACD差值大于0,收盘价低于EMA均线
- 止损条件:价格触及下一个PSAR值
- 止盈条件:达到设定的止盈比例
策略优势
-
使用多种指标判断趋势,提高判断准确性。
-
采用压力平衡方式,在趋势明确时开仓,增加获利概率。
-
设定止损止盈点,可以限制亏损,锁定盈利。
-
交易规则清晰系统,适合程序化交易。
-
可以通过参数优化,调整适应不同品种和交易周期。
策略风险
-
趋势判断存在错误的可能,导致开仓方向错误。
-
市场出现剧烈变动,指标发出虚假信号的可能。
-
止损点设置过大,无法及时止损。
-
参数设置不当,导致过于频繁交易或无法及时开仓。
-
交易品种流动性不足,无法按计划止损止盈。
-
可以通过优化参数,调整止损止盈点,选择流动性好的交易品种来降低风险。
策略优化方向
-
调整EMA周期参数,优化判断趋势的准确性。
-
调整MACD快线慢线周期参数,优化MACD指标的敏感性。
-
调整止损止盈比例参数,取得止损止盈的最佳平衡。
-
添加其他辅助指标,提高开仓时机选择的准确性。
-
优化交易品种选择,选择流动性好、波动较大的品种。
-
调整交易时间周期,适应不同品种的行情特点。
总结
这个策略综合运用多种指标判断趋势,在趋势明确时开仓,并设置止损止盈,可以有效把握市场走势,在保证一定盈利的前提下获取比较理想的回报。通过参数优化和加入其他辅助指标,可以进一步提高策略的稳定性和盈利水平。该策略交易规则清晰易懂,非常适合程序化交易。
||
Overview
This strategy uses a combination of multiple indicators to determine the trend direction and trading opportunities, adopting a pressure balance approach to increase the winning rate of trades. It mainly utilizes MACD, PSAR and EMA indicators for judgement, and implements stop loss and take profit to achieve effective profitability.
Strategy Logic
-
Use EMA to calculate moving average to determine the overall trend direction. Larger EMA value indicates an uptrend, while smaller EMA value indicates a downtrend.
-
Use MACD to calculate the difference between fast and slow moving averages. When the difference is greater than 0, it indicates an uptrend, when less than 0, it indicates a downtrend.
-
Use PSAR to calculate the continuous varying point. When PSAR value is large, it indicates a downtrend, when PSAR value is small, it indicates an uptrend.
-
Combine the above three indicators to determine consistency of the trend. When the judgments of the three indicators are consistent, it represents a clear trend that allows entry trades.
-
Enter trades based on buy and sell criteria, and set stop loss and take profit points. Exit trades when stop loss or take profit conditions are met to realize profits.
-
Specific rules are:
- Buy condition: not in uptrend, MACD histogram < 0, close price > EMA
- Sell condition: in uptrend, MACD histogram > 0, close price < EMA
- Stop loss condition: price hits next PSAR value
- Take profit condition: reaching preset take profit ratio
Advantages of the Strategy
-
Using multiple indicators to determine the trend improves accuracy.
-
Opening trades based on definite trends identified through pressure balance increases winning rate.
-
Setting stop loss and take profit can limit losses and lock in profits.
-
Clear and systematic trading rules make it suitable for algorithm trading.
-
Parameters can be optimized to adapt to different products and timeframes.
Risks of the Strategy
-
Trend judgement may be wrong, resulting in incorrect trade direction.
-
Extreme market moves may generate false signals from the indicators.
-
Stop loss being set too wide, unable to exit timely.
-
Improper parameter tuning leads to over-trading or missing trades.
-
Illiquid products cannot fulfill stop loss and take profit plans.
-
Risks can be reduced by optimizing parameters, adjusting stops, and selecting liquid products.
Optimization Directions
-
Adjust EMA period to optimize trend accuracy.
-
Tune MACD fast and slow period to improve sensitivity.
-
Optimize stop loss and take profit ratios to find ideal balance.
-
Add other auxiliary indicators to improve entry timing.
-
Select products with good liquidity and large swings.
-
Adjust timeframes to suit different product characteristics.
Summary
This strategy integrates multiple indicators for trend analysis and enters trades based on definite trends, with preset stop loss and take profit, which can effectively capture market moves and achieve good returns while ensuring certain profitability. Further improvements on stability and profitability can be achieved through parameter tuning and additional indicators. The clear trading rules make this strategy very suitable for algorithmic trading.
[/trans]
Strategy Arguments
| Argument | Default | Description |
|---|---|---|
| v_input_1 | 60 | Length EMA |
| v_input_2_close | 0 | Source: close |
| v_input_3 | 12 | Fast Length MACD |
| v_input_4 | 26 | Slow Length MACD |
| v_input_5 | 9 | Signal Smoothing |
| v_input_6 | 0 | Oscillator MA Type MACD: EMA |
| v_input_7 | 0 | Signal Line MA Type MACD: EMA |
| v_input_8 | 0.02 | start |
| v_input_9 | 0.02 | increment |
| v_input_10 | 0.2 | maximum |
| v_input_11 | 0.245 | tplong |
| v_input_12 | true | sllong |
| v_input_13 | 0.055 | tpshort |
| v_input_14 | 0.03 | slshort |
Source (PineScript)
/*backtest
start: 2023-10-13 00:00:00
end: 2023-11-12 00:00:00
period: 1h
basePeriod: 15m
exchanges: [{"eid":"Futures_Binance","currency":"BTC_USDT"}]
*/

// This source code is subject to the terms of the Mozilla Public License 2.0 at https://mozilla.org/MPL/2.0/
// © exlux99

//@version=4
strategy(title = "Crypto Scalper", overlay = true,  pyramiding=1,initial_capital = 100, default_qty_type= strategy.percent_of_equity, default_qty_value = 100, calc_on_order_fills=false, slippage=0,commission_type=strategy.commission.percent,commission_value=0.03)
len = input(60, minval=1, title="Length EMA")
src = input(close, title="Source")
out = ema(src, len)
//
fast_length = input(title="Fast Length MACD", type=input.integer, defval=12)
slow_length = input(title="Slow Length MACD", type=input.integer, defval=26)
signal_length = input(title="Signal Smoothing", type=input.integer, minval = 1, maxval = 50, defval = 9)
sma_source = input(title="Oscillator MA Type MACD", type=input.string, defval="EMA", options=["SMA", "EMA"])
sma_signal = input(title="Signal Line MA Type MACD", type=input.string, defval="EMA", options=["SMA", "EMA"])

// Calculating
fast_ma = sma_source == "SMA" ? sma(src, fast_length) : ema(src, fast_length)
slow_ma = sma_source == "SMA" ? sma(src, slow_length) : ema(src, slow_length)
macd = fast_ma - slow_ma
signal = sma_signal == "SMA" ? sma(macd, signal_length) : ema(macd, signal_length)
hist = macd - signal


start = input(0.02)
increment = input(0.02)
maximum = input(0.2)
var bool uptrend = na
var float EP = na
var float SAR = na
var float AF = start
var float nextBarSAR = na
if bar_index > 0
	firstTrendBar = false
	SAR := nextBarSAR
	if bar_index == 1
		float prevSAR = na
		float prevEP = na
		lowPrev = low[1]
		highPrev = high[1]
		closeCur = close
		closePrev = close[1]
		if closeCur > closePrev
			uptrend := true
			EP := high
			prevSAR := lowPrev
			prevEP := high
		else
			uptrend := false
			EP := low
			prevSAR := highPrev
			prevEP := low
		firstTrendBar := true
		SAR := prevSAR + start * (prevEP - prevSAR)
	if uptrend
		if SAR > low
			firstTrendBar := true
			uptrend := false
			SAR := max(EP, high)
			EP := low
			AF := start
	else
		if SAR < high
			firstTrendBar := true
			uptrend := true
			SAR := min(EP, low)
			EP := high
			AF := start
	if not firstTrendBar
		if uptrend
			if high > EP
				EP := high
				AF := min(AF + increment, maximum)
		else
			if low < EP
				EP := low
				AF := min(AF + increment, maximum)
	if uptrend
		SAR := min(SAR, low[1])
		if bar_index > 1
			SAR := min(SAR, low[2])
	else
		SAR := max(SAR, high[1])
		if bar_index > 1
			SAR := max(SAR, high[2])
	nextBarSAR := SAR + AF * (EP - SAR)

tplong=input(0.245, step=0.005)
sllong=input(1.0, step=0.005)
tpshort=input(0.055, step=0.005)
slshort=input(0.03, step=0.005)

if (uptrend and hist >0 and close < out)
	strategy.entry("short", strategy.short, stop=nextBarSAR, comment="short")
	strategy.exit("short_tp/sl", "short", profit=close * tpshort / syminfo.mintick, loss=close * slshort / syminfo.mintick, comment='SHORT EXIT',  alert_message = 'closeshort')
if (not uptrend and hist <0 and close > out)
	strategy.entry("long", strategy.long, stop=nextBarSAR, comment="long")
	strategy.exit("short_tp/sl", "long", profit=close * tplong / syminfo.mintick, loss=close * sllong / syminfo.mintick, comment='LONG EXIT',  alert_message = 'closelong')
Detail
https://www.fmz.com/strategy/431925
Last Modified
2023-11-13 11:40:53