
6.8 KiB
Name
动量指数型金叉交易策略Momentum-Exponential-Moving-Average-Crossover-Trading-Strategy
Author
ChaoZhang
Strategy Description
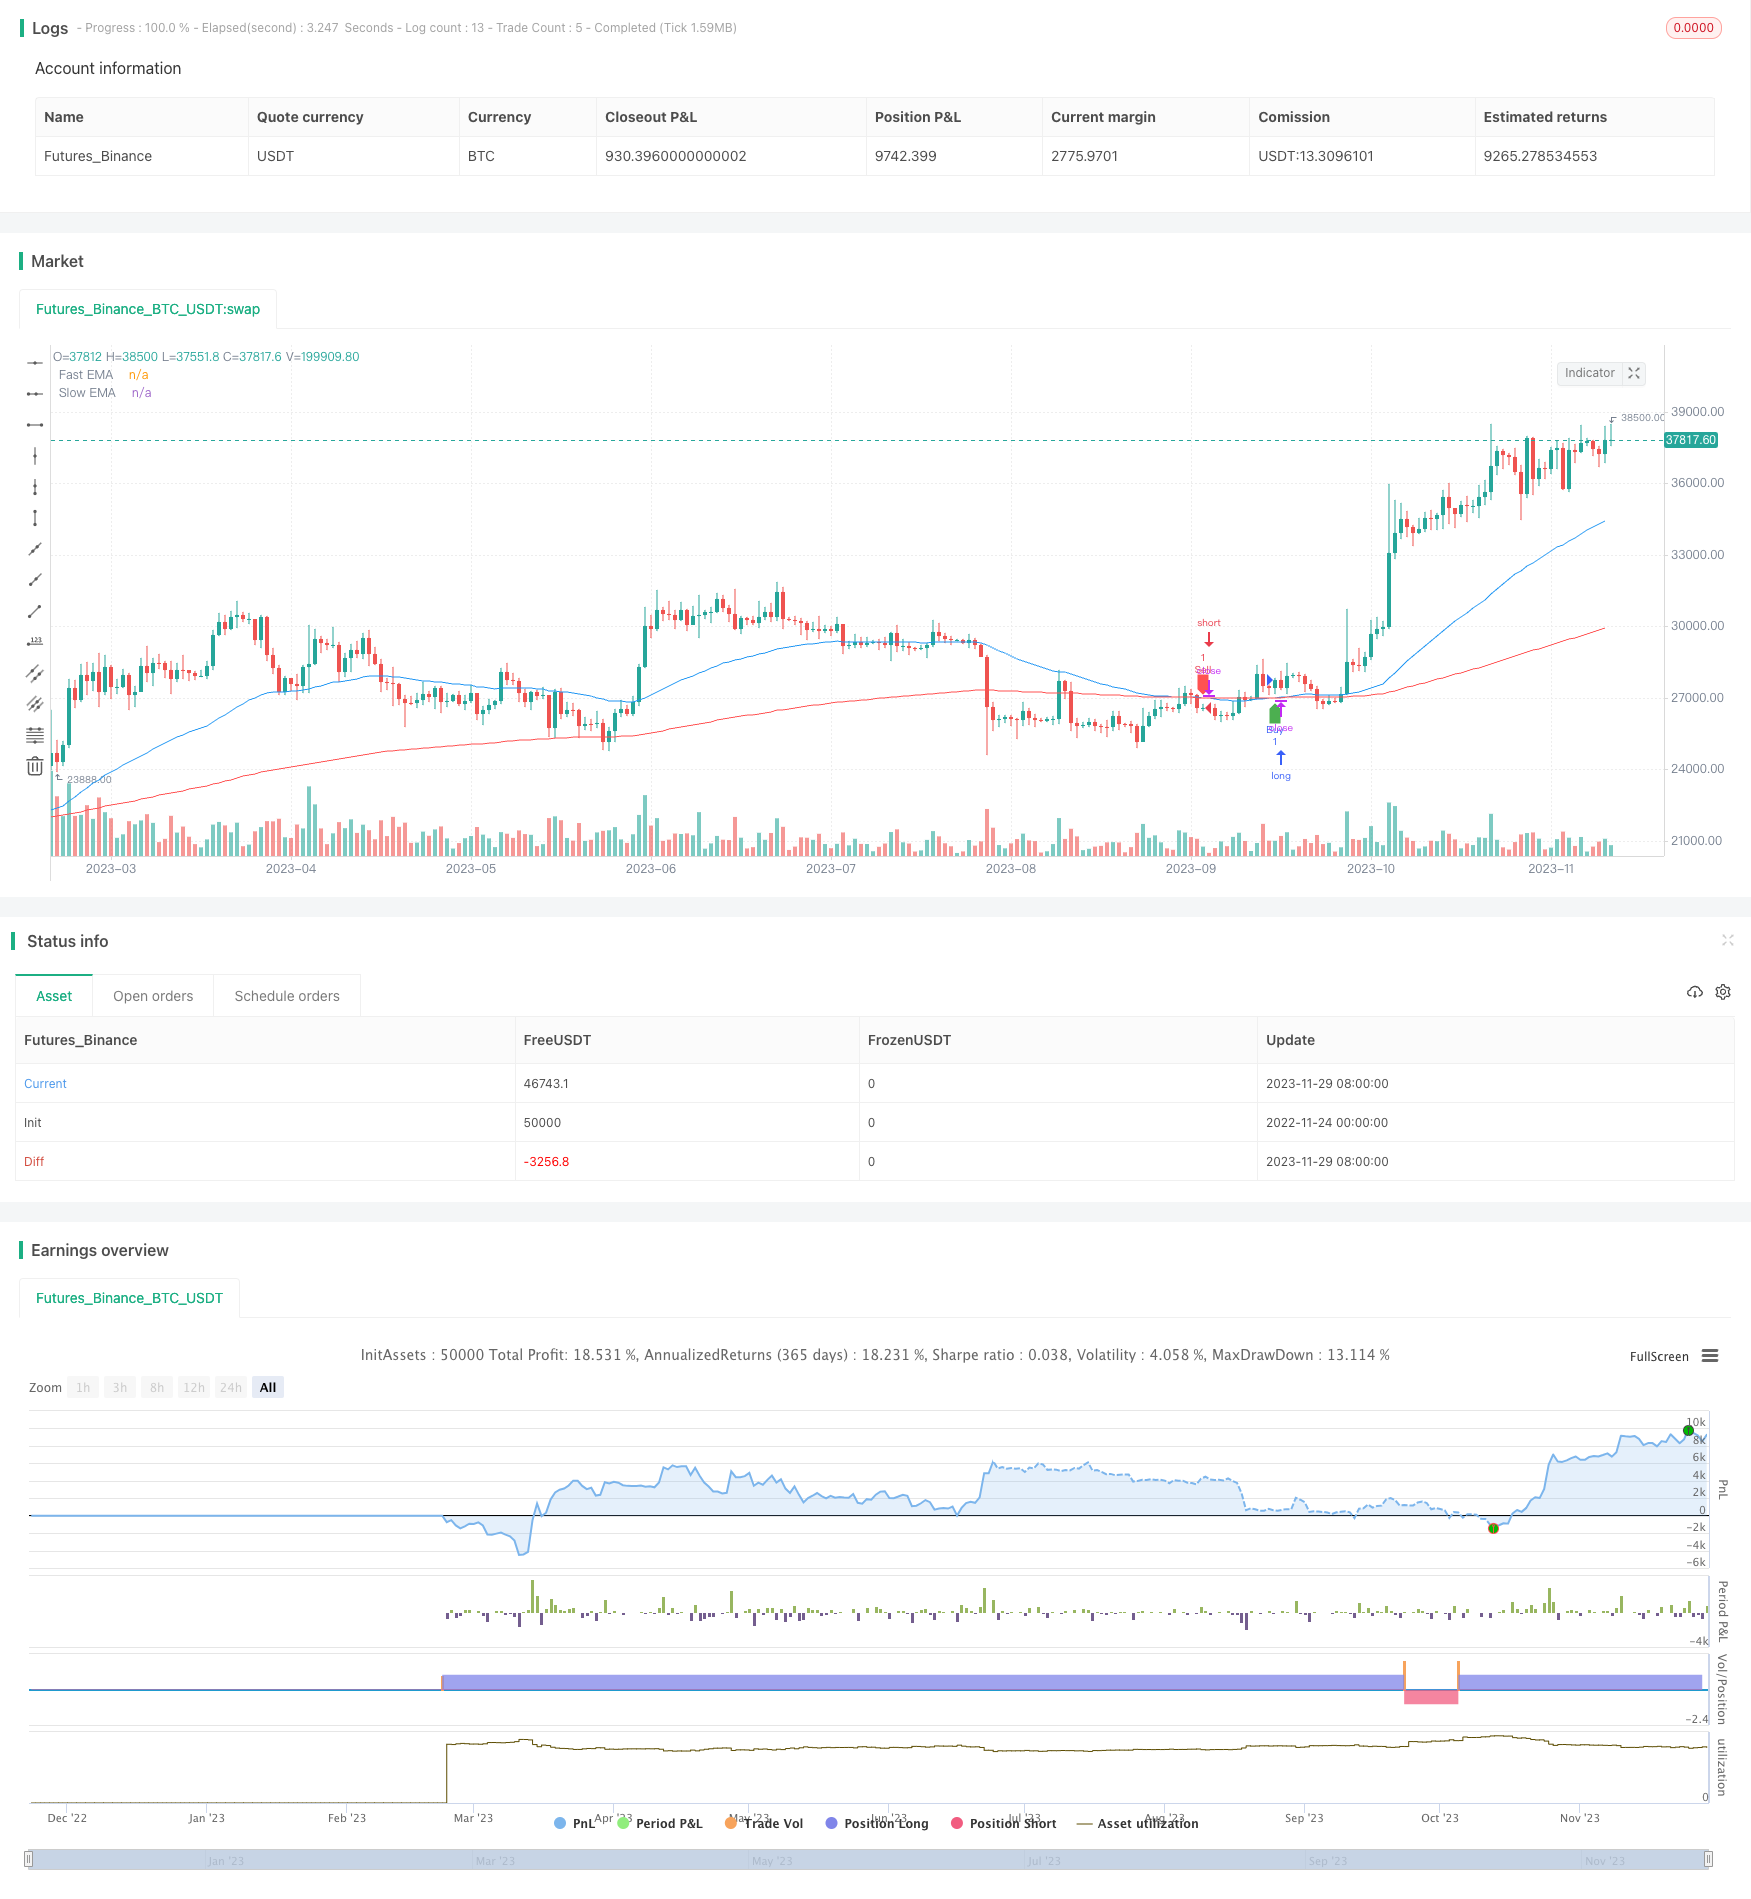 [trans]
概述
本策略基于两个指数移动平均线(EMA)的金叉与死叉来产生交易信号。具体而言,该策略计算50周期EMA和200周期EMA,当短期EMA(50周期)上穿长期EMA(200周期)时,产生买入信号;当短期EMA下穿长期EMA时,产生卖出信号。这可以有效捕捉股票价格的短期和长期趋势变化,形成动量型的交易策略。
策略原理
-
计算两条指数移动平均线:50周期EMA和200周期EMA。EMA赋予最近数据更大权重,对短期价格变动更敏感。
-
确定交易信号:
- 买入信号:短期EMA上穿长期EMA,表示短期趋势转为上升。
- 卖出信号:短期EMA下穿长期EMA,表示短期趋势转为下降。
-
根据信号执行交易:买入信号时做多,卖出信号时做空。
-
在图表上绘制EMA和交易信号,便于形成直观判断。
优势分析
该策略具有以下优势:
-
捕捉大趋势的反转,特别适合趋势和盘整市。效果较好。
-
决策规则简单清晰,容易实现与回测。
-
EMA平滑价格数据,有利于识别趋势信号,滤除噪音。
-
可调整EMA周期,适应不同持仓周期。
-
结合其他指标可进一步过滤信号,优化策略。
风险分析
该策略也存在一些风险:
-
在震荡市中可能产生较多错误信号和过多无效交易。
-
只依赖单一指标规则,Robust性较差。
-
未考虑止损规则,存在亏损扩大的风险。
-
EMA延迟性可能错过价格变化的最佳参与点位。
-
需回测确定最佳参数,实盘表现可能与回测结果有差异。
对应风险控制与优化措施包括:结合其他指标过滤信号、设置止损机制、引入机器学习模型等。
优化方向
该策略可从以下几个方面进行优化:
-
结合其他指标(如MACD、KD等)实现多因子模型,提高策略的Robust性。
-
加入止损机制。如设定固定百分比止损或随动止损。控制单次交易最大损失。
-
使用机器学习方法获得最优参数。改进信号判断规则。提高策略的稳健性。
-
根据回测结果设定最优的EMA周期组合。根据市场环境调整参数。
-
评估交易成本影响。加入滑点模型与手续费考量。优化仓位管理。
总结
本策略整体而言是一种较为经典简单的突破型交易策略。基于EMA指标的金叉死叉形成决策规则。虽具有一定的时效性,但也存在一些缺陷与可优化空间。如何改进信号判断、控制风险、动态调参等,是后续需要重点考虑的方面,这将大大增强该策略在实盘中的稳定盈利能力。 ||
Overview
This strategy generates trading signals based on the crossover and crossunder between two Exponential Moving Averages (EMAs), specifically the 50-period EMA and 200-period EMA. It aims to capture changes in short-term and long-term price trends to form a momentum-based trading strategy.
Strategy Logic
-
Calculate two EMAs: 50-period EMA and 200-period EMA. EMAs give more weight to recent data and are more responsive to short-term price moves.
-
Determine trading signals:
- Buy signal: 50-period EMA crosses above 200-period EMA, indicating the short-term trend is turning upwards.
- Sell signal: 50-period EMA crosses below 200-period EMA, indicating the short-term trend is turning downwards.
-
Execute trades based on signals: Go long on buy signals, go short on sell signals.
-
Plot EMAs and trading signals on chart for intuitive visualization.
Advantages
The strategy has the following key advantages:
-
Captures major trend reversals, works well for trending and ranging markets.
-
Simple and clear decision rules, easy to implement and backtest.
-
EMAs smooth price data, help identify signals and filter out noise.
-
Customizable EMA periods suit different holding horizons.
-
Can combine other indicators to further filter signals and optimize.
Risks Analysis
There are also some risks to consider:
-
More false signals and excessive trades possible in choppy markets.
-
Relies solely on single indicator rules, robustness could improve.
-
No stop loss in place, risks uncontrolled losing trades.
-
EMA lag may miss best entry and exit points.
-
Requires backtesting to find optimal parameters, live results may differ.
Corresponding risk control and optimizations include using other indicators as filters, implementing stop losses, introducing machine learning models etc.
Optimization Opportunities
Some ways the strategy can be further optimized:
-
Add other indicators (e.g. MACD, RSI) for a multi-factor model. Improves robustness.
-
Incorporate stop losses. E.g. fixed percentage, trailing stop loss. Limits maximum loss per trade.
-
Utilize machine learning for optimal parameters and enhance signal generation rules.
-
Backtest to find best performing EMA combinations for market regime. Dynamically adjust periods.
-
Evaluate transaction costs. Add slippage, commission to fine tune position sizing.
Conclusion
This is an overall simple, classic breakout strategy based on EMA crossovers. Has merits but also some inherent flaws and room for improvement. Enhancing signal reliability, risk control, dynamic adjustment etc. will greatly improve its profitability in live trading.
[/trans]
Strategy Arguments
| Argument | Default | Description |
|---|---|---|
| v_input_1 | 50 | Fast EMA Length |
| v_input_2 | 200 | Slow EMA Length |
Source (PineScript)
/*backtest
start: 2022-11-24 00:00:00
end: 2023-11-30 00:00:00
period: 1d
basePeriod: 1h
exchanges: [{"eid":"Futures_Binance","currency":"BTC_USDT"}]
*/

//@version=5
strategy("EMA Golden Crossover Strategy", overlay=true)

// Input parameters
fastLength = input(50, title="Fast EMA Length")
slowLength = input(200, title="Slow EMA Length")

// Calculate EMAs using ta.ema
fastEMA = ta.ema(close, fastLength)
slowEMA = ta.ema(close, slowLength)

// Plot EMAs on the chart
plot(fastEMA, color=color.blue, title="Fast EMA")
plot(slowEMA, color=color.red, title="Slow EMA")

// Strategy logic
longCondition = ta.crossover(fastEMA, slowEMA)
shortCondition = ta.crossunder(fastEMA, slowEMA)

// Execute orders
if (longCondition)
    strategy.entry("Buy", strategy.long)

if (shortCondition)
    strategy.entry("Sell", strategy.short)

// Plot buy and sell signals on the chart
plotshape(series=longCondition, title="Buy Signal", color=color.green, style=shape.labelup, location=location.belowbar)
plotshape(series=shortCondition, title="Sell Signal", color=color.red, style=shape.labeldown, location=location.abovebar)
Detail
https://www.fmz.com/strategy/433970
Last Modified
2023-12-01 18:21:07