
13 KiB
Name
动能区ATR反转订单量化策略Action-Zone-ATR-Reverse-Order-Quant-Strategy
Author
ChaoZhang
Strategy Description
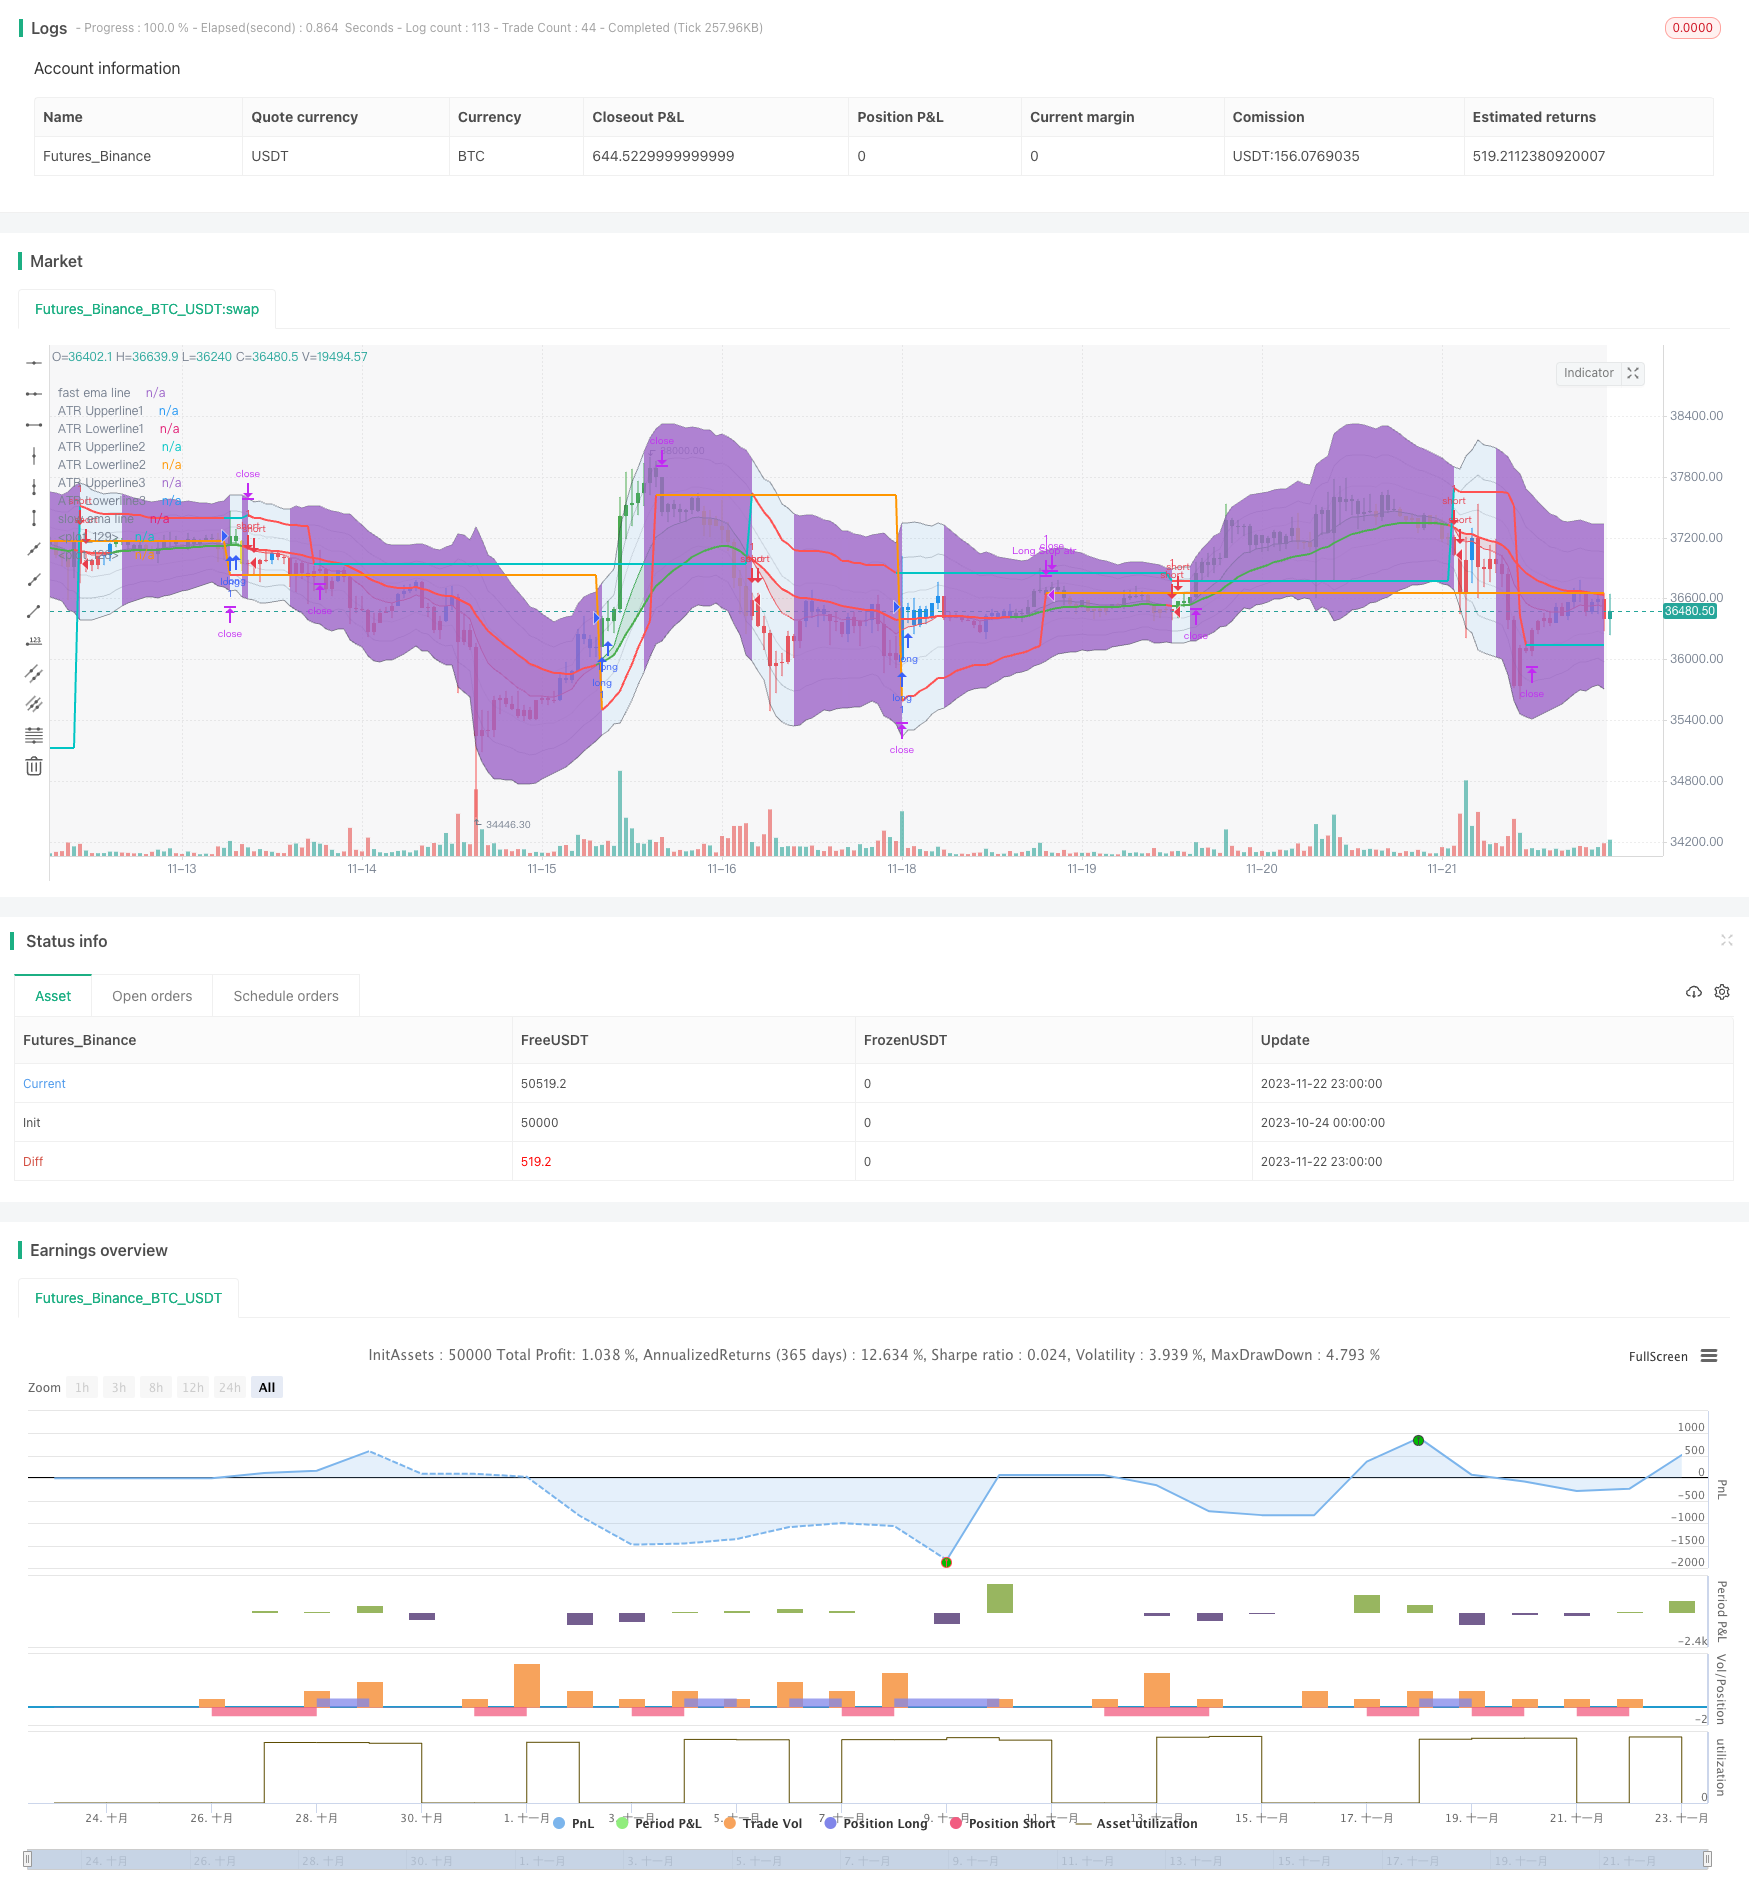 [trans]
概述
本策略主要思想是结合动能区和ATR指标,在出现金叉时做多,出现死叉时做空。同时设置止损和止盈价格。当价格出现反转信号时,会反向开仓,实现反转订单的功能。
原理
- 使用快速EMA和慢速EMA计算多空信号。快速EMA高于慢速EMA为看涨,反之为看跌。
- 在无仓位时,出现金叉就做多,出现死叉就做空。
- 已开仓时,若出现反转信号,会先平掉当前仓位,再按相反方向开新仓。
- 使用ATR指标计算止损和止盈价格。止损价格会根据ATR通道进行调整,确保止损风险小。
- 当价格进入超买超卖区域时,会调整止损价格为最后一根K线的最高价或最低价,避免被套。
优势
- 结合动能区和ATR,能够在趋势中顺势开仓,又能定时止损止盈。
- 实现反转订单功能,能够在价格反转时快速切换方向,充分利用价格双向波动获得更高收益。
- ATR止损机制能够有效控制单笔止损风险,整体实现高胜率。
- 结合超买超卖判定,避免被突发事件套住。
风险及解决
- 反转订单在震荡行情中可能过于频繁交易,增加交易成本和止损几率。
- 解决:增加最小持仓周期,在震荡行情中减少反转。
- ATR值变化可能令止损范围过大或过小。
- 解决:根据ATR值实时调整止损距离。
- 参数设置不当可能导致交易频率过高或信号效果不佳。
- 解决:根据不同品种合理选择参数组合。
优化方向
- 优化参数设置,寻找最佳参数组合。
- 增加辅助技术指标过滤,提高信号质量。
- 增加资金管理模块,使仓位与账户总资产挂钩。
- 增加跨时间周期分析,利用更多信息提升策略效果。
总结
本策略整合动能区和ATR指标的优势,实现高效双向交易。反转订单机制及ATR智能止损,能够充分利用价格波动。优化参数设置和结合更多指标可进一步提高策略效果。本策略适合高频双向交易,也可作为辅助决策工具。
||
Overview
The main idea of this strategy is to combine the Action Zone and ATR indicator to go long when there is a golden cross and go short when there is a dead cross. It also sets stop loss and take profit prices. When a price reversal signal occurs, it will open reverse positions to achieve reverse order functionality.
Principles
- Use fast EMA and slow EMA to calculate long and short signals. Fast EMA above slow EMA is bullish, otherwise bearish.
- When there is no position, go long on golden cross and go short on dead cross.
- When already having a position, if a reversal signal occurs, it will first close the current position, then open a new position in the opposite direction.
- Use ATR indicator to calculate stop loss and take profit prices. The stop loss price will be adjusted based on the ATR channel to ensure small stop loss risk.
- When the price enters the overbought or oversold zone, the stop loss price will be adjusted to the highest or lowest price of the last bar to avoid being trapped.
Advantages
- Combining Action Zone and ATR can open positions along the trend during trends and set stop loss and take profit timely.
- Implementing reverse order functionality can quickly switch directions when prices reverse, making full use of two-way price fluctuations for higher returns.
- The ATR stop loss mechanism can effectively control the risk of single stop loss and achieve high win rate overall.
- Combined with overbought and oversold judgments to avoid being trapped by sudden events.
Risks and Solutions
- Reverse orders may cause excessive frequency of transactions in range-bound markets, increasing trading costs and stop loss probabilities.
- Solution: Increase minimum holding period to reduce reversals in range bound markets.
- Changes in ATR values may cause the stop loss range to be too large or too small.
- Solution: Adjust the stop loss distance according to the real-time ATR values.
- Improper parameter settings may lead to excessively high trading frequency or poor signal effects.
- Solution: Reasonably select parameter combinations according to different varieties.
Optimization Directions
- Optimize parameter settings to find the best parameter combination.
- Add auxiliary technical indicators to filter to improve signal quality.
- Add capital management modules to link position size with total account assets.
- Add cross-timeframe analysis to improve strategy performance with more information.
Summary
This strategy integrates the advantages of Action Zone and ATR indicators to achieve efficient two-way trading. The reverse order mechanism and intelligent ATR stop loss can make full use of price fluctuations. Optimizing parameter settings and incorporating more indicators can further improve strategy performance. This strategy is suitable for high frequency two-way trading and can also serve as an auxiliary decision-making tool.
[/trans]
Strategy Arguments
| Argument | Default | Description |
|---|---|---|
| v_input_int_1 | 12 | Fast MA Period |
| v_input_int_2 | 26 | Fast MA Period |
| v_input_int_3 | 14 | ATR length |
| v_input_float_1 | true | atr inner multiplier |
| v_input_float_2 | 2 | atr inner multiplier |
| v_input_float_3 | 3 | atr inner multiplier |
| v_input_int_4 | 2021 | Start Year |
| v_input_int_5 | 12 | Start Month |
| v_input_int_6 | true | Start Day |
| v_input_bool_1 | false | Using Specific End Test Date |
| v_input_int_7 | 2022 | End Year |
| v_input_int_8 | true | End Month |
| v_input_int_9 | 31 | End Day |
| v_input_int_10 | 8 | Minimum position Hold Limit |
Source (PineScript)
/*backtest
start: 2023-10-24 00:00:00
end: 2023-11-23 00:00:00
period: 1h
basePeriod: 15m
exchanges: [{"eid":"Futures_Binance","currency":"BTC_USDT"}]
*/

// This source code is subject to the terms of the Mozilla Public License 2.0 at https://mozilla.org/MPL/2.0/
// © fenirlix

//@version=5
// Strategy parameter incl. position size, commission and initial capital
strategy("ACTIONZONE-ATR REVERSEORDER STRATEGY", "ACTIONZONEATR-REVERSEORDER", overlay=true
     )

// User Input Variable
fastMaInput     = input.int(12, "Fast MA Period", minval=2, step=1)
slowMaInput     = input.int(26, "Fast MA Period", minval=2, step=1)

atrLengthInput  = input.int(14, "ATR length", minval=2,step=1)
atrInnerMultInput = input.float(1, "atr inner multiplier", minval=0.1, step=0.1)
atrMidMultInput = input.float(2, "atr inner multiplier", minval=0.1, step=0.1) //***** MOST OF RISK MANAGEMENT LOGIC BASE ON THIS INPUT *****//
atrOuterMultInput = input.float(3, "atr inner multiplier", minval=0.1, step=0.1)

// Backtesting Date range
startYearInput      = input.int(2021, "Start Year", minval=1900, maxval=2100, step=1)
startMonthInput     = input.int(12, "Start Month", minval=1, maxval=12, step=1)
startDateInput      = input.int(1, "Start Day", minval=1, maxval=31, step=1)
setEndRangeInput    = input.bool(false, "Using Specific End Test Date") //Set specific End date or use present(end of candle) data
endYearInput        = input.int(2022, "End Year", minval=1900, maxval=2100, step=1)
endMonthInput       = input.int(1, "End Month", minval=1, maxval=12, step=1)
endDateInput        = input.int(31, "End Day", minval=1, maxval=31, step=1)

startDate = timestamp(syminfo.timezone, startYearInput, startMonthInput, startDateInput)
endDate = timestamp(syminfo.timezone, endYearInput, endMonthInput, endDateInput)
inDateRange = time >= startDate //Set backtest date range to present data
if setEndRangeInput
    inDateRange and time <= endDate //set backtest date range to specific date

// minimum position hold period (to get rid of false signal in sideway trend)
minHoldInput = input.int(8, 'Minimum position Hold Limit', minval=1, maxval=365, step=1) // Set Minimum Position Hold

var bool reverseToLong = false // Assign reverse order operator
var bool reverseToShort = false // Assign reverse order operator

// Indicator Declaration
fastEma = ta.ema(close, fastMaInput)
slowEma = ta.ema(close, slowMaInput)
atr = ta.atr(atrLengthInput)

// Declare trend of asset
isBullish = fastEma > slowEma
isBearish = fastEma <= slowEma

// Record position hold length, to limit minimum hold period(candle)
var int hold_length = 0
if strategy.opentrades > 0 or strategy.opentrades < 0
    hold_length := hold_length + 1
else
    hold_length := 0

// create permanent variable of stop price
var float longStopPrice = na
var float shortStopPrice = na

// Chart-Indicator COLOR declaration
REDBEAR     = color.new(color.red, 80)
GREENBULL   = color.new(color.green, 80)

greenLong = isBullish and close > fastEma
yellowLong = isBullish and close < fastEma
blueShort = isBearish and close > fastEma
redShort = isBearish and close < fastEma

// assign oversold, overbought condition(in this case, price over middle atr plus/minus fastEma)
overBand = high[1] > fastEma + (2*atr)
underBand = low[1] < fastEma - (2*atr)

// Strategy

// Main Entry Condition
goLong = isBullish and isBullish[1] == 0
goShort = isBearish and isBearish[1] == 0

inPosition = strategy.position_size != 0
minHoldPeriod = hold_length > minHoldInput ? true : false

// Entry Condition
if not inPosition and inDateRange and barstate.isconfirmed == true //compute after close of the bar to avoid repainting
    if goLong or reverseToLong // Long if longcondition or reverse order receive.
        strategy.entry('long', strategy.long)
        longStopPrice := fastEma - (atr * 2) // Set stop loss price
        reverseToLong := false // Reset reverse order status

    else if goShort or reverseToShort
        strategy.entry('short', strategy.short)
        shortStopPrice := fastEma + (atr * 2)
        reverseToShort := false
// Take profit and Set Higher Stop
if inPosition and minHoldPeriod and barstate.isconfirmed == true // check if we're in position and pass minimum hold period, confirm no repainting
    if strategy.position_size > 0
        // if exit position by Sellcondition(which is the same as ShortCondition), Exit Long position and make Short order(by set reverse order to true)
        strategy.close('long', when=goShort, comment='exitLong(' + str.tostring(hold_length) + ')')
        reverseToShort := true
        if overBand //If overbought condition met, set Stop price to LAST LOW, and not reverse any position
            longStopPrice := low[1]
            reverseToShort := false
    else if strategy.position_size < 0
        strategy.close('short', when=goLong, comment='exitShort(' + str.tostring(hold_length) + ')')
        reverseToLong := true
        if underBand
            shortStopPrice := high[1]
            reverseToLong := false
// Stop Loss and Set calculate stop loss using Atr Channel
if inPosition
    if strategy.position_size > 0
        if fastEma - (atr * atrMidMultInput) > longStopPrice // set long stop price to the higher of latest long stop price and ATR lower channel
            longStopPrice := fastEma - (atr * atrMidMultInput)
        strategy.exit('Long Stop atr ', 'long', stop=longStopPrice)
    else if strategy.position_size < 0
        if fastEma + (atr * atrMidMultInput) < shortStopPrice
            shortStopPrice := fastEma + (atr * atrMidMultInput)
        strategy.exit('Short Stop atr ', 'short', stop=shortStopPrice)

// Plotting
fastLine = plot(fastEma, title='fast ema line', linewidth=1, color=isBullish ? color.green : color.red)
slowLine = plot(slowEma, title='slow ema line', linewidth=2, color= isBullish? color.green : color.red)
atrUpperLine1 = plot(fastEma + (atr * atrInnerMultInput), title='ATR Upperline1', color=color.new(color.black,85))
atrLowerLine1 = plot(fastEma - (atr * atrInnerMultInput), title='ATR Lowerline1', color=color.new(color.black,85))
atrUpperLine2 = plot(fastEma + (atr * atrMidMultInput), title='ATR Upperline2', color=color.new(color.black,75))
atrLowerLine2 = plot(fastEma - (atr * atrMidMultInput), title='ATR Lowerline2', color=color.new(color.black,75))
atrUpperLine3 = plot(fastEma + (atr * atrOuterMultInput), title='ATR Upperline3', color=color.new(color.black,50))
atrLowerLine3 = plot(fastEma - (atr * atrOuterMultInput), title='ATR Lowerline3', color=color.new(color.black,50))

plot(longStopPrice, color=strategy.position_size > 0 ? color.red : na, linewidth=2)
plot(shortStopPrice, color=strategy.position_size < 0 ? color.red : na, linewidth=2)

//  Filling
fill(fastLine, slowLine, color=isBullish ? GREENBULL : REDBEAR)
fill(atrUpperLine3, atrLowerLine3, color=inPosition and (minHoldInput - hold_length > 0) ? color.new(color.blue,90): na)

barColor = switch
    greenLong => color.green
    yellowLong =>  color.yellow
    blueShort => color.blue
    redShort => color.red
    => color.black
barcolor(color=barColor)

// Fill background to distinguish inactive time(Zulu time)
nightTime = time(timeframe.period, "1500-0100") ? color.new(color.black, 95): na
bgcolor(nightTime)
Detail
https://www.fmz.com/strategy/433125
Last Modified
2023-11-24 15:55:36