
8.8 KiB
Name
动态RSI智能择时波段交易策略-Dynamic-RSI-Smart-Timing-Swing-Trading-Strategy
Author
ChaoZhang
Strategy Description
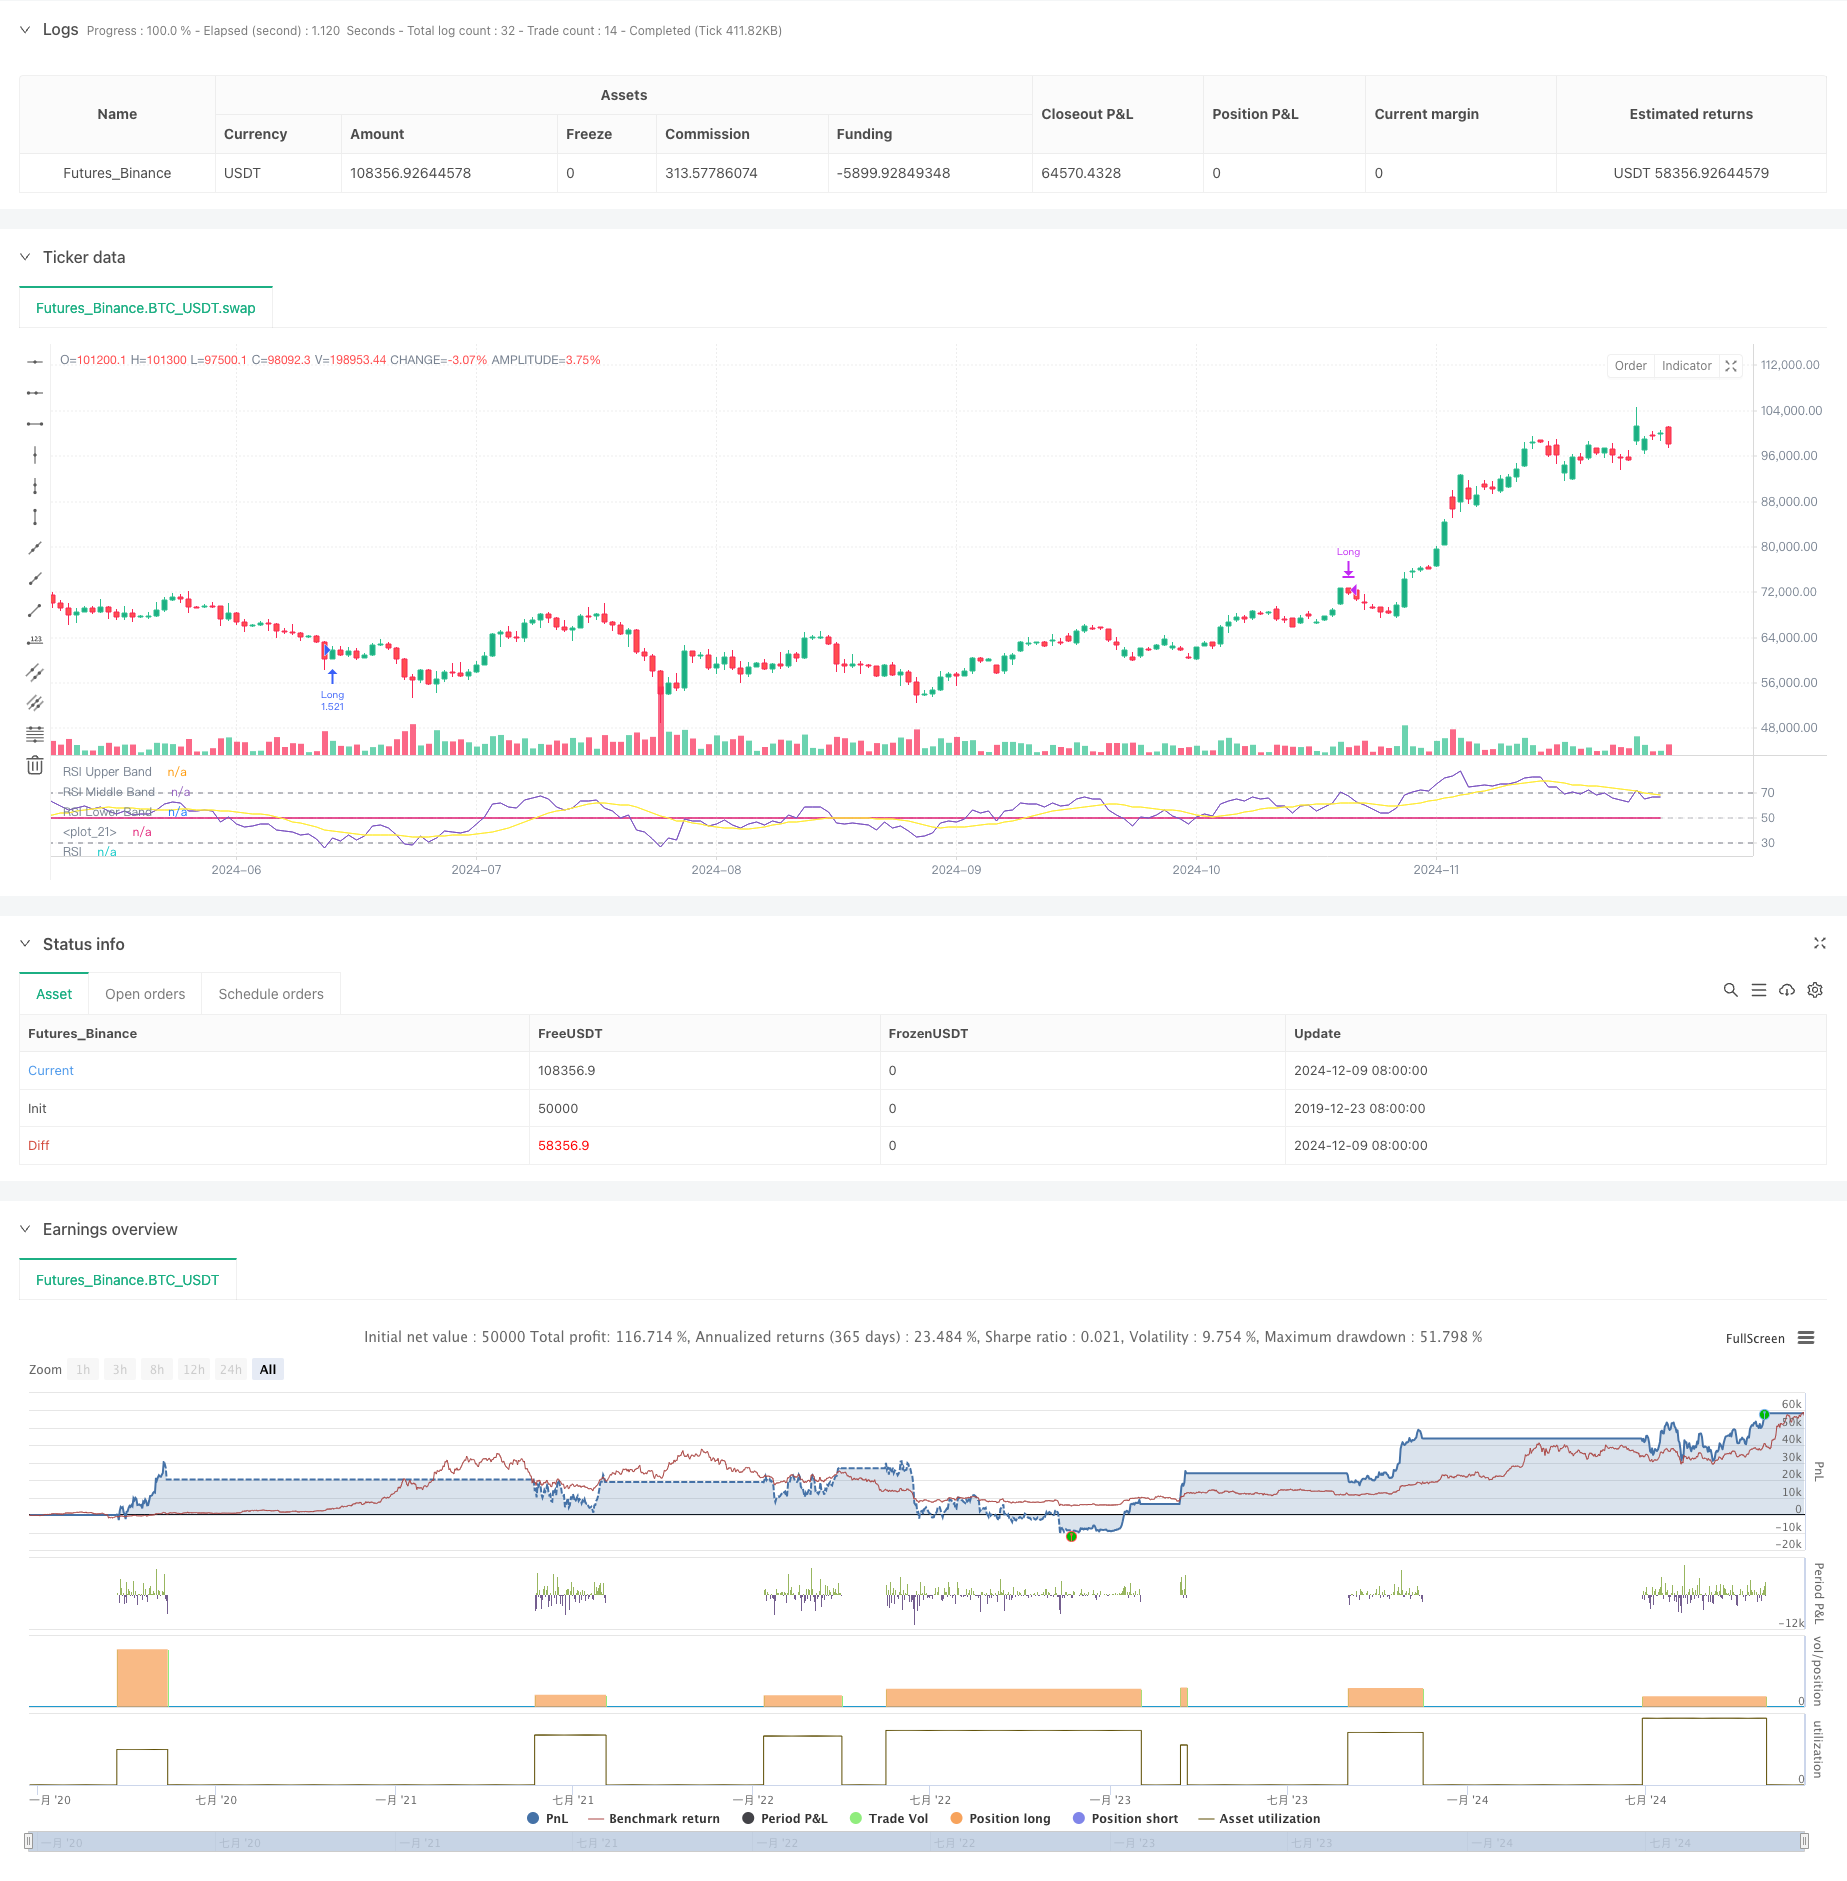
[trans]
概述
本策略是一个基于相对强弱指数(RSI)的智能交易系统,结合了多种移动平均线和布林带指标,通过识别市场超买超卖区域进行择时交易。策略核心是通过RSI的突破和回落信号,配合不同类型的移动平均线进行趋势确认,实现高效的波段操作。该策略具有较强的适应性,可以根据不同市场环境调整参数。
策略原理
策略采用14周期RSI作为核心指标,通过监测RSI与30/70这两个关键水平的交叉情况来产生交易信号。当RSI向上突破30时,系统认为市场由超卖转为看涨,触发做多信号;当RSI向下跌破70时,系统判断市场由超买转为看跌,触发平仓信号。同时,策略引入了多种均线(SMA、EMA、SMMA、WMA、VWMA)和布林带作为辅助指标,用于确认趋势方向和市场波动性。
策略优势
- 信号明确: RSI指标的超买超卖信号清晰,易于理解和执行
- 风险可控: 通过设定明确的入场和出场条件,有效控制风险
- 灵活性强: 支持多种均线类型,可根据市场情况灵活切换
- 自适应性: 布林带能够根据市场波动自动调整交易区间
- 易于优化: 参数可调整性强,便于根据不同市场情况进行优化
策略风险
- 震荡市风险: 在横盘震荡市场可能产生频繁假突破信号
- 趋势延续风险: 过早平仓可能错过大趋势行情
- 参数敏感性: 不同参数设置可能导致策略表现差异较大
- 滑点影响: 在流动性较差的市场可能面临较大滑点
- 系统性风险: 在极端市场环境下可能出现连续止损
策略优化方向
- 引入成交量指标: 通过成交量确认信号有效性
- 添加趋势过滤器: 结合更长周期趋势判断,避免逆势交易
- 优化止损机制: 引入动态止损,提高资金利用效率
- 完善仓位管理: 根据市场波动性动态调整仓位大小
- 增加市场情绪指标: 结合其他技术指标提高信号准确率
总结
该策略通过RSI指标捕捉市场超买超卖机会,结合多种技术指标进行信号确认,具有较好的实用性和可靠性。策略设计充分考虑了风险控制,通过参数优化和指标组合可以适应不同市场环境。建议交易者在实盘使用前进行充分的回测验证,并根据具体市场特点调整参数设置。 ||
Overview
This strategy is an intelligent trading system based on the Relative Strength Index (RSI), combining various moving averages and Bollinger Bands to time trades by identifying market overbought and oversold zones. The core mechanism relies on RSI breakthrough and pullback signals, complemented by different types of moving averages for trend confirmation, enabling efficient swing trading. The strategy demonstrates strong adaptability and can be adjusted for different market conditions.
Strategy Principle
The strategy utilizes a 14-period RSI as its core indicator, generating trading signals by monitoring RSI crossovers with key levels at 30 and 70. A long signal is triggered when RSI breaks above 30, indicating a shift from oversold to bullish conditions. A closing signal is generated when RSI falls below 70, suggesting a transition from overbought to bearish conditions. The strategy incorporates various moving averages (SMA, EMA, SMMA, WMA, VWMA) and Bollinger Bands as supplementary indicators for trend confirmation and volatility assessment.
Strategy Advantages
- Clear Signals: RSI's overbought and oversold signals are distinct and easy to understand
- Risk Control: Well-defined entry and exit conditions enable effective risk management
- Flexibility: Support for multiple moving average types allows adaptation to market conditions
- Adaptability: Bollinger Bands automatically adjust trading ranges based on market volatility
- Easy Optimization: Strong parameter customization facilitates market-specific adjustments
Strategy Risks
- Sideways Market Risk: May generate frequent false breakout signals in ranging markets
- Trend Continuation Risk: Early exits might miss extended trend movements
- Parameter Sensitivity: Different parameter settings can significantly affect strategy performance
- Slippage Impact: Less liquid markets may experience significant slippage
- Systematic Risk: Consecutive losses possible in extreme market conditions
Strategy Optimization Directions
- Volume Integration: Confirm signal validity through volume analysis
- Trend Filter Addition: Incorporate longer-term trend analysis to avoid counter-trend trades
- Stop-Loss Enhancement: Implement dynamic stop-loss mechanisms for improved capital efficiency
- Position Management Refinement: Adjust position sizes based on market volatility
- Market Sentiment Integration: Combine additional technical indicators to improve signal accuracy
Summary
This strategy captures market overbought and oversold opportunities through the RSI indicator, confirming signals with multiple technical indicators, demonstrating strong practicality and reliability. The strategy design thoroughly considers risk control and can adapt to various market environments through parameter optimization and indicator combinations. Traders are advised to conduct comprehensive backtesting before live implementation and adjust parameters according to specific market characteristics.[/trans]
Source (PineScript)
/*backtest
start: 2019-12-23 08:00:00
end: 2024-12-10 08:00:00
period: 1d
basePeriod: 1d
exchanges: [{"eid":"Futures_Binance","currency":"BTC_USDT"}]
*/

//@version=5
strategy(title="Demo GPT - Relative Strength Index", shorttitle="RSI Strategy", overlay=false, default_qty_type=strategy.percent_of_equity, default_qty_value=100, commission_value=0.1, slippage=3)

// Inputs
rsiLengthInput = input.int(14, minval=1, title="RSI Length", group="RSI Settings")
rsiSourceInput = input.source(close, "Source", group="RSI Settings")
calculateDivergence = input.bool(false, title="Calculate Divergence", group="RSI Settings",  tooltip="Calculating divergences is needed in order for divergence alerts to fire.")

// RSI Calculation
change = ta.change(rsiSourceInput)
up = ta.rma(math.max(change, 0), rsiLengthInput)
down = ta.rma(-math.min(change, 0), rsiLengthInput)
rsi = down == 0 ? 100 : up == 0 ? 0 : 100 - (100 / (1 + up / down))

// RSI Plots
rsiPlot = plot(rsi, "RSI", color=#7E57C2)
rsiUpperBand = hline(70, "RSI Upper Band", color=#787B86)
midline = hline(50, "RSI Middle Band", color=color.new(#787B86, 50))
rsiLowerBand = hline(30, "RSI Lower Band", color=#787B86)
fill(rsiUpperBand, rsiLowerBand, color=color.rgb(126, 87, 194, 90), title="RSI Background Fill")
plot(50, color=na, editable=false, display=display.none)

// Moving Averages
maTypeInput = input.string("SMA", "Type", options=["None", "SMA", "SMA + Bollinger Bands", "EMA", "SMMA (RMA)", "WMA", "VWMA"], group="Moving Average")
maLengthInput = input.int(14, "Length", group="Moving Average")
bbMultInput = input.float(2.0, "BB StdDev", minval=0.001, maxval=50, step=0.5, group="Moving Average")
enableMA = maTypeInput != "None"
isBB = maTypeInput == "SMA + Bollinger Bands"

// MA Calculation
ma(source, length, MAtype) =>
    switch MAtype
        "SMA" => ta.sma(source, length)
        "SMA + Bollinger Bands" => ta.sma(source, length)
        "EMA" => ta.ema(source, length)
        "SMMA (RMA)" => ta.rma(source, length)
        "WMA" => ta.wma(source, length)
        "VWMA" => ta.vwma(source, length)

smoothingMA = enableMA ? ma(rsi, maLengthInput, maTypeInput) : na
smoothingStDev = isBB ? ta.stdev(rsi, maLengthInput) * bbMultInput : na
plot(smoothingMA, "RSI-based MA", color=color.yellow, display=enableMA ? display.all : display.none)
bbUpperBand = plot(smoothingMA + smoothingStDev, title="Upper Bollinger Band", color=color.green, display=isBB ? display.all : display.none)
bbLowerBand = plot(smoothingMA - smoothingStDev, title="Lower Bollinger Band", color=color.green, display=isBB ? display.all : display.none)
fill(bbUpperBand, bbLowerBand, color=isBB ? color.new(color.green, 90) : na, title="Bollinger Bands Background Fill", display=isBB ? display.all : display.none)

// Trade Logic
longCondition = ta.crossover(rsi, 30)
exitCondition = ta.crossunder(rsi, 70)

// Start Date & End Date
startDate = input(timestamp("2018-01-01 00:00"), "Start Date", group="Date Range")
endDate = input(timestamp("2069-12-31 23:59"), "End Date", group="Date Range")
inDateRange = true

// Execute Trades
if (longCondition and inDateRange)
    strategy.entry("Long", strategy.long)

if (exitCondition and inDateRange)
    strategy.close("Long")
Detail
https://www.fmz.com/strategy/474815
Last Modified
2024-12-12 11:32:55