
10 KiB
Name
动态马克平均线趋势策略Dynamic-Moving-Average-Trend-Trading-Strategy
Author
ChaoZhang
Strategy Description
[trans]
概述
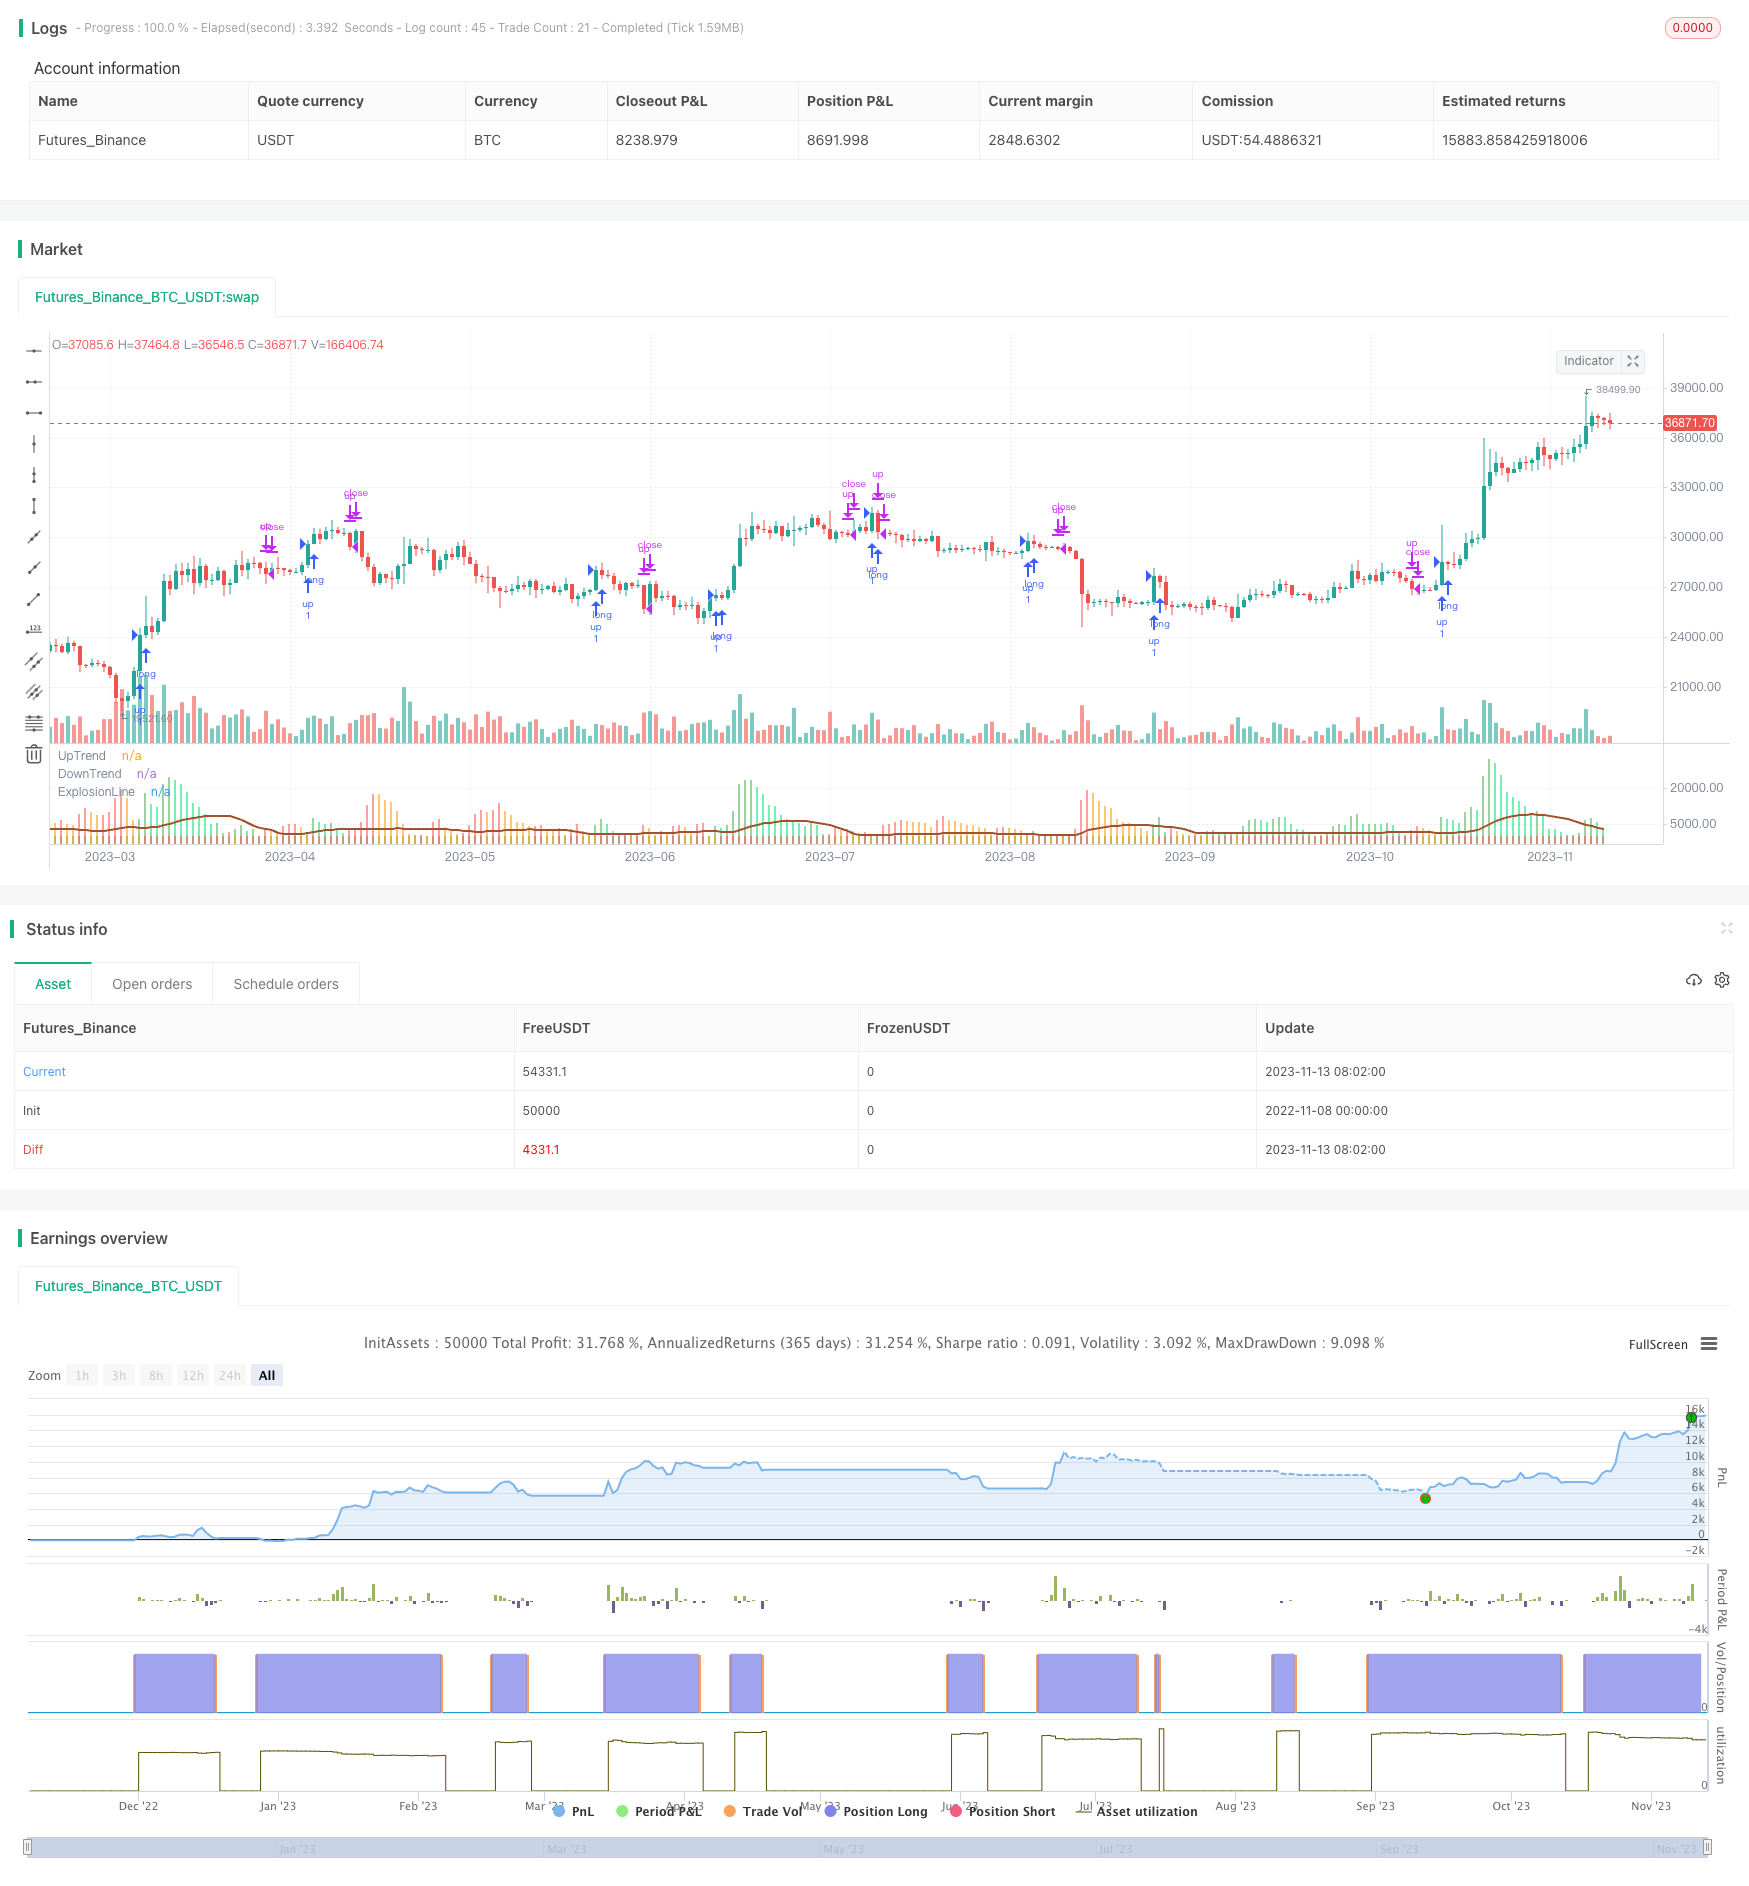
本策略基于动态马克均线的指标,结合布林带和RSI进行交易信号过滤,实现了一个只做多不做空的趋势跟踪策略。该策略通过计算海克线收盘价的动态马克均线变化来判断趋势,并与布林带比较来发出交易信号。结合RSI过滤器,可以有效识别趋势的爆发点,实现趋势跟踪。
策略原理
本策略的核心是计算海克线收盘价的动态马克均线的变化。具体来说,是计算当前K线与前两个K线的马克均线差值,再乘以灵敏度系数,得到准确的马克均线变化值。
然后,将这个变化值与布林带的上轨和下轨的差值进行比较。如果马克均线变化大于布林带差值,则认为趋势出现“爆发”。当该爆发是正的,即马克均线变化为正,则产生做多信号和绿色柱状线。当爆发是负的,即马克均线变化为负,则产生平仓信号和红色柱状线。
此外,该策略还设置了RSI过滤器,只有当RSI高于阈值时才会发出做多信号,从而避免趋势反转的风险。
策略优势
- 利用动态马克均线判断趋势,可以有效跟踪趋势的变化
- 布林带作为动态指标,结合马克均线,可以更好地识别趋势爆发
- RSI过滤器可以避免低位反弹带来的假信号
- 只做多不做空,适合持续上涨的牛市
- 可调参数灵活,可针对不同品种和周期进行优化
策略风险
- 只做多不做空,无法获利于下跌行情
- 过于依赖参数优化,不同品种和周期需要重新测试
- 无法有效捕捉趋势反转,可能带来较大亏损
- RSI过滤器设置不当可能错过交易机会
- 高参数灵敏度容易产生噪音交易
风险缓解措施包括:适当调整参数使之更稳健、结合其它指标判断趋势反转、只在长线清晰趋势中使用等。
策略优化方向
本策略还有一定的优化空间:
-
尝试不同的价格源,如收盘价、均线等,以获得更好的平滑效果
-
调整马克均线和布林带的周期参数,优化针对不同品种
-
尝试比例关系替代灵敏度系数,使指标结果更直观
-
增加其它过滤器,如趋势均线、交易量等,提高信号质量
-
开发空头策略,根据指标形态进行逆向操作
-
加入止损机制,更好地控制风险
总结
本策略总体来说是一个较为稳定的趋势跟踪策略。它利用动态均线判断趋势方向,布林带识别爆发点,RSI过滤假信号,实现了一个只做多的趋势系统。但也存在一定的风险,需要针对不同品种和周期进行参数优化,且无法获利于下跌行情。本策略还有进一步提高信号质量、开发空头策略、加入止损等优化空间,以获得更好的绩效。
||
Overview
This strategy is based on the Dynamic Moving Average indicator, combined with Bollinger Bands and RSI for trade signal filtering. It implements a trend following long only strategy. The strategy judges the trend by calculating the change of Heiken Ashi closing price Dynamic Moving Average and compares it with Bollinger Bands to generate trade signals. With the RSI filter, it can effectively identify trend explosive points for trend tracking.
Strategy Logic
The core of this strategy is to calculate the change of Heiken Ashi closing price Dynamic Moving Average. Specifically, it calculates the difference between the current bar's MA and the MA of previous two bars, then multiplies it by a sensitivity coefficient to get the accurate MA change value.
Then this change value is compared with the difference between Bollinger Bands upper band and lower band. If the MA change is greater than the BB difference, it is considered as a "trend explosion". When the explosion is positive, i.e. the MA change is positive, it generates a long signal and green bar. When the explosion is negative, i.e. the MA change is negative, it generates a close signal and red bar.
In addition, this strategy has a RSI filter that only allows long signals when RSI is higher than a threshold, avoiding the risk of trend reversal.
Advantages
- Dynamic MA to effectively track trend changes
- BB as a dynamic indicator combined with MA for better trend explosion identification
- RSI filter avoids false signals from low rebounds
- Long only suitable for persistent bull market
- Flexible adjustable parameters for different products and timeframes
Risks
- Long only cannot profit from downtrend
- Overly dependent on parameter optimization for different products and timeframes
- Unable to capture trend reversal effectively, may lead to large losses
- Improper RSI filter settings may miss trading opportunities
- High sensitivity may generate noisy trades
Risk control methods include: proper parameter tuning for robustness, combining other indicators to judge trend reversal, use only in clear long-term trends, etc.
Optimization Directions
There is some room for further optimization:
-
Try different price sources like close, moving averages etc. for better smoothing
-
Adjust MA and BB period parameters for optimization across different products
-
Try ratio relationship instead of sensitivity coefficient for more intuitive indicator value
-
Add other filters like trendlines, volume etc. to improve signal quality
-
Develop short strategy based on indicator patterns
-
Incorporate stop loss mechanisms for better risk control
Conclusion
Overall this is a relatively stable trend following strategy. It uses dynamic moving average to determine trend direction, BB to identify explosive points, RSI to filter false signals, realizing a long only trend system. But it also has some risks, requiring parameter tuning for different products and timeframes, and inability to profit from downtrends. There is room for further improvements like enhancing signal quality, developing short strategy, adding stop loss etc. to achieve better performance.
[/trans]
Strategy Arguments
| Argument | Default | Description |
|---|---|---|
| v_input_1 | 150 | Sensitivity |
| v_input_2 | 20 | MacD FastEMA Length |
| v_input_3 | 40 | MacD SlowEMA Length |
| v_input_4 | 20 | BB Channel Length |
| v_input_5 | 1.5 | BB Stdev Multiplier |
| v_input_6 | 40 | RSI Value trade filter |
Source (PineScript)
/*backtest
start: 2022-11-08 00:00:00
end: 2023-11-14 00:00:00
period: 1d
basePeriod: 1h
exchanges: [{"eid":"Futures_Binance","currency":"BTC_USDT"}]
*/

//@version=5

///////////Original Script Courtesy of Lazy_Bear.... Absolute Legend\\\\\\\\\\\\\\\

strategy('SmoothedWaddah', overlay=false, initial_capital=1)
sensitivity = input(150, title='Sensitivity')
fastLength = input(20, title='MacD FastEMA Length')
slowLength = input(40, title='MacD SlowEMA Length')
channelLength = input(20, title='BB Channel Length')
mult = input(1.5, title='BB Stdev Multiplier')
RSI14filter = input(40, title='RSI Value trade filter')

////////////MacD Calculation of price//////////////////////////////
calc_macd(source, fastLength, slowLength) =>
    fastMA = ta.ema(source, fastLength)
    slowMA = ta.ema(source, slowLength)
    fastMA - slowMA

/////////BolingerBand Calculation of Price///////////////////////
calc_BBUpper(source, length, mult) =>
    basis = ta.sma(source, length)
    dev = mult * ta.stdev(source, length)
    basis + dev

calc_BBLower(source, length, mult) =>
    basis = ta.sma(source, length)
    dev = mult * ta.stdev(source, length)
    basis - dev

//////heinkenashi chart call for closing price "smoothing mechanism"\\\\\\\\\\\\\\\\\\\\\\\\\\\
point = request.security(ticker.heikinashi(syminfo.tickerid), timeframe.period, close)

////////////////////T1 is change in MacD current  candle from previous candle Sensitivy amplifies calculation/////////////////////
t1 = (calc_macd(point, fastLength, slowLength) - calc_macd(point[1], fastLength, slowLength)) * sensitivity
//////////////////////T2 is  T1 from two candles prior\\\\\\\\\\\\\\\\\\\\\\\\\\\
t2 = (calc_macd(point[2], fastLength, slowLength) - calc_macd(point[3], fastLength, slowLength)) * sensitivity

////////////////E1 is difference in bolinger band upper and lower...E2 is E1 from one candle prior not needed//////////////
e1 = calc_BBUpper(ohlc4, channelLength, mult) - calc_BBLower(ohlc4, channelLength, mult)
//e2 = (calc_BBUpper(close[1], channelLength, mult) - calc_BBLower(close[1], channelLength, mult))

//////signal bar printing.. Up if MacD positive .. Down if MacD negative//////////
trendUp = t1 >= 0 ? t1 : 0
trendDown = t1 < 0 ? -1 * t1 : 0

///////plots difference in macD*Sensitivity, color change if increasing or decreasing.
//////color is green/lime if explosion is up \ color is red/orange if explosion is down/////////
plot(trendUp, style=plot.style_columns, linewidth=1, color=trendUp < trendUp[1] ? color.new(color.lime,45) : color.new(color.green,45), title='UpTrend')
plot(trendDown, style=plot.style_columns, linewidth=1, color=trendDown < trendDown[1] ? color.new(color.orange,45) : color.new(color.red,45), title='DownTrend')
plot(e1, style=plot.style_line, linewidth=2, color=color.new(#A0522D, 0), title='ExplosionLine')


////////////Entry conditions and Concept/////////////////////
////////////Long Only System. T1 is measuring the distance between MACD EMA's. This is Multiplied
////////////by the sensitivity so that it can be compared to the difference between BollingerBand.
/////////////{this could have been a ratio maybe i will work with that in a different script.}
/////////////I found that 135-175 sensitivy allows for values to be compared on most charts.....
////////////If the (difference between the EMA)*(Sensitivity) is greater than (BB upper line- BB lower line)
////////////it is considered an explosion in either the downside or the upside.The indicator will print
///////////a bar higher than the trigger line either green or red (up or down respectively)//////////////////

longCondition = trendUp > e1 and ta.rsi(close, 14) > RSI14filter
if longCondition
    strategy.entry('up', strategy.long)

strategy.close('up', trendDown > e1)
Detail
https://www.fmz.com/strategy/432237
Last Modified
2023-11-15 17:45:13