
33 KiB
Name
动态色彩阈值波动分析交易策略-Dynamic-Color-Threshold-Volatility-Analysis-Trading-Strategy
Author
ianzeng123
Strategy Description
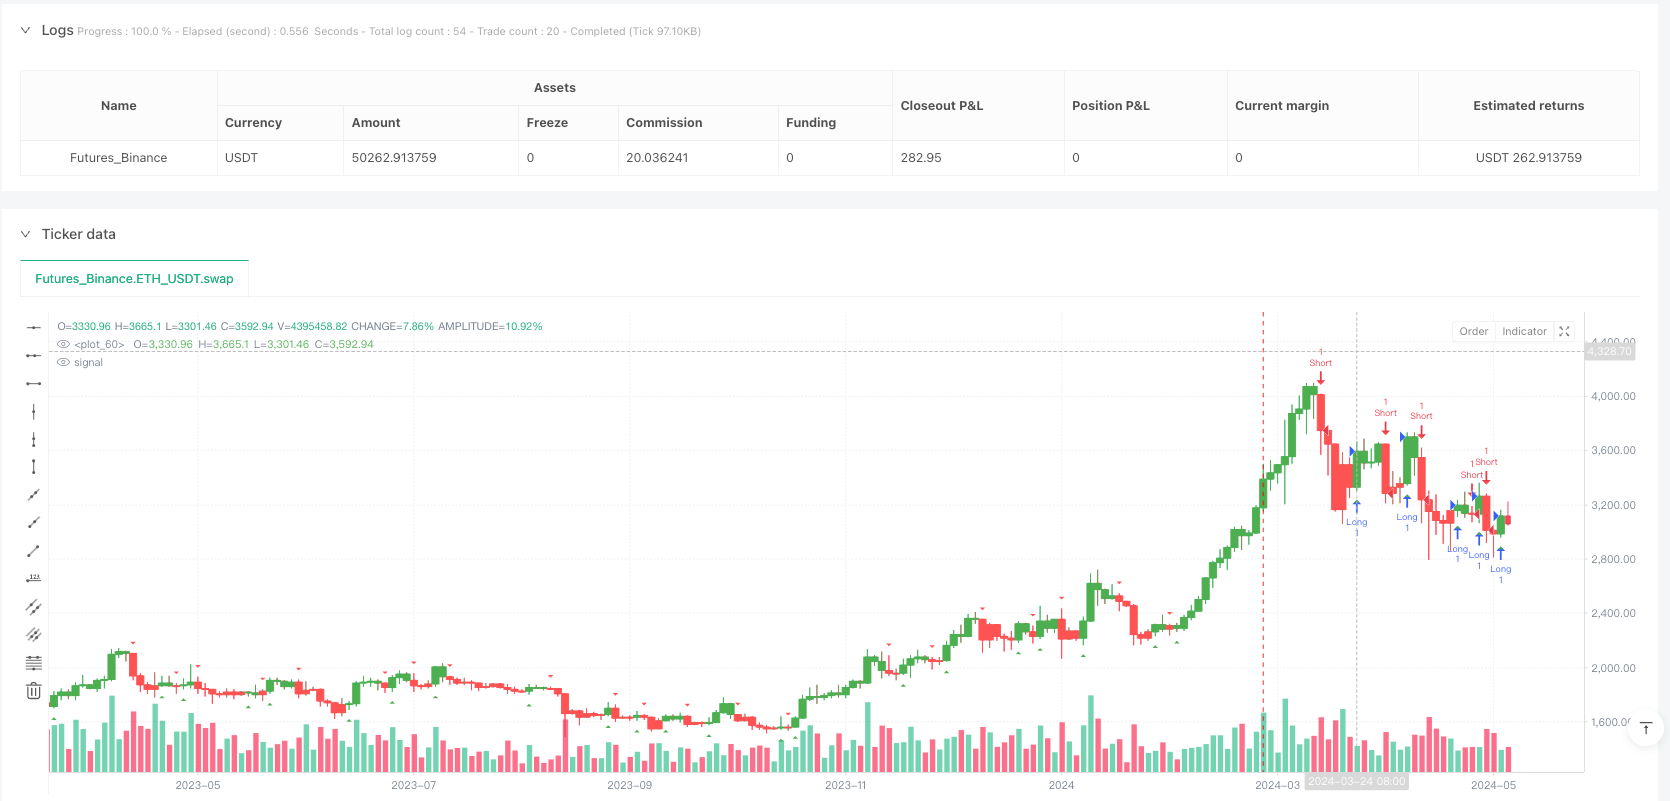
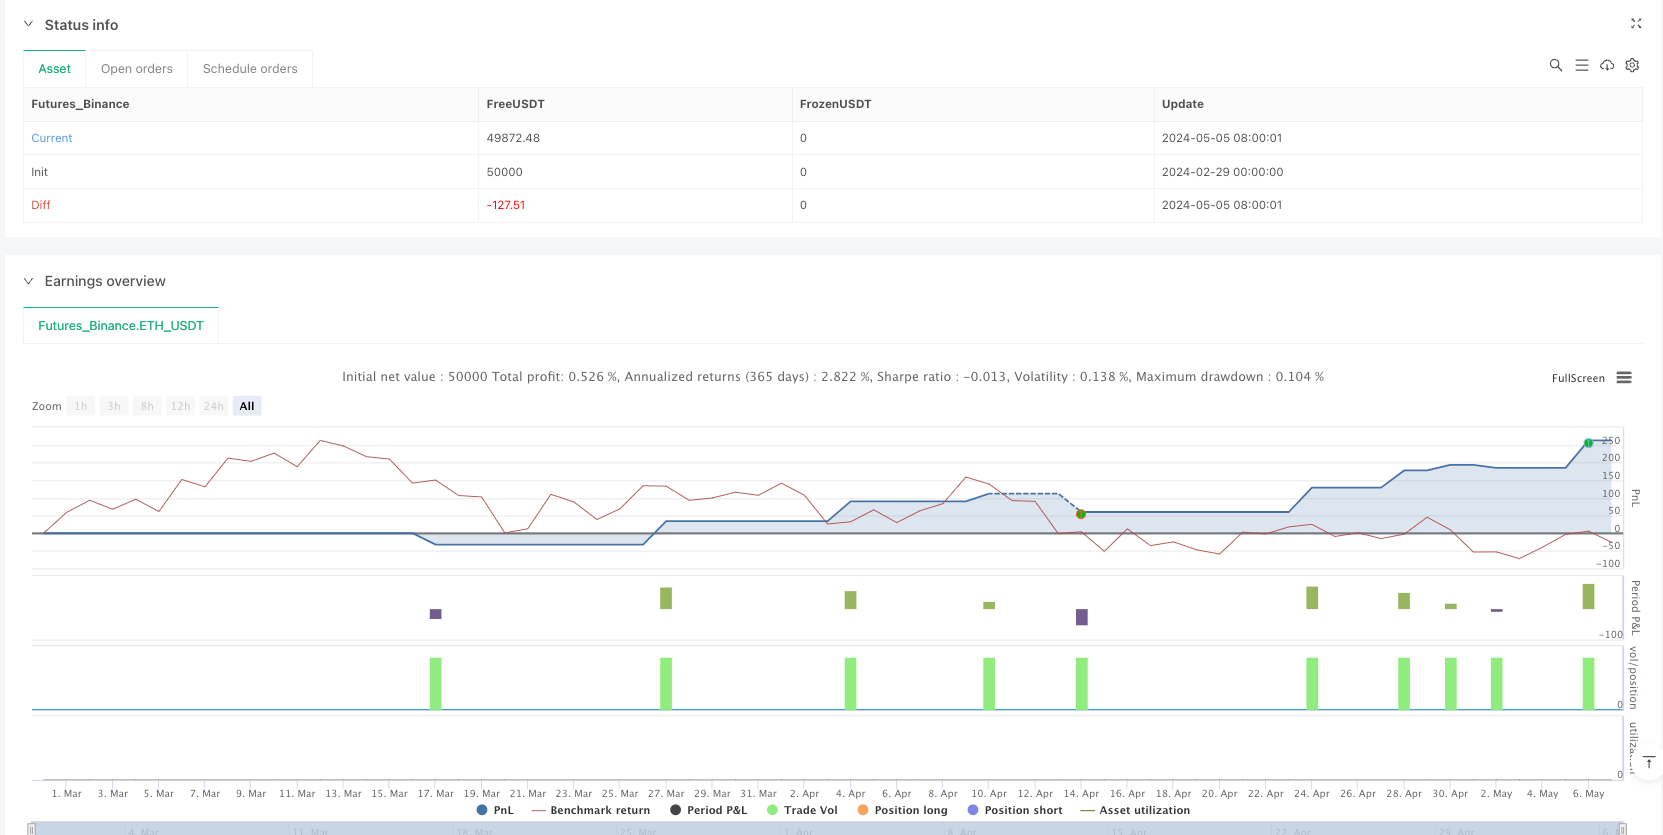
[trans]
概述
动态色彩阈值波动分析交易策略是一种基于价格走势和市场波动性的双重因素驱动的交易系统。该策略核心在于利用自定义的色彩编码覆盖层,根据K线颜色的动态变化提供精确的买入和卖出信号。与传统的依靠收盘价相对于开盘价的K线颜色判断不同,本策略通过融合平均真实波幅(ATR)作为波动性指标,建立了一个更为自适应的市场分析框架。
策略通过计算K线之间的色彩转换来识别潜在的交易机会,具体而言,是通过比较开盘价与收盘价的关系,结合动态阈值判断来确定K线的颜色变化。当K线从红色(看跌)转变为绿色(看涨)时,生成买入信号;当K线从绿色(看涨)转变为红色(看跌)时,生成卖出信号。这些信号通过直观的视觉提示(三角形箭头)呈现在图表上,便于交易者快速识别。
此外,该策略还提供了灵活的交易时间窗口设置,允许交易者指定特定的交易时段,以及止损和止盈功能,为风险管理提供了有力支持。无论是寻找短期交易机会还是分析市场反转,本策略都提供了一种直观的方式来识别交易信号。
策略原理
动态色彩阈值波动分析交易策略的运作原理主要基于以下几个关键组成部分:
-
色彩编码计算: 策略首先计算自定义的色彩编码K线,包括:
- 色彩收盘价(
color_code_close): 通过(开盘价+最高价+最低价+收盘价)/4计算 - 色彩开盘价(
color_code_open): 对于第一根K线,使用(开盘价+收盘价)/2;对于后续K线,使用前一根K线的(色彩开盘价+色彩收盘价)/2 - 色彩最高价(
color_code_high): 取最高价与色彩开盘价、色彩收盘价中的最大值 - 色彩最低价(
color_code_low): 取最低价与色彩开盘价、色彩收盘价中的最小值
- 色彩收盘价(
-
动态阈值设定: 策略使用固定的阈值百分比(1%)乘以色彩K线范围(高-低)来设定动态阈值。这确保了只有当价格变动超过这个与波动性相关的阈值时,才会触发颜色变化。
-
颜色变化逻辑:
- 从绿色到红色(看涨到看跌): 当前一根K线是看涨的(色彩收盘价>色彩开盘价),当前K线是看跌的(色彩收盘价<色彩开盘价),且色彩收盘价与色彩开盘价的绝对差值大于动态阈值
- 从红色到绿色(看跌到看涨): 当前一根K线是看跌的(色彩收盘价<色彩开盘价),当前K线是看涨的(色彩收盘价>色彩开盘价),且色彩收盘价与色彩开盘价的绝对差值大于动态阈值
-
可视化呈现: 策略使用不同颜色的三角形图案来标记颜色变化:
- 红色向下三角形: 表示从绿色到红色的变化(潜在的卖出信号)
- 绿色向上三角形: 表示从红色到绿色的变化(潜在的买入信号)
-
交易执行逻辑:
- 买入条件: 当颜色从红色变为绿色时,如果交易类型设置为"Both"或"Long Only"
- 卖出条件: 当颜色从绿色变为红色时,如果交易类型设置为"Both"或"Short Only"
- 平仓逻辑: 买入后,如果颜色从绿色变为红色,则平仓;卖出后,如果颜色从红色变为绿色,则平仓
-
风险管理机制:
- 止损设置: 多头交易在入场价下方设置固定点数的止损;空头交易在入场价上方设置固定点数的止损
- 止盈设置: 多头交易在入场价上方设置固定点数的止盈;空头交易在入场价下方设置固定点数的止盈
-
交易时间限制: 策略只在用户定义的时间窗口内执行交易操作,提供了时间过滤功能
通过这种设计,策略能够捕捉到价格的重要转折点,并基于波动性调整其灵敏度,使其在不同市场环境下都能保持有效性。
策略优势
-
波动性自适应: 该策略最显著的优势在于其波动性自适应机制。通过将动态阈值与K线范围挂钩,策略可以在高波动性市场中设置较高的阈值,避免过度交易;在低波动性市场中设置较低的阈值,确保不会错过重要信号。这种自适应特性使策略能够在各种市场条件下保持一致的性能。
-
视觉直观性: 通过色彩编码和视觉提示(箭头),交易者可以直观地识别市场趋势和潜在的交易机会,无需复杂的技术指标叠加。这种简洁的视觉呈现方式降低了分析的复杂性,提高了决策效率。
-
灵活的交易选项: 策略提供了多种交易选项("Both"、"Long Only"、"Short Only"),使交易者可以根据个人偏好或市场偏向来调整交易方向。这种灵活性使策略能够适应各种交易风格和市场环境。
-
内置风险管理: 策略内置了止损和止盈功能,按照固定点数设置风险限制。这种风险管理机制确保了每笔交易的风险是可控的,有助于保护资金安全和交易纪律的执行。
-
时间过滤功能: 通过允许用户定义特定的交易时间窗口,策略能够避免在流动性不足或波动性异常的市场时段进行交易。这有助于提高交易质量,避免在不利市场条件下执行交易。
-
基于价格行为的信号生成: 策略直接从价格行为中生成信号,而不是依赖滞后指标。这种方法可以更及时地捕捉市场转折点,提高信号的及时性和准确性。
-
自定义警报功能: 策略提供了多种警报条件,包括看涨、看跌状态以及颜色变化。这些警报帮助交易者及时获取市场变化通知,即使不在电脑前也能把握交易机会。
-
代码结构清晰: 从代码实现来看,策略结构清晰,逻辑分明,易于理解和维护。各个组件之间的关系明确,便于后续优化和扩展。
策略风险
-
假信号风险: 尽管策略使用动态阈值来过滤小幅波动,但在某些市场条件下,如横盘整理或低波动阶段,仍可能产生假信号。这些信号可能导致不必要的交易并增加成本。解决方法:可以考虑增加额外的过滤条件,如结合趋势指标或波动率过滤器来确认信号。
-
固定止损风险: 策略使用固定点数的止损和止盈,而不是基于市场波动性动态调整。在波动性突然增加的情况下,固定止损可能过小,容易被市场噪音触及;在波动性低的情况下,止损可能过大,导致单笔亏损过高。解决方法:可以考虑将止损和止盈设置与ATR挂钩,使其随市场波动性动态调整。
-
时间窗口限制: 虽然时间过滤有助于避免低质量交易,但也可能错过时间窗口外的重要机会,尤其是在全球市场中,重要的价格突破可能发生在任何时间。解决方法:可以考虑设置多个时间窗口,或者为窗口外的强信号设置特殊处理规则。
-
缺乏趋势确认: 该策略主要基于价格的短期变化生成信号,没有考虑更大的市场趋势。在与主趋势相反的方向交易可能会导致频繁止损。解决方法:可以添加趋势过滤器,只在顺应主趋势的方向进行交易,或者对逆势信号设置更严格的确认条件。
-
参数敏感性: 1%的阈值百分比是固定的,没有考虑不同市场和时间周期的特性。这个参数可能对某些市场过于敏感,对其他市场则不够敏感。解决方法:可以将阈值百分比设为可调参数,或者基于历史数据进行优化。
-
交易频率不确定: 由于策略基于动态颜色变化生成信号,交易频率可能因市场条件而大幅波动。在某些阶段可能产生过多交易,增加交易成本;在其他阶段可能长时间没有信号。解决方法:可以设置交易间隔限制或信号质量过滤器,控制交易频率。
-
资金管理欠缺: 策略没有内置资金管理机制,如头寸规模计算。这可能导致风险敞口不一致,影响长期绩效。解决方法:添加基于账户余额、波动性和风险承受能力的头寸规模计算。
-
回测偏差风险: 策略在回测中可能表现良好,但在实盘中可能面临滑点、交易延迟等问题,影响实际表现。解决方法:在回测中考虑交易成本、滑点等因素,进行更加真实的模拟。
策略优化方向
-
动态阈值百分比优化: 当前策略使用固定的1%阈值百分比,可以将其改为可调参数,或者基于市场条件动态调整。例如,可以根据近期波动性的变化来调整阈值百分比,在高波动性阶段提高阈值,在低波动性阶段降低阈值。这样可以使策略更好地适应不同市场环境,减少假信号。
-
整合趋势过滤器: 引入额外的趋势指标,如移动平均线、ADX或者长期色彩状态,仅在主趋势方向生成信号。例如,可以添加一个较长周期的移动平均线,只有当价格在均线上方时才考虑做多信号,价格在均线下方时才考虑做空信号。这种优化可以显著提高信号质量,避免逆势交易。
-
改进风险管理机制: 将固定点数的止损和止盈改为基于ATR的动态设置。例如,可以设置止损为入场价格加减N倍的ATR值,这样止损点位会随市场波动性自动调整。同时,可以实现追踪止损功能,在价格向有利方向移动时,自动调整止损位置以锁定部分利润。
-
增加信号强度分级: 基于颜色变化的幅度和其他确认因素,为信号分配不同的强度等级。例如,可以计算颜色变化的幅度相对于动态阈值的比率,幅度越大,信号强度越高;或者结合成交量、价格突破等因素进行多维度评估。然后根据信号强度调整头寸大小或设置不同的风险参数。
-
优化交易时间窗口: 通过历史数据分析,找出最佳交易时段,或者为不同市场会话设置不同的参数。例如,可以分析不同时间段的盈利能力和信号质量,然后调整交易时间窗口以专注于最有效的市场时段。也可以为亚洲、欧洲和美国会话分别设置不同的参数,以适应各个市场的特性。
-
添加成交量确认: 将成交量作为信号确认的附加条件,确保色彩变化发生在有足够市场参与度的情况下。例如,可以要求信号出现时的成交量高于近期平均成交量,或者考察成交量的变化趋势,以确认价格变动的有效性。
-
实现自适应参数: 使用自适应算法,根据近期市场表现自动调整策略参数。例如,可以实现一个滚动窗口分析,定期评估不同参数组合的表现,并自动选择最优参数,使策略能够随市场条件演变而不断优化。
-
增加市场状态识别: 添加市场状态识别模块,在不同的市场状态(趋势、区间、高波动、低波动)下使用不同的交易规则。例如,可以使用波动性指标和趋势强度指标来识别市场状态,然后在趋势明显时专注于趋势跟踪,在区间市场中使用反转策略,在高波动期间提高阈值要求等。
-
添加多时间框架分析: 整合更高时间框架的信号确认,提高交易质量。例如,可以检查更高时间框架的色彩状态,只有当更高时间框架和当前时间框架的信号一致时,才执行交易,这样可以避免与更大趋势相抵触的交易。
-
实现智能出场策略: 除了简单的止损和止盈外,增加基于市场行为的智能出场规则。例如,可以基于特定数量的连续反向色彩K线、动量衰减或者关键价格水平突破等条件来调整出场决策,使出场更加灵活和智能。
总结
动态色彩阈值波动分析交易策略是一种结合价格行为和市场波动性的创新交易系统。通过自定义的色彩编码K线和动态阈值机制,该策略能够识别重要的市场转折点,并生成直观的买卖信号。其核心优势在于波动性自适应能力,使其能够在不同市场环境下保持有效性。
策略通过视觉直观的方式呈现市场状态,大大简化了交易决策过程。内置的风险管理功能和时间过滤机制进一步增强了策略的实用性和安全性。然而,该策略也面临假信号风险、固定止损问题和缺乏趋势确认等挑战,需要交易者谨慎使用并考虑进一步优化。
未来优化方向主要集中在动态参数调整、趋势过滤、改进风险管理、信号强度分级和多时间框架分析等方面。通过这些优化,可以进一步提高策略的稳健性和适应性,使其在各种市场条件下都能保持良好的表现。
总的来说,动态色彩阈值波动分析交易策略为交易者提供了一种简洁而强大的市场分析工具,特别适合那些喜欢基于价格行为和视觉分析进行交易的人。通过合理的参数设置和持续优化,这一策略有潜力成为交易者工具箱中的有力武器。 ||
Overview
The Dynamic Color Threshold Volatility Analysis Trading Strategy is a trading system driven by both price movement and market volatility factors. The core of this strategy lies in utilizing a custom color-coded overlay to provide accurate buy and sell signals based on dynamic color changes of candles. Unlike traditional candlestick color judgments that rely solely on closing price relative to opening price, this strategy incorporates the Average True Range (ATR) as a volatility indicator, establishing a more adaptive market analysis framework.
The strategy identifies potential trading opportunities by calculating color transitions between candles, specifically by comparing the relationship between opening and closing prices combined with dynamic threshold judgments to determine candle color changes. When a candle transitions from red (bearish) to green (bullish), it generates a buy signal; when a candle shifts from green (bullish) to red (bearish), it generates a sell signal. These signals are presented on the chart through intuitive visual cues (triangular arrows), allowing traders to quickly identify opportunities.
Additionally, the strategy offers flexible trading window settings, allowing traders to specify particular trading periods, as well as stop-loss and take-profit functions, providing strong support for risk management. Whether looking for short-term trading opportunities or analyzing market reversals, this strategy provides an intuitive approach to identifying trading signals.
Strategy Principles
The operational principles of the Dynamic Color Threshold Volatility Analysis Trading Strategy are based on several key components:
-
Color Code Calculation: The strategy first calculates custom color-coded candles, including:
- Color code close (
color_code_close): Calculated as (open+high+low+close)/4 - Color code open (
color_code_open): For the first candle, uses (open+close)/2; for subsequent candles, uses (previous color code open + previous color code close)/2 - Color code high (
color_code_high): Takes the maximum value among high, color code open, and color code close - Color code low (
color_code_low): Takes the minimum value among low, color code open, and color code close
- Color code close (
-
Dynamic Threshold Setting: The strategy uses a fixed threshold percentage (1%) multiplied by the color code candle range (high-low) to set a dynamic threshold. This ensures that only price movements exceeding this volatility-related threshold will trigger color changes.
-
Color Change Logic:
- Green to red (bullish to bearish): When the previous candle was bullish (color code close > color code open), the current candle is bearish (color code close < color code open), and the absolute difference between color code close and color code open exceeds the dynamic threshold
- Red to green (bearish to bullish): When the previous candle was bearish (color code close < color code open), the current candle is bullish (color code close > color code open), and the absolute difference between color code close and color code open exceeds the dynamic threshold
-
Visual Presentation: The strategy uses different colored triangular patterns to mark color changes:
- Red downward triangle: Indicates a change from green to red (potential sell signal)
- Green upward triangle: Indicates a change from red to green (potential buy signal)
-
Trade Execution Logic:
- Buy condition: When color changes from red to green, if trade type is set to "Both" or "Long Only"
- Sell condition: When color changes from green to red, if trade type is set to "Both" or "Short Only"
- Exit logic: After buying, if color changes from green to red, exit; after selling, if color changes from red to green, exit
-
Risk Management Mechanism:
- Stop loss setting: For long trades, set a fixed number of pips below entry price; for short trades, set a fixed number of pips above entry price
- Take profit setting: For long trades, set a fixed number of pips above entry price; for short trades, set a fixed number of pips below entry price
-
Trading Time Restriction: The strategy only executes trading operations within a user-defined time window, providing time filtering functionality
Through this design, the strategy can capture important price turning points and adjust its sensitivity based on volatility, maintaining effectiveness across different market environments.
Strategy Advantages
-
Volatility Adaptation: The most significant advantage of this strategy is its volatility adaptation mechanism. By linking dynamic thresholds to candle range, the strategy can set higher thresholds in high-volatility markets to avoid overtrading, and lower thresholds in low-volatility markets to ensure important signals aren't missed. This adaptive feature allows the strategy to maintain consistent performance across various market conditions.
-
Visual Intuitiveness: Through color coding and visual cues (arrows), traders can intuitively identify market trends and potential trading opportunities without complex technical indicator overlays. This concise visual presentation reduces analytical complexity and improves decision-making efficiency.
-
Flexible Trading Options: The strategy provides multiple trading options ("Both", "Long Only", "Short Only"), allowing traders to adjust trading direction based on personal preferences or market bias. This flexibility enables the strategy to adapt to various trading styles and market environments.
-
Built-in Risk Management: The strategy incorporates stop-loss and take-profit functions, setting risk limits according to fixed pip values. This risk management mechanism ensures that the risk of each trade is controllable, helping to protect capital safety and maintain trading discipline.
-
Time Filtering Function: By allowing users to define specific trading time windows, the strategy can avoid trading during market sessions with insufficient liquidity or abnormal volatility. This helps improve trading quality and avoids executing trades under unfavorable market conditions.
-
Price Action-Based Signal Generation: The strategy generates signals directly from price action rather than relying on lagging indicators. This approach can capture market turning points more promptly, improving signal timeliness and accuracy.
-
Custom Alert Functions: The strategy provides various alert conditions, including bullish/bearish states and color changes. These alerts help traders receive timely market change notifications, allowing them to seize trading opportunities even when away from the computer.
-
Clear Code Structure: From an implementation perspective, the strategy has a clear structure and logic that is easy to understand and maintain. The relationships between components are well-defined, facilitating subsequent optimization and expansion.
Strategy Risks
-
False Signal Risk: Although the strategy uses dynamic thresholds to filter small fluctuations, it may still generate false signals under certain market conditions, such as sideways consolidation or low volatility phases. These signals may lead to unnecessary trades and increase costs. Solution: Consider adding additional filtering conditions, such as combining trend indicators or volatility filters to confirm signals.
-
Fixed Stop Loss Risk: The strategy uses fixed pip values for stop-loss and take-profit, rather than dynamically adjusting based on market volatility. In cases of sudden increased volatility, fixed stops may be too small and easily triggered by market noise; in low volatility conditions, stops may be too large, resulting in excessive single-trade losses. Solution: Consider linking stop-loss and take-profit settings to ATR, making them dynamically adjust with market volatility.
-
Time Window Limitations: While time filtering helps avoid low-quality trades, it may also miss important opportunities outside the time window, especially in global markets where significant price breakouts can occur at any time. Solution: Consider setting multiple time windows or establishing special handling rules for strong signals outside the window.
-
Lack of Trend Confirmation: The strategy primarily generates signals based on short-term price changes without considering the broader market trend. Trading against the main trend may lead to frequent stop-outs. Solution: Add trend filters to only trade in the direction of the main trend, or set stricter confirmation conditions for counter-trend signals.
-
Parameter Sensitivity: The 1% threshold percentage is fixed and doesn't account for the characteristics of different markets and timeframes. This parameter may be too sensitive for some markets and not sensitive enough for others. Solution: Make the threshold percentage an adjustable parameter or optimize it based on historical data.
-
Uncertain Trading Frequency: Since the strategy generates signals based on dynamic color changes, trading frequency may fluctuate significantly depending on market conditions. In some phases, it may produce too many trades, increasing trading costs; in other phases, there may be no signals for extended periods. Solution: Set trade interval restrictions or signal quality filters to control trading frequency.
-
Insufficient Capital Management: The strategy doesn't have built-in capital management mechanisms, such as position size calculations. This may lead to inconsistent risk exposure, affecting long-term performance. Solution: Add position size calculations based on account balance, volatility, and risk tolerance.
-
Backtest Bias Risk: The strategy may perform well in backtesting but face issues such as slippage and trade delays in live trading, affecting actual performance. Solution: Consider trading costs, slippage, and other factors in backtesting for more realistic simulation.
Strategy Optimization Directions
-
Dynamic Threshold Percentage Optimization: The current strategy uses a fixed 1% threshold percentage, which could be changed to an adjustable parameter or dynamically adjusted based on market conditions. For example, the threshold percentage could be adjusted according to recent volatility changes, increasing the threshold during high volatility phases and decreasing it during low volatility phases. This would allow the strategy to better adapt to different market environments and reduce false signals.
-
Integrate Trend Filters: Introduce additional trend indicators, such as moving averages, ADX, or long-term color states, to generate signals only in the direction of the main trend. For example, add a longer-period moving average and only consider long signals when price is above the moving average, and short signals when price is below it. This optimization can significantly improve signal quality and avoid counter-trend trading.
-
Improve Risk Management Mechanism: Change fixed pip stop-loss and take-profit to dynamic settings based on ATR. For example, set stop-loss at entry price plus or minus N times the ATR value, so stop levels automatically adjust with market volatility. Simultaneously, implement trailing stop functionality to automatically adjust stop positions as price moves favorably, locking in partial profits.
-
Add Signal Strength Grading: Assign different strength levels to signals based on the magnitude of color changes and other confirmation factors. For example, calculate the ratio of color change magnitude relative to the dynamic threshold—the larger the magnitude, the higher the signal strength—or conduct multi-dimensional assessment combining volume, price breakouts, and other factors. Then adjust position size or set different risk parameters according to signal strength.
-
Optimize Trading Time Windows: Analyze historical data to find optimal trading sessions, or set different parameters for different market sessions. For example, analyze the profitability and signal quality of different time periods, then adjust trading time windows to focus on the most effective market sessions. Parameters could also be set differently for Asian, European, and American sessions to adapt to the characteristics of each market.
-
Add Volume Confirmation: Use volume as an additional condition for signal confirmation, ensuring color changes occur under conditions of sufficient market participation. For example, require that signal volume is higher than recent average volume, or examine volume trend changes to confirm the validity of price movements.
-
Implement Adaptive Parameters: Use adaptive algorithms to automatically adjust strategy parameters based on recent market performance. For example, implement a rolling window analysis to periodically evaluate the performance of different parameter combinations and automatically select optimal parameters, allowing the strategy to continuously optimize as market conditions evolve.
-
Add Market State Recognition: Add a market state recognition module to use different trading rules under different market states (trending, ranging, high volatility, low volatility). For example, use volatility indicators and trend strength indicators to identify market states, then focus on trend following during obvious trends, use reversal strategies in ranging markets, raise threshold requirements during high volatility periods, etc.
-
Add Multi-Timeframe Analysis: Integrate higher timeframe signal confirmation to improve trading quality. For example, check the color state of higher timeframes and only execute trades when signals from higher timeframes and the current timeframe are consistent, avoiding trades that conflict with larger trends.
-
Implement Intelligent Exit Strategies: In addition to simple stop-loss and take-profit, add intelligent exit rules based on market behavior. For example, adjust exit decisions based on specific numbers of consecutive reverse-colored candles, momentum decay, or key price level breakouts, making exits more flexible and intelligent.
Summary
The Dynamic Color Threshold Volatility Analysis Trading Strategy is an innovative trading system that combines price action and market volatility. Through custom color-coded candles and a dynamic threshold mechanism, the strategy can identify important market turning points and generate intuitive buy and sell signals. Its core advantage lies in its volatility adaptation capability, enabling it to maintain effectiveness across different market environments.
The strategy presents market states in a visually intuitive way, greatly simplifying the trading decision process. Built-in risk management functions and time filtering mechanisms further enhance the strategy's practicality and safety. However, the strategy also faces challenges such as false signal risk, fixed stop-loss issues, and lack of trend confirmation, requiring traders to use it cautiously and consider further optimization.
Future optimization directions mainly focus on dynamic parameter adjustment, trend filtering, improved risk management, signal strength grading, and multi-timeframe analysis. Through these optimizations, the strategy's robustness and adaptability can be further enhanced, allowing it to maintain good performance across various market conditions.
Overall, the Dynamic Color Threshold Volatility Analysis Trading Strategy provides traders with a concise yet powerful market analysis tool, particularly suitable for those who prefer trading based on price action and visual analysis. With reasonable parameter settings and continuous optimization, this strategy has the potential to become a powerful weapon in a trader's toolkit.[/trans]
Source (PineScript)
/*backtest
start: 2024-02-29 00:00:00
end: 2024-05-07 00:00:00
period: 2d
basePeriod: 2d
exchanges: [{"eid":"Futures_Binance","currency":"ETH_USDT"}]
*/

//@version=5
strategy("Color Code Overlay Strategy", overlay=true, shorttitle="Color Code Strategy")

// Input to select trade type: "Both", "Long Only", or "Short Only"
trade_type = input.string("Both", title="Trade Type", options=["Both", "Long Only", "Short Only"])

// Input for stop loss in pips
stop_loss_pips = input.int(20, title="Stop Loss (pips)", minval=1)
// Input for take profit in pips
take_profit_pips = input.int(40, title="Take Profit (pips)", minval=1)

// Dynamically calculate the pip value based on the symbol's minimum tick size
pip_value = syminfo.mintick

// Calculate Color Code Candles using the exact formula
color_code_close = (open + high + low + close) / 4

// Initialize Color Code open for the first bar, then use previous open and close for the following bars
var float color_code_open = na
color_code_open := na(color_code_open[1]) ? (open + close) / 2 : (color_code_open[1] + color_code_close[1]) / 2

// Correctly calculate Color Code High and Low
color_code_high = math.max(high, math.max(color_code_open, color_code_close))
color_code_low = math.min(low, math.min(color_code_open, color_code_close))

// Fixed threshold percentage (no user input)
threshold_percent = 1.0

// Calculate the range of the custom Color Code candle (High - Low)
color_code_range = color_code_high - color_code_low

// Define the dynamic threshold based on the fixed threshold percentage and candle range
dynamic_threshold = (threshold_percent / 100) * color_code_range

// Detect color change conditions based on the dynamic threshold
color_code_is_bullish = color_code_close > color_code_open
color_code_was_bullish = color_code_close[1] > color_code_open[1]

// Color change from green to red (bullish to bearish)
color_change_green_to_red = color_code_was_bullish and not color_code_is_bullish and (math.abs(color_code_close - color_code_open) > dynamic_threshold)

// Color change from red to green (bearish to bullish)
color_change_red_to_green = not color_code_was_bullish and color_code_is_bullish and (math.abs(color_code_close - color_code_open) > dynamic_threshold)

// Plot arrows to indicate color changes
plotshape(series=color_change_green_to_red, location=location.abovebar, color=color.red, style=shape.triangledown, size=size.tiny, title="Color Change to Red")
plotshape(series=color_change_red_to_green, location=location.belowbar, color=color.green, style=shape.triangleup, size=size.tiny, title="Color Change to Green")

// Define the color for the body: green for bullish (Color Code Close > Color Code Open), red for bearish (Color Code Close < Color Code Open)
color_code_color = color_code_close > color_code_open ? color.green : color.red

// Apply the body color to the candles (barcolor affects both body and outline)
barcolor(color_code_color, title="Color Code Body Color", offset=0)

// Apply the wick and outline colors
wick_color = color_code_close > color_code_open ? color.green : color.red
outline_color = color_code_close > color_code_open ? color.green : color.red

// Plot the candles with the specified colors
plotcandle(open, high, low, close, color=color_code_color, wickcolor=wick_color, bordercolor=outline_color)


// Entry and exit logic for the strategy, only execute if within the time frame

if trade_type == "Both" or trade_type == "Long Only"
    if color_change_red_to_green
        strategy.entry("Long", strategy.long)
        // Set the stop loss for long trades (x pips below entry)
        long_stop_loss = close - stop_loss_pips * pip_value
        long_take_profit = close + take_profit_pips * pip_value
        strategy.exit("Long Exit", "Long", stop=long_stop_loss, limit=long_take_profit)
    if color_change_green_to_red
        strategy.close("Long")

if trade_type == "Both" or trade_type == "Short Only"
    if color_change_green_to_red
        strategy.entry("Short", strategy.short)
        // Set the stop loss for short trades (x pips above entry)
        short_stop_loss = close + stop_loss_pips * pip_value
        short_take_profit = close - take_profit_pips * pip_value
        strategy.exit("Short Exit", "Short", stop=short_stop_loss, limit=short_take_profit)
    if color_change_red_to_green
        strategy.close("Short")

// Alert conditions
alertcondition(color_code_close > color_code_open, title="Color Code Bullish", message="Color Code is Bullish!")
alertcondition(color_code_close < color_code_open, title="Color Code Bearish", message="Color Code is Bearish!")
alertcondition(color_change_green_to_red, title="Color Code Change to Red", message="Color Code changed to Red!")
alertcondition(color_change_red_to_green, title="Color Code Change to Green", message="Color Code changed to Green!")
Detail
https://www.fmz.com/strategy/484096
Last Modified
2025-02-28 09:59:24