
17 KiB
Name
动态均线交叉结合超买超卖趋势确认量化交易策略-Dynamic-EMA-Crossover-with-RSI-Trend-Confirmation-Quantitative-Trading-Strategy
Author
ianzeng123
Strategy Description
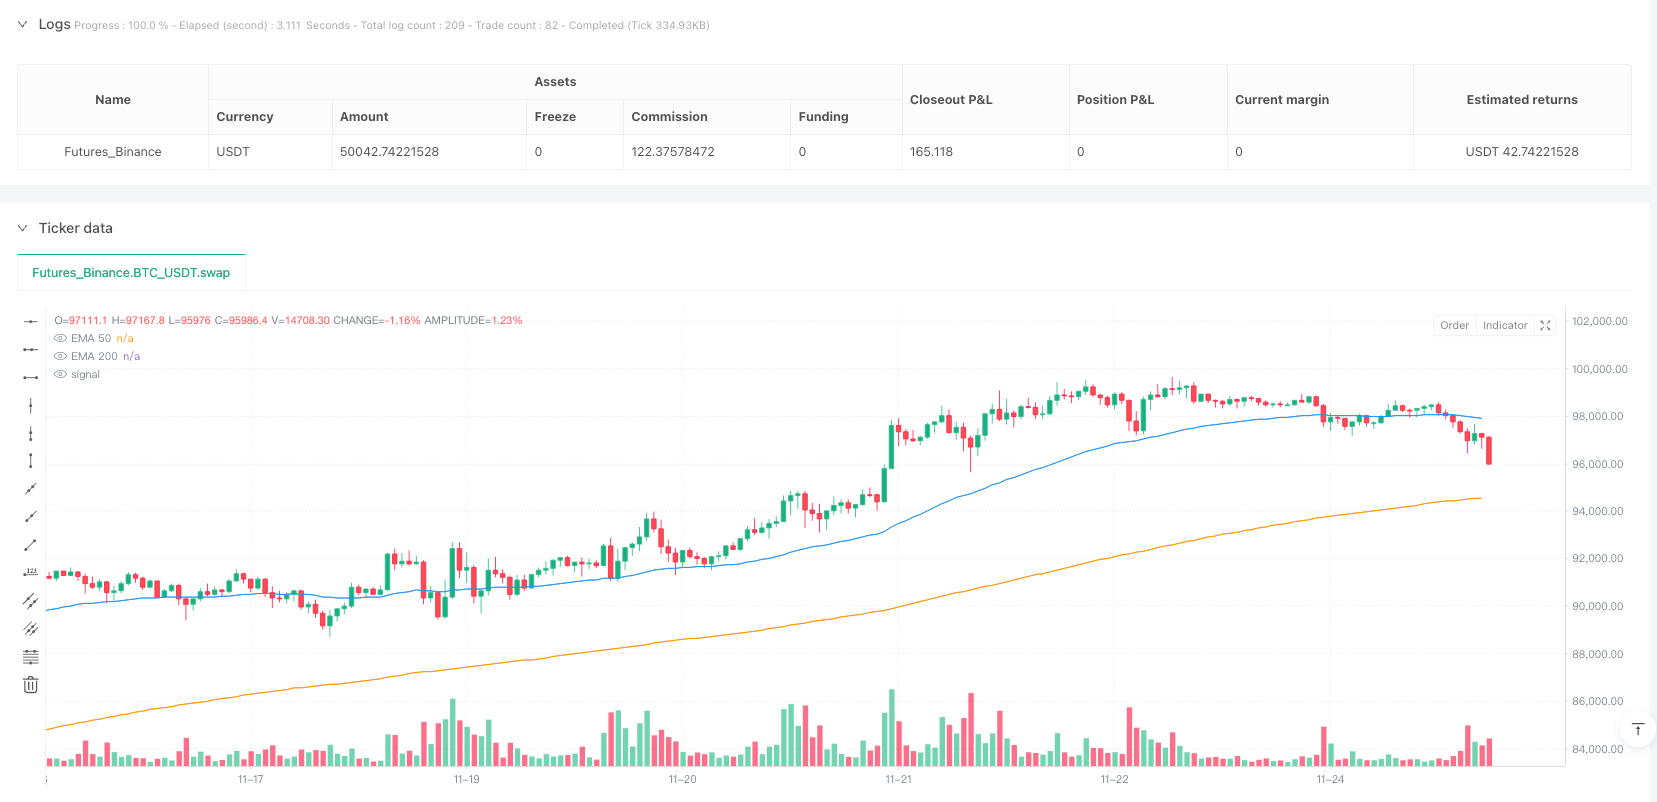
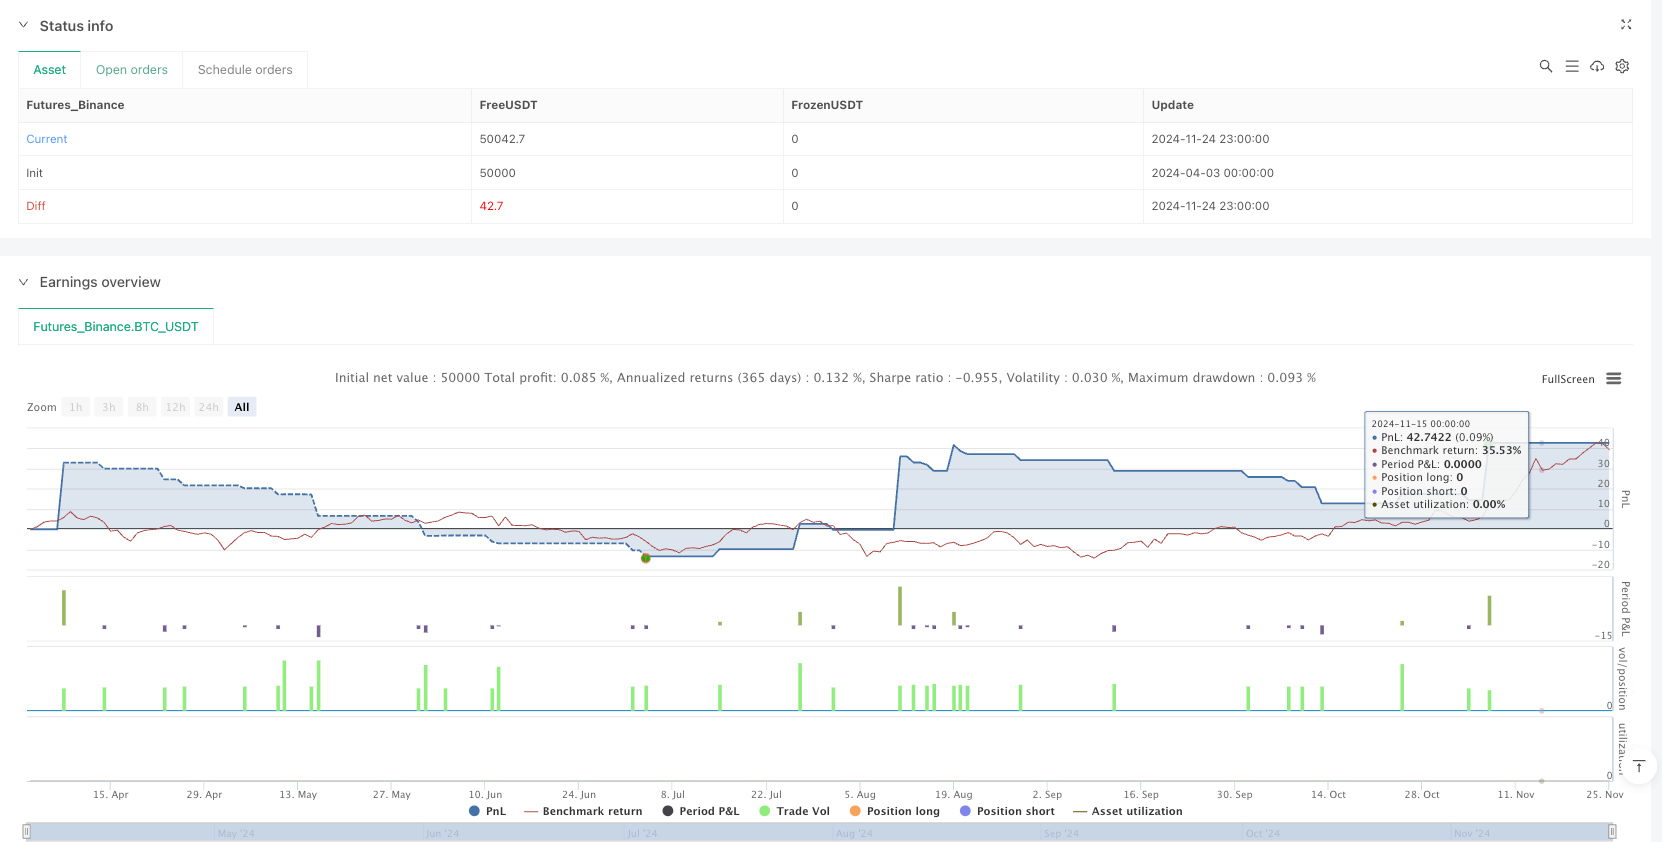
[trans]
概述
动态均线交叉结合超买超卖趋势确认量化交易策略是一种结合了指数移动平均线(EMA)和相对强弱指标(RSI)的技术分析交易系统。该策略利用短期和长期均线的交叉信号来确定市场趋势方向,同时利用RSI指标进行趋势确认和过滤,有效减少虚假信号。此外,策略内置了风险管理机制,通过设定止损和获利目标来保护交易资金,优化风险回报比。该策略适用于多种交易品种和时间周期,为交易者提供了一种系统化的交易方法。
策略原理
该策略的核心原理基于两个主要技术指标的协同作用:
-
指数移动平均线(EMA)交叉系统:
- 短期EMA默认为50周期
- 长期EMA默认为200周期
- 当短期EMA向上穿越长期EMA时,产生看涨信号
- 当短期EMA向下穿越长期EMA时,产生看跌信号
-
相对强弱指标(RSI)趋势确认:
- RSI默认设置为14周期
- 买入条件需要RSI大于50,确认上升趋势的强度
- 卖出条件需要RSI小于50,确认下降趋势的强度
- 超买区域设置为70,超卖区域设置为30
-
时间周期过滤:
- 策略仅在特定时间周期内有效:15分钟、1小时、4小时和日线
- 通过限制适用的时间周期,可以避免在噪音较大的极短周期或流动性较低的极长周期产生错误信号
-
风险管理系统:
- 用户可自定义止损点位(以点数计)
- 获利目标基于止损的倍数设定,默认为止损的2倍
- 入场后自动设置止损和获利目标,无需手动调整
策略优势
经过深入分析,该策略具有以下显著优势:
-
趋势跟踪与动量结合:EMA交叉提供趋势方向,而RSI确保在趋势已经建立的情况下才进行交易,有效平衡了趋势跟踪与动量确认。
-
自适应性强:通过参数设置可以针对不同市场环境和交易品种进行优化,适应不同的波动性特征。
-
风险控制明确:预先定义的止损和获利目标确保每笔交易的风险回报比例一致,帮助交易者保持纪律性。
-
多时间周期适用:策略可在不同时间周期运行,从短期的15分钟到长期的日线图,为不同交易风格的投资者提供选择。
-
视觉化信号清晰:策略通过图表上的明确标记(?买入和?卖出)显示交易信号,便于交易者快速识别。
-
代码结构清晰:策略代码组织合理,逻辑清晰,参数设置灵活,便于进一步定制和优化。
-
入场条件严格:通过结合两种不同性质的技术指标(趋势和动量),减少了单一指标可能带来的虚假信号。
策略风险
尽管该策略具有多项优势,但仍存在以下潜在风险:
-
滞后性风险:EMA本质上是滞后指标,在快速变动的市场中可能导致入场或出场延迟,错过最佳价格点位。
-
横盘市场表现欠佳:在没有明确趋势的横盘市场中,EMA交叉可能产生频繁的虚假信号,导致连续亏损。
-
参数敏感性:策略表现高度依赖于EMA和RSI的参数设置,不当的参数可能导致过度优化或无法适应市场变化。
-
跳空风险:固定止损无法应对市场跳空情况,可能导致实际亏损超过预期止损水平。
-
缺乏基本面考量:策略完全基于技术指标,不考虑基本面因素,在重大新闻或经济数据发布时可能产生错误信号。
风险缓解措施:
- 在重大经济事件前考虑暂停策略或扩大止损范围
- 考虑添加波动率过滤器,在异常市场条件下暂停交易
- 结合更多指标进行交易确认,如成交量或其他振荡器
- 定期重新优化参数以适应市场状况变化
策略优化方向
基于代码分析,该策略可在以下几个方向进行优化:
-
动态风险管理:
- 当前策略使用固定点数作为止损,可以改为基于ATR(平均真实波动范围)的动态止损,更好地适应不同市场的波动性
- 实现方式:
stop_loss = close - (ta.atr(14) * 1.5)
-
趋势强度过滤:
- 添加趋势强度过滤器,如ADX指标,只在明确趋势下交易
- 示例:
strong_trend = ta.adx(14) > 25
-
多时间周期分析:
- 实现高时间周期趋势确认与低时间周期信号生成的结合
- 可通过
request.security函数获取更高时间周期的趋势状态
-
优化入场时机:
- 在EMA交叉基础上,添加蜡烛图形态确认
- 考虑只在价格回调到EMA附近时入场,而非直接在交叉点入场
-
资金管理改进:
- 当前策略使用固定比例(10%)的资金管理,可以实现基于波动率的仓位调整
- 在高波动市场减少仓位,低波动市场增加仓位
-
机器学习集成:
- 长期优化方向可考虑结合机器学习算法,动态优化EMA和RSI参数
- 通过历史数据训练模型预测最优参数组合
-
情绪指标整合:
- 考虑加入市场情绪指标,如VIX或交易量变化率
- 在极端情绪市场条件下调整策略行为
总结
动态均线交叉结合超买超卖趋势确认量化交易策略是一个结构清晰、逻辑严谨的技术分析交易系统。通过结合EMA的趋势跟踪特性和RSI的动量确认能力,该策略能够有效识别市场趋势并在合适的时机进行交易。内置的风险管理机制使策略具有较好的风险控制能力,适合不同风险偏好的交易者使用。
该策略的多时间周期适应性使其可以应用于不同的交易风格,从日内交易到摇摆交易再到长期投资。通过本文提出的优化方向,特别是动态风险管理和多重确认机制,该策略可以进一步提升其稳健性和适应性。
然而,交易者在使用此策略时应当注意市场环境的变化,特别是在低波动性和横盘市场中可能需要调整参数或暂时停用策略。没有任何策略能在所有市场环境中表现优异,因此结合个人交易风格和风险管理原则来使用和优化本策略至关重要。 ||
Overview
The Dynamic EMA Crossover with RSI Trend Confirmation Quantitative Trading Strategy is a technical analysis trading system that combines Exponential Moving Averages (EMA) and the Relative Strength Index (RSI). This strategy utilizes crossover signals between short-term and long-term moving averages to determine market trend direction, while using the RSI indicator for trend confirmation and filtering, effectively reducing false signals. Additionally, the strategy incorporates risk management mechanisms through predefined stop-loss and take-profit targets to protect trading capital and optimize the risk-reward ratio. This strategy is applicable to various trading instruments and timeframes, providing traders with a systematic approach to trading.
Strategy Principles
The core principles of this strategy are based on the synergistic effect of two main technical indicators:
-
Exponential Moving Average (EMA) Crossover System:
- Short-term EMA default is 50 periods
- Long-term EMA default is 200 periods
- When the short-term EMA crosses above the long-term EMA, a bullish signal is generated
- When the short-term EMA crosses below the long-term EMA, a bearish signal is generated
-
Relative Strength Index (RSI) Trend Confirmation:
- RSI default setting is 14 periods
- Buy conditions require RSI greater than 50, confirming uptrend strength
- Sell conditions require RSI less than 50, confirming downtrend strength
- Overbought level is set at 70, oversold level is set at 30
-
Timeframe Filtering:
- Strategy is only valid in specific timeframes: 15 minutes, 1 hour, 4 hours, and daily
- By limiting applicable timeframes, the strategy avoids generating erroneous signals in extremely short periods with high noise or extremely long periods with lower liquidity
-
Risk Management System:
- User-definable stop-loss levels (in points)
- Take-profit targets based on a multiple of the stop-loss, default is 2 times the stop-loss
- Automatic setting of stop-loss and take-profit after entry, requiring no manual adjustment
Strategy Advantages
After in-depth analysis, this strategy shows the following significant advantages:
-
Trend Following and Momentum Combination: EMA crossovers provide trend direction, while RSI ensures trades are only taken when the trend is established, effectively balancing trend following with momentum confirmation.
-
Strong Adaptability: Through parameter settings, the strategy can be optimized for different market environments and trading instruments, adapting to different volatility characteristics.
-
Clear Risk Control: Predefined stop-loss and take-profit targets ensure consistent risk-reward ratios for each trade, helping traders maintain discipline.
-
Multi-timeframe Applicability: The strategy can run on different timeframes, from short-term 15-minute to long-term daily charts, offering choices for investors with different trading styles.
-
Clear Visual Signals: The strategy displays trading signals through clear markings on the chart (? buy and ? sell), allowing traders to quickly identify opportunities.
-
Clear Code Structure: The strategy code is well-organized, with clear logic and flexible parameter settings, facilitating further customization and optimization.
-
Strict Entry Conditions: By combining two different types of technical indicators (trend and momentum), the strategy reduces false signals that might arise from using a single indicator.
Strategy Risks
Despite its many advantages, the strategy still has the following potential risks:
-
Lag Risk: EMAs are inherently lagging indicators, which may lead to delayed entries or exits in rapidly changing markets, missing optimal price points.
-
Poor Performance in Ranging Markets: In markets without clear trends, EMA crossovers may generate frequent false signals, leading to consecutive losses.
-
Parameter Sensitivity: Strategy performance is highly dependent on EMA and RSI parameter settings; inappropriate parameters may lead to over-optimization or inability to adapt to market changes.
-
Gap Risk: Fixed stop-losses cannot account for market gaps, potentially resulting in actual losses exceeding expected stop-loss levels.
-
Lack of Fundamental Considerations: The strategy is entirely based on technical indicators, disregarding fundamental factors, which may generate incorrect signals during major news or economic data releases.
Risk mitigation measures:
- Consider pausing the strategy or widening stop-loss ranges before major economic events
- Consider adding volatility filters to pause trading during abnormal market conditions
- Incorporate additional indicators for trade confirmation, such as volume or other oscillators
- Regularly re-optimize parameters to adapt to changing market conditions
Strategy Optimization Directions
Based on code analysis, the strategy can be optimized in the following directions:
-
Dynamic Risk Management:
- The current strategy uses fixed points for stop-loss; this could be changed to ATR-based (Average True Range) dynamic stop-losses to better adapt to different market volatilities
- Implementation:
stop_loss = close - (ta.atr(14) * 1.5)
-
Trend Strength Filtering:
- Add trend strength filters, such as the ADX indicator, to only trade in clearly defined trends
- Example:
strong_trend = ta.adx(14) > 25
-
Multi-timeframe Analysis:
- Implement higher timeframe trend confirmation combined with lower timeframe signal generation
- Higher timeframe trend states can be obtained through the
request.securityfunction
-
Entry Timing Optimization:
- Add candlestick pattern confirmation to EMA crossovers
- Consider entering only when price pulls back near the EMA, rather than directly at the crossover point
-
Improved Money Management:
- The current strategy uses fixed proportion (10%) money management; this could be implemented as volatility-based position sizing
- Reduce position sizes in high volatility markets and increase them in low volatility markets
-
Machine Learning Integration:
- Long-term optimization could consider incorporating machine learning algorithms to dynamically optimize EMA and RSI parameters
- Train models using historical data to predict optimal parameter combinations
-
Sentiment Indicator Integration:
- Consider adding market sentiment indicators, such as VIX or volume change rates
- Adjust strategy behavior during extreme sentiment market conditions
Conclusion
The Dynamic EMA Crossover with RSI Trend Confirmation Quantitative Trading Strategy is a clearly structured, logically rigorous technical analysis trading system. By combining the trend-following characteristics of EMAs with the momentum confirmation capabilities of RSI, this strategy can effectively identify market trends and execute trades at appropriate times. The built-in risk management mechanisms give the strategy good risk control capabilities, suitable for traders with different risk preferences.
The strategy's multi-timeframe adaptability makes it applicable to different trading styles, from day trading to swing trading to long-term investment. Through the optimization directions proposed in this article, especially dynamic risk management and multiple confirmation mechanisms, this strategy can further enhance its robustness and adaptability.
However, traders should be mindful of changing market environments when using this strategy, particularly in low-volatility and ranging markets where parameter adjustments or temporary strategy deactivation may be necessary. No strategy performs excellently in all market environments, so combining personal trading style and risk management principles when using and optimizing this strategy is crucial.[/trans]
Source (PineScript)
/*backtest
start: 2024-04-03 00:00:00
end: 2024-11-25 00:00:00
period: 1h
basePeriod: 1h
exchanges: [{"eid":"Futures_Binance","currency":"BTC_USDT"}]
*/

//@version=5
strategy("Estrategia EMA + RSI", overlay=true, default_qty_type=strategy.percent_of_equity, default_qty_value=10)

// Parámetros configurables para las EMAs y el RSI
tf_ema1_length = input(50, title="EMA Corta")  // Período de la EMA rápida
tf_ema2_length = input(200, title="EMA Larga") // Período de la EMA lenta
tf_rsi_length = input(14, title="RSI Periodo") // Período del RSI
tf_rsi_overbought = input(70, title="RSI Sobrecompra") // Umbral de sobrecompra
tf_rsi_oversold = input(30, title="RSI Sobreventa")   // Umbral de sobreventa

// Cálculo de los indicadores técnicos
ema1 = ta.ema(close, tf_ema1_length)  // Cálculo de la EMA rápida
ema2 = ta.ema(close, tf_ema2_length)  // Cálculo de la EMA lenta
rsi = ta.rsi(close, tf_rsi_length)     // Cálculo del RSI

// Verificación de que el marco de tiempo sea válido
valid_timeframe = (timeframe.period == "15") or
                  (timeframe.period == "60") or
                  (timeframe.period == "240") or
                  (timeframe.period == "D")

// Condiciones de entrada para compras y ventas
long_condition = valid_timeframe and ta.crossover(ema1, ema2) and rsi > 50 // Condición para compra
short_condition = valid_timeframe and ta.crossunder(ema1, ema2) and rsi < 50 // Condición para venta

// Configuración de Stop Loss y Take Profit
tf_stop_loss_pips = input(50, title="Stop Loss en Pips") // Valor en pips del Stop Loss
tf_take_profit_ratio = input(2.0, title="Relación TP/SL") // Relación TP/SL (ej. 2:1)

// Cálculo de los niveles de Stop Loss y Take Profit
stop_loss = close - (tf_stop_loss_pips * syminfo.mintick) // Nivel de Stop Loss
take_profit = close + ((tf_stop_loss_pips * tf_take_profit_ratio) * syminfo.mintick) // Nivel de Take Profit

// Ejecución de las órdenes en función de las condiciones
if long_condition
    strategy.entry("Compra", strategy.long)  // Entrada en largo
    strategy.exit("Salida Compra", from_entry="Compra", stop=stop_loss, limit=take_profit) // Salida con SL/TP

if short_condition
    strategy.entry("Venta", strategy.short)  // Entrada en corto
    strategy.exit("Salida Venta", from_entry="Venta", stop=stop_loss, limit=take_profit) // Salida con SL/TP

// Visualización de señales en el gráfico
title_long = "? COMPRA"  // Título para compras
title_short = "? VENTA"  // Título para ventas

// Marcas visuales para las señales de compra y venta
plotshape(series=long_condition, location=location.belowbar, color=color.green, style=shape.labelup, title=title_long)
plotshape(series=short_condition, location=location.abovebar, color=color.red, style=shape.labeldown, title=title_short)

// Gráfica de las EMAs
plot(ema1, color=color.blue, title="EMA 50")  // Línea de la EMA rápida
plot(ema2, color=color.orange, title="EMA 200") // Línea de la EMA lenta
Detail
https://www.fmz.com/strategy/489332
Last Modified
2025-04-03 15:05:58