
9.8 KiB
Name
动态唐奇安通道与简单移动平均线结合的量化策略-Dynamic-Donchian-Channel-and-Simple-Moving-Average-Combination-Quantitative-Strategy
Author
ChaoZhang
Strategy Description
 [trans]
概述
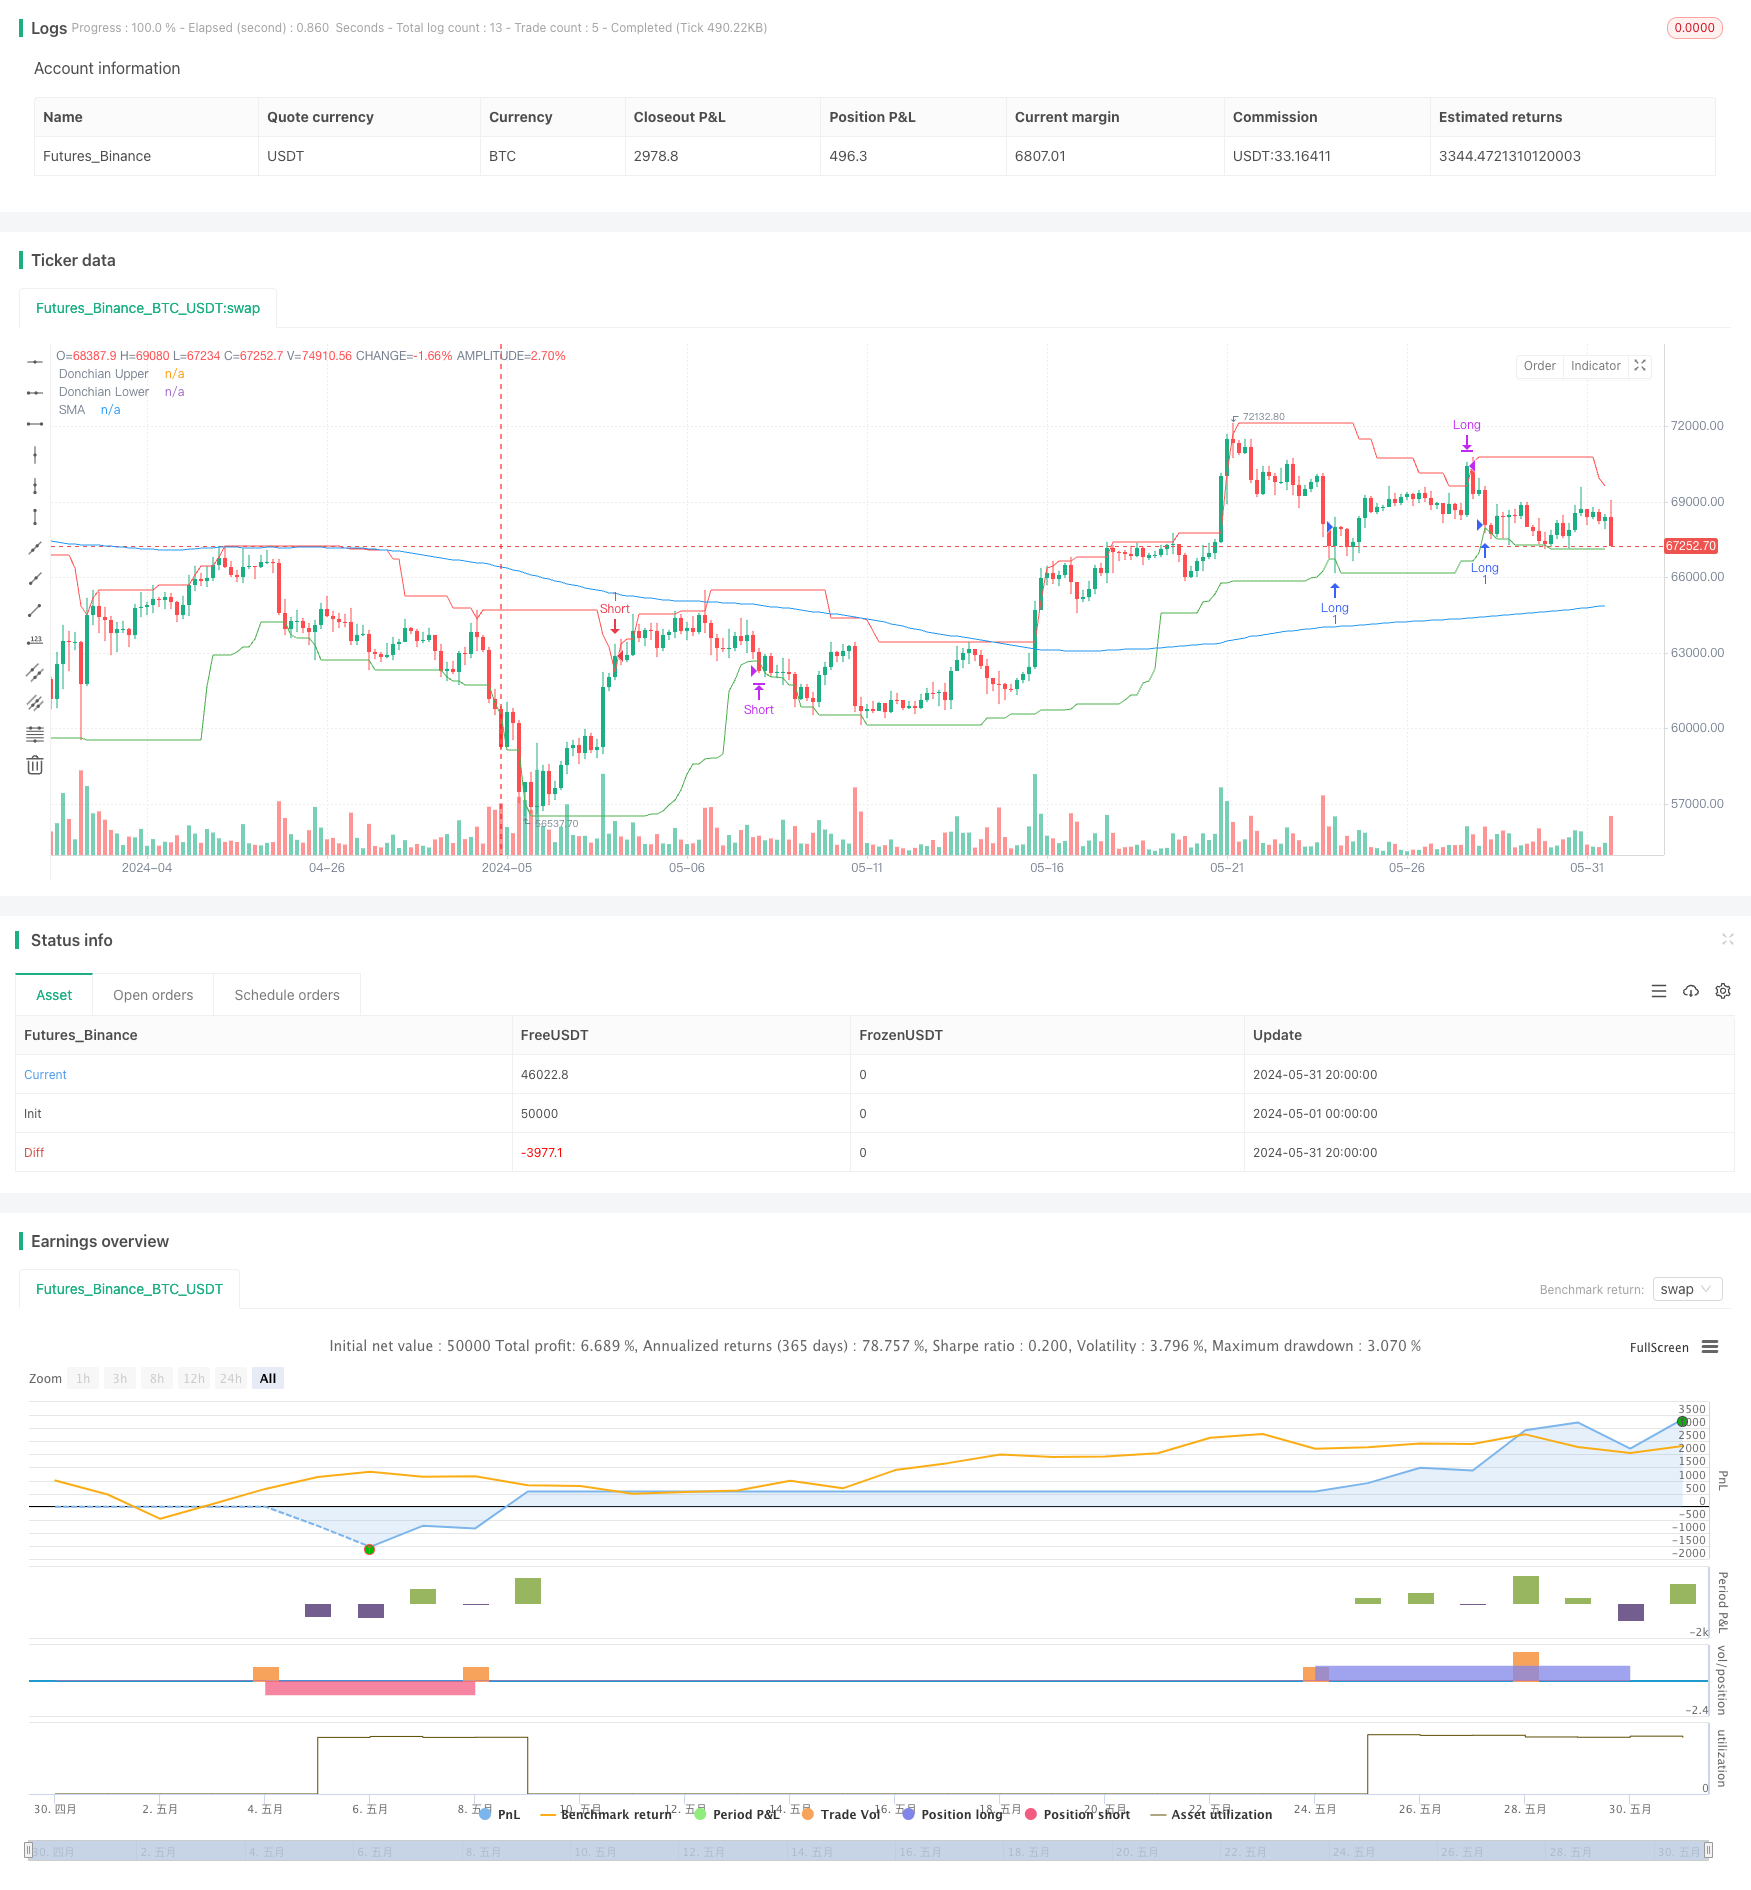
该策略结合了唐奇安通道和简单移动平均线两个技术指标。当价格突破唐奇安通道下轨且高于简单移动平均线时开多仓,当价格突破唐奇安通道上轨且低于简单移动平均线时开空仓。多头仓位在价格触及唐奇安通道上轨时平仓,空头仓位在价格触及唐奇安通道下轨时平仓。该策略适用于趋势性较强的市场。
策略原理
- 计算唐奇安通道上下轨。唐奇安通道上轨为过去n个周期的最高价,下轨为过去n个周期的最低价。
- 计算简单移动平均线。简单移动平均线为收盘价在过去m个周期的算术平均值。
- 多头开仓:当价格低于唐奇安通道下轨且收盘价高于简单移动平均线时,开多仓。
- 空头开仓:当价格高于唐奇安通道上轨且收盘价低于简单移动平均线时,开空仓。
- 多头平仓:当价格触及唐奇安通道上轨时,平多仓。
- 空头平仓:当价格触及唐奇安通道下轨时,平空仓。
策略优势
- 结合趋势和波动两个市场要素。简单移动平均线捕捉趋势,唐奇安通道捕捉波动,能较好把握趋势行情中的回撤机会。
- 止盈条件明确,有助于及时锁定利润。多头和空头分别在价格触及唐奇安通道上轨和下轨时平仓,能在趋势反转前及时了结盈利头寸。
- 参数较少,优化难度小。该策略仅有唐奇安通道周期、偏移量和简单移动平均线周期三个参数,便于进行优化。
策略风险
- 频繁交易。该策略开平仓频率较高,在交易成本高昂的市场会拖累收益。可通过适度放宽开仓条件或增加时间框来减少交易次数。
- 震荡市表现不佳。趋势不明朗时,该策略可能遭遇较多亏损。可通过统计波动率指标来识别震荡市,暂停策略。
- 参数稳定性不足。不同标的和周期,最优参数可能差异较大,参数稳定性欠佳,实盘表现可能不及回测。需进行充分样本外测试和敏感性分析,确认参数稳健。
策略优化方向
- 加入和其它指标结合的可选开仓条件,例如要求DMI中的ADX大于某阈值才允许开仓,或RSI离开超卖区时才开多仓,提高开仓胜率。
- 使用动态止盈线取代固定的唐奇安通道线止盈,从而实现利润追踪功能。例如多头可在价格触及唐奇安通道上轨后,改为在ATR止盈线或SAR止盈线上平仓。
- 根据波动率水平动态调整唐奇安通道周期,在高波动率市场状态下缩短唐奇安通道周期,低波动率市场状态下展长周期。这有助于适应不同市场。
总结
动态唐奇安通道与简单移动平均线结合策略是一个简单易用的量化交易策略框架。它从趋势跟踪和波动性突破两个角度构建开平仓逻辑,适合趋势性较强的品种。但该策略在频繁震荡的市场中表现不佳,且参数稳健性一般。可通过引入辅助开仓条件、动态止盈和参数自适应机制来提高该策略的适应性和鲁棒性。总的来说,该策略可作为一个基础策略框架,在此基础上进一步修改完善,打造出更高级的量化策略。
||
Overview
This strategy combines two technical indicators: Donchian Channel and Simple Moving Average (SMA). It opens a long position when the price breaks below the lower band of the Donchian Channel and closes above the SMA. Conversely, it opens a short position when the price breaks above the upper band of the Donchian Channel and closes below the SMA. The long position is closed when the price reaches the upper band of the Donchian Channel, while the short position is closed when the price reaches the lower band. This strategy is suitable for markets with strong trends.
Strategy Principle
- Calculate the upper and lower bands of the Donchian Channel. The upper band is the highest high over the past n periods, and the lower band is the lowest low over the past n periods.
- Calculate the Simple Moving Average. The SMA is the arithmetic mean of the closing prices over the past m periods.
- Long entry: Open a long position when the price is below the lower band of the Donchian Channel and the closing price is above the SMA.
- Short entry: Open a short position when the price is above the upper band of the Donchian Channel and the closing price is below the SMA.
- Long exit: Close the long position when the price reaches the upper band of the Donchian Channel.
- Short exit: Close the short position when the price reaches the lower band of the Donchian Channel.
Strategy Advantages
- Combines two market elements: trend and volatility. The SMA captures the trend, while the Donchian Channel captures the volatility, enabling the strategy to seize pullback opportunities in trending markets.
- Clear profit-taking conditions help lock in profits in a timely manner. Long and short positions are closed when the price reaches the upper and lower bands of the Donchian Channel, respectively, allowing the strategy to exit profitable trades before the trend reverses.
- Few parameters make optimization easier. The strategy only has three parameters: Donchian Channel period, offset, and SMA period, which simplifies optimization.
Strategy Risks
- Frequent trading. The strategy has a high frequency of position entries and exits, which can erode returns in markets with high trading costs. This can be mitigated by moderately relaxing entry conditions or increasing the timeframe.
- Poor performance in rangebound markets. The strategy may suffer more losses when the trend is unclear. Volatility indicators can be used to identify rangebound markets and suspend the strategy.
- Insufficient parameter stability. The optimal parameters may vary significantly across different instruments and timeframes, indicating poor parameter stability. The live performance may not match the backtest. Extensive out-of-sample testing and sensitivity analysis are needed to confirm parameter robustness.
Strategy Optimization Directions
- Add optional entry conditions combined with other indicators. For example, require the ADX of the DMI to be above a certain threshold for entry, or only enter long when the RSI leaves the oversold zone. This can improve the win rate of entries.
- Use dynamic profit-taking lines instead of fixed Donchian Channel lines to achieve a profit-trailing function. For example, after the price reaches the upper band of the Donchian Channel for a long position, switch to closing the position at the ATR stop-loss line or the SAR stop-loss line.
- Dynamically adjust the Donchian Channel period based on volatility levels. Shorten the Donchian Channel period in high-volatility market conditions and lengthen the period in low-volatility conditions. This helps adapt to different markets.
Summary
The Dynamic Donchian Channel and Simple Moving Average Combination Strategy is a simple and easy-to-use quantitative trading strategy framework. It constructs entry and exit logic from the perspectives of trend following and volatility breakout, making it suitable for instruments with strong trends. However, the strategy performs poorly in frequently rangebound markets, and its parameter robustness is mediocre. The adaptability and robustness of the strategy can be improved by introducing auxiliary entry conditions, dynamic profit-taking, and parameter self-adaptation mechanisms. Overall, this strategy can serve as a basic strategy framework to be further modified and improved upon to create more advanced quantitative strategies.
[/trans]
Source (PineScript)
/*backtest
start: 2024-05-01 00:00:00
end: 2024-05-31 23:59:59
period: 4h
basePeriod: 15m
exchanges: [{"eid":"Futures_Binance","currency":"BTC_USDT"}]
*/

//@version=5
strategy("FBK Donchian Channel Strategy", overlay=true)

// Inputs
donchian_period = input.int(20, title="Donchian Channel Period")
donchian_offset = input.int(1, title="Donchian Channel Offset")
sma_period = input.int(200, title="SMA Period")
start_date = input(timestamp("2023-01-01 00:00 +0000"), title="Start Date")
end_date = input(timestamp("2023-12-31 23:59 +0000"), title="End Date")
trade_type = input.string("Both", title="Trade Type", options=["Buy Only", "Sell Only", "Both"])

// Calculate indicators
donchian_upper = ta.highest(high, donchian_period)[donchian_offset]
donchian_lower = ta.lowest(low, donchian_period)[donchian_offset]
sma = ta.sma(close, sma_period)

// Plot indicators
plot(donchian_upper, color=color.red, title="Donchian Upper")
plot(donchian_lower, color=color.green, title="Donchian Lower")
plot(sma, color=color.blue, title="SMA")

// Helper function to check if within testing period
is_in_testing_period() => true

// Entry conditions
long_condition = low <= donchian_lower and close > sma
short_condition = high >= donchian_upper and close < sma

// Exit conditions
exit_long_condition = high >= donchian_upper
exit_short_condition = low <= donchian_lower

// Open long position
if (is_in_testing_period() and (trade_type == "Buy Only" or trade_type == "Both") and long_condition)
    strategy.entry("Long", strategy.long)

// Close long position
if (is_in_testing_period() and exit_long_condition)
    strategy.close("Long")

// Open short position
if (is_in_testing_period() and (trade_type == "Sell Only" or trade_type == "Both") and short_condition)
    strategy.entry("Short", strategy.short)

// Close short position
if (is_in_testing_period() and exit_short_condition)
    strategy.close("Short")

// Close all positions at the end of the testing period
if not is_in_testing_period()
    strategy.close_all()
Detail
https://www.fmz.com/strategy/454371
Last Modified
2024-06-17 17:29:48