
9.3 KiB
Name
优化的基于平均真实波动范围的趋势策略v6固定趋势捕捉-Optimized-ATR-Based-Trend-Strategy-v6-Fixed-Trend-Capture
Author
ianzeng123
Strategy Description
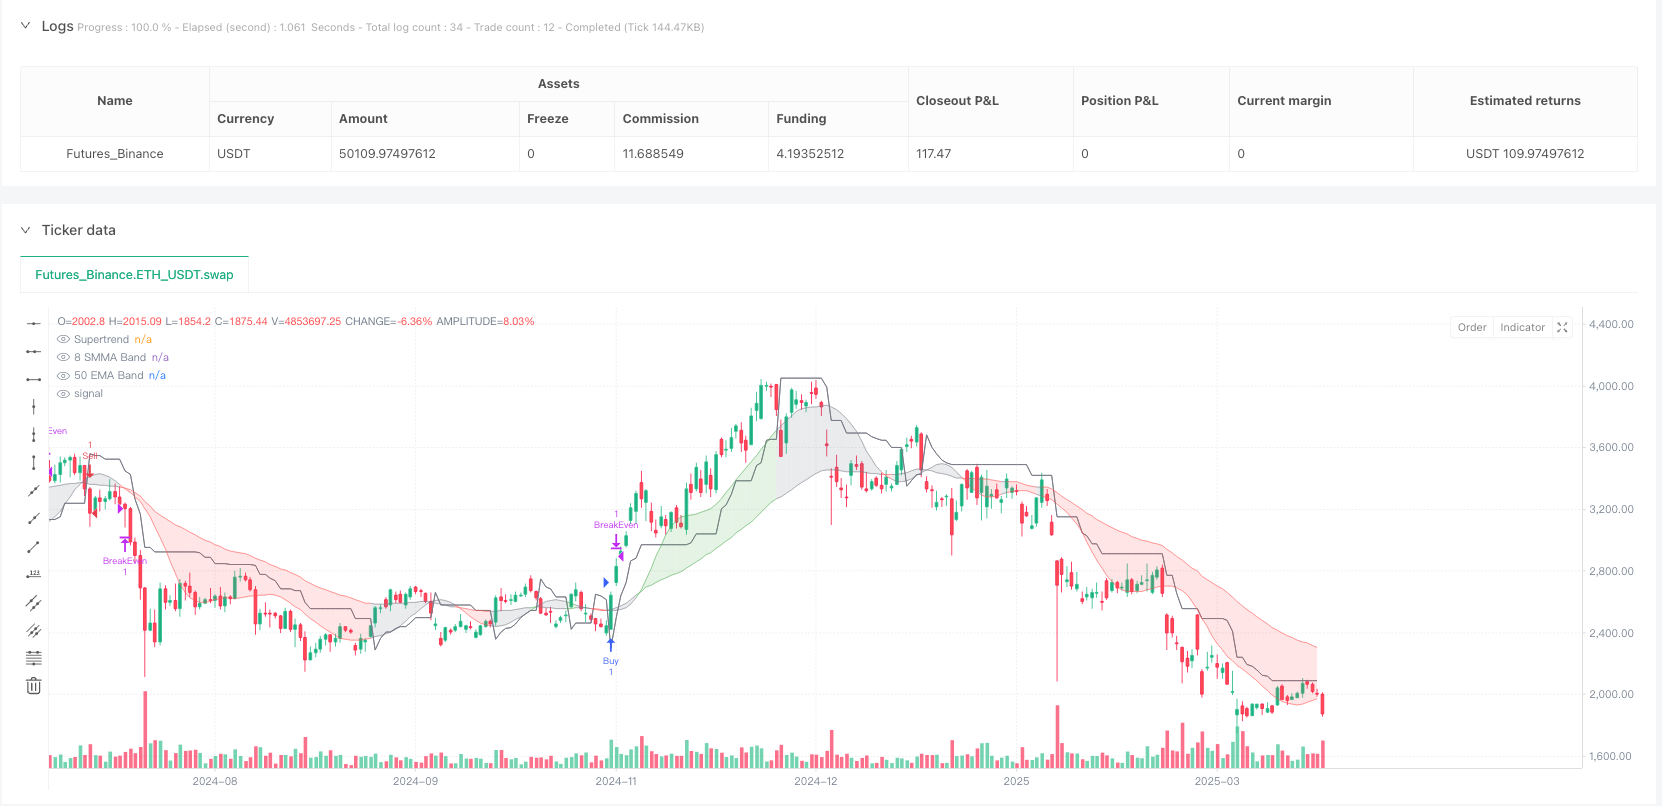
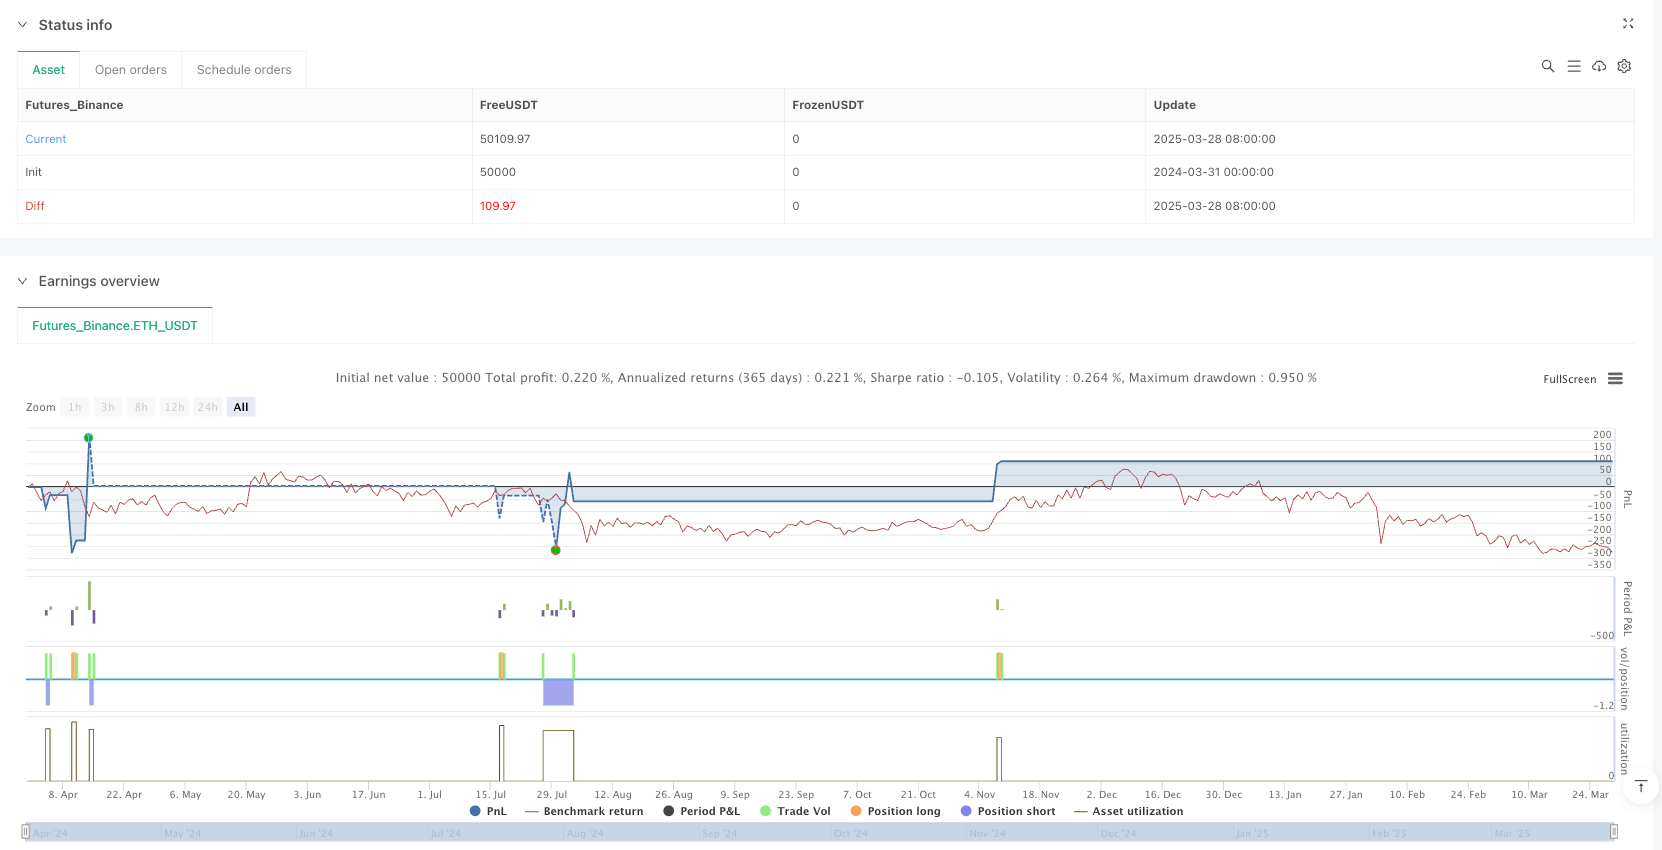
[trans]
概述
这是一种基于平均真实范围(ATR)的趋势跟踪策略,旨在通过结合多种技术指标来捕捉高概率交易。该策略融合了ATR过滤、超级趋势指标、指数移动平均线(EMA)和简单移动平均线(SMMA)趋势带、相对强弱指数(RSI)确认以及动态止损系统,旨在提供一个全面且灵活的交易方法。
策略原理
策略的核心原理基于多重技术指标的协同作用:
-
趋势识别:使用超级趋势指标(参数:因子2,长度5)和50日EMA与8日SMMA趋势带来定义市场趋势方向。趋势以颜色编码:
- 绿色:看涨趋势
- 红色:看跌趋势
- 灰色:中性阶段
-
ATR智能过滤:通过14周期ATR和50周期简单移动平均线检测波动性扩张,仅在ATR上升或高于其SMA 101%时进行交易,确保仅在强势趋势中入场。
-
入场条件:
- 做多入场:价格高于50日EMA,超级趋势看涨,RSI > 45,ATR确认趋势强度
- 做空入场:价格低于50日EMA,超级趋势看跌,RSI < 45,ATR确认趋势强度
-
动态止损与止盈:
- 止盈:基于5倍ATR的自适应止盈
- 止损:3.5倍ATR的跟踪止损
- 保本止损:价格移动2倍ATR后启动
- 固定止损:使用0.8倍ATR乘数进行风险管理
策略优势
- 有效过滤波动市场,避免在低波动区域交易
- 防止过度交易,通过止盈锁定机制避免过早重新入场
- 捕捉强势趋势,跟踪止损允许盈利持续
- 降低回撤,ATR基础止损防止大额损失
- 参数可调,可针对不同市场微调ATR乘数、止损、止盈和RSI过滤器
策略风险
- 过度依赖技术指标可能导致假信号
- 在震荡市场中可能表现不佳
- 参数设置不当可能增加交易成本
- RSI确认可能错过快速趋势变化
策略优化方向
- 引入机器学习算法,动态调整参数
- 增加额外过滤器,如成交量确认
- 探索不同市场和时间框架的最优参数组合
- 开发多时间框架验证机制
总结
这是一种先进的趋势跟踪策略,通过多指标协同和动态风险管理,为交易者提供了一个灵活且强大的交易工具。持续的回测和优化是成功应用此策略的关键。
|| #### Overview
This is an Average True Range (ATR)-based trend-following strategy designed to capture high-probability trades by combining multiple technical indicators. The strategy integrates ATR filtering, Supertrend indicator, Exponential Moving Average (EMA) and Simple Moving Average (SMMA) trend bands, Relative Strength Index (RSI) confirmation, and a dynamic stop-loss system, aiming to provide a comprehensive and flexible trading approach.
Strategy Principles
The core principle is based on the synergistic action of multiple technical indicators:
-
Trend Identification: Using Supertrend indicator (parameters: factor 2, length 5) and 50-day EMA with 8-day SMMA trend bands to define market trend direction. Trends are color-coded:
- Green: Bullish trend
- Red: Bearish trend
- Gray: Neutral phase
-
ATR Smart Filtering: Detecting volatility expansion through 14-period ATR and 50-period Simple Moving Average, trading only when ATR is rising or above 101% of its SMA, ensuring entries only in strong trends.
-
Entry Conditions:
- Long Entry: Price above 50-day EMA, Supertrend bullish, RSI > 45, ATR confirms trend strength
- Short Entry: Price below 50-day EMA, Supertrend bearish, RSI < 45, ATR confirms trend strength
-
Dynamic Stop-Loss and Take-Profit:
- Take-Profit: Adaptive based on 5x ATR
- Stop-Loss: Trailing stop-loss at 3.5x ATR
- Break-Even Stop: Activated after price moves 2x ATR
- Fixed Stop-Loss: Risk management using 0.8x ATR multiplier
Strategy Advantages
- Effectively filter volatile markets, avoiding trading in low volatility zones
- Prevent over-trading through take-profit lock mechanism
- Capture strong trends, allowing profits to run with trailing stop-loss
- Reduce drawdowns with ATR-based stop-loss
- Adjustable parameters for fine-tuning across different markets
Strategy Risks
- Over-reliance on technical indicators may lead to false signals
- Potential poor performance in ranging markets
- Improper parameter settings may increase trading costs
- RSI confirmation might miss rapid trend changes
Strategy Optimization Directions
- Integrate machine learning algorithms for dynamic parameter adjustment
- Add additional filters like volume confirmation
- Explore optimal parameter combinations across different markets and timeframes
- Develop multi-timeframe verification mechanisms
Conclusion
This is an advanced trend-following strategy that provides traders with a flexible and powerful trading tool through multi-indicator synergy and dynamic risk management. Continuous backtesting and optimization are key to successful application.[/trans]
Source (PineScript)
/*backtest
start: 2024-03-31 00:00:00
end: 2025-03-29 08:00:00
period: 1d
basePeriod: 1d
exchanges: [{"eid":"Futures_Binance","currency":"ETH_USDT"}]
*/

//@version=6
strategy("Optimized ATR-Based Trend Strategy v6 (Fixed Trend Capture)", overlay=true)

// ? Input parameters
lengthSMMA = input(8, title="SMMA Length")
lengthEMA = input(50, title="EMA Length")
supertrendFactor = input(2.0, title="Supertrend Factor")
supertrendLength = input(5, title="Supertrend Length")
atrLength = input(14, title="ATR Length")
atrSmoothing = input(50, title="ATR Moving Average Length")
atrMultiplierTP = input.float(5.0, title="ATR Multiplier for Take-Profit", minval=1.0, step=0.5)
atrMultiplierTSL = input.float(3.5, title="ATR Multiplier for Trailing Stop-Loss", minval=1.0, step=0.5)  // ? Increased to ride trends
atrStopMultiplier = input.float(0.8, title="ATR Stop Multiplier", minval=0.5, step=0.1)
breakEvenMultiplier = input.float(2.0, title="Break-Even Trigger ATR Multiplier", minval=1.0, step=0.1)
rsiLength = input(14, title="RSI Length")

// ? Indicator calculations
smma8 = ta.sma(ta.sma(close, lengthSMMA), lengthSMMA)
ema50 = ta.ema(close, lengthEMA)

// ? Supertrend Calculation
[superTrend, _] = ta.supertrend(supertrendFactor, supertrendLength)

// ? Supertrend Conditions
isBullishSupertrend = close > superTrend
isBearishSupertrend = close < superTrend

// ? ATR Calculation for Smarter Filtering
atrValue = ta.atr(atrLength)
atrMA = ta.sma(atrValue, atrSmoothing)
atrRising = ta.rising(atrValue, 3)  // ? More sensitive ATR detection
isTrending = atrValue > atrMA * 1.01 or atrRising  // ? Loosened ATR filter

// ? RSI Calculation
rsi = ta.rsi(close, rsiLength)

// ? RSI Conditions (More Flexible)
isRSIBullish = rsi > 45  // ? Lowered to capture early trends
isRSIBearish = rsi < 45

// ? TP Lock Mechanism
var bool tpHit = false
if strategy.position_size == 0 and strategy.closedtrades > 0
    tpHit := true

// ? Supertrend Flip Detection (Resumes Trading After Trend Change)
trendFlip = (isBullishSupertrend and not isBullishSupertrend[1]) or (isBearishSupertrend and not isBearishSupertrend[1])
if trendFlip
    tpHit := false

// ? Entry Conditions
bullishEntry = close > ema50 and isBullishSupertrend and isRSIBullish and isTrending and not tpHit
bearishEntry = close < ema50 and isBearishSupertrend and isRSIBearish and isTrending and not tpHit

// ? Dynamic Take-Profit, Stop-Loss, and Break-Even Stop
longTakeProfit = close + (atrValue * atrMultiplierTP)
shortTakeProfit = close - (atrValue * atrMultiplierTP)
longTrailStop = atrValue * atrMultiplierTSL
shortTrailStop = atrValue * atrMultiplierTSL

// ✅ Adjusted SL to Reduce Drawdown
longStopLoss = close - (atrValue * atrMultiplierTSL * atrStopMultiplier)
shortStopLoss = close + (atrValue * atrMultiplierTSL * atrStopMultiplier)

// ✅ Break-Even Stop Trigger (More Room for Trends)
longBreakEven = strategy.position_avg_price + (atrValue * breakEvenMultiplier)
shortBreakEven = strategy.position_avg_price - (atrValue * breakEvenMultiplier)

// ? Strategy Execution (Fixed Take-Profit & Stop-Loss)
if (bullishEntry)
    strategy.entry("Buy", strategy.long)
    strategy.exit("TSL/TP", from_entry="Buy", stop=longStopLoss, trail_offset=longTrailStop, limit=longTakeProfit)
    strategy.exit("BreakEven", from_entry="Buy", stop=longBreakEven)

if (bearishEntry)
    strategy.entry("Sell", strategy.short)
    strategy.exit("TSL/TP", from_entry="Sell", stop=shortStopLoss, trail_offset=shortTrailStop, limit=shortTakeProfit)
    strategy.exit("BreakEven", from_entry="Sell", stop=shortBreakEven)

// ? Trend Band
trendColor = isBullishSupertrend and smma8 > ema50 and close > ema50 ? color.green :
             isBearishSupertrend and smma8 < ema50 and close < ema50 ? color.red : color.gray
fill(plot(smma8, color=color.new(trendColor, 60), title="8 SMMA Band"),
     plot(ema50, color=color.new(trendColor, 60), title="50 EMA Band"),
     color=color.new(trendColor, 80), title="Trend Band")

// ? Supertrend Line
plot(superTrend, color=color.gray, title="Supertrend", style=plot.style_line)
Detail
https://www.fmz.com/strategy/488901
Last Modified
2025-03-31 16:50:41