
11 KiB
Name
三重超趋势与布林带融合的多指标趋势跟踪策略-Triple-Supertrend-and-Bollinger-Bands-Multi-Indicator-Trend-Following-Strategy
Author
ChaoZhang
Strategy Description
[trans]
概述
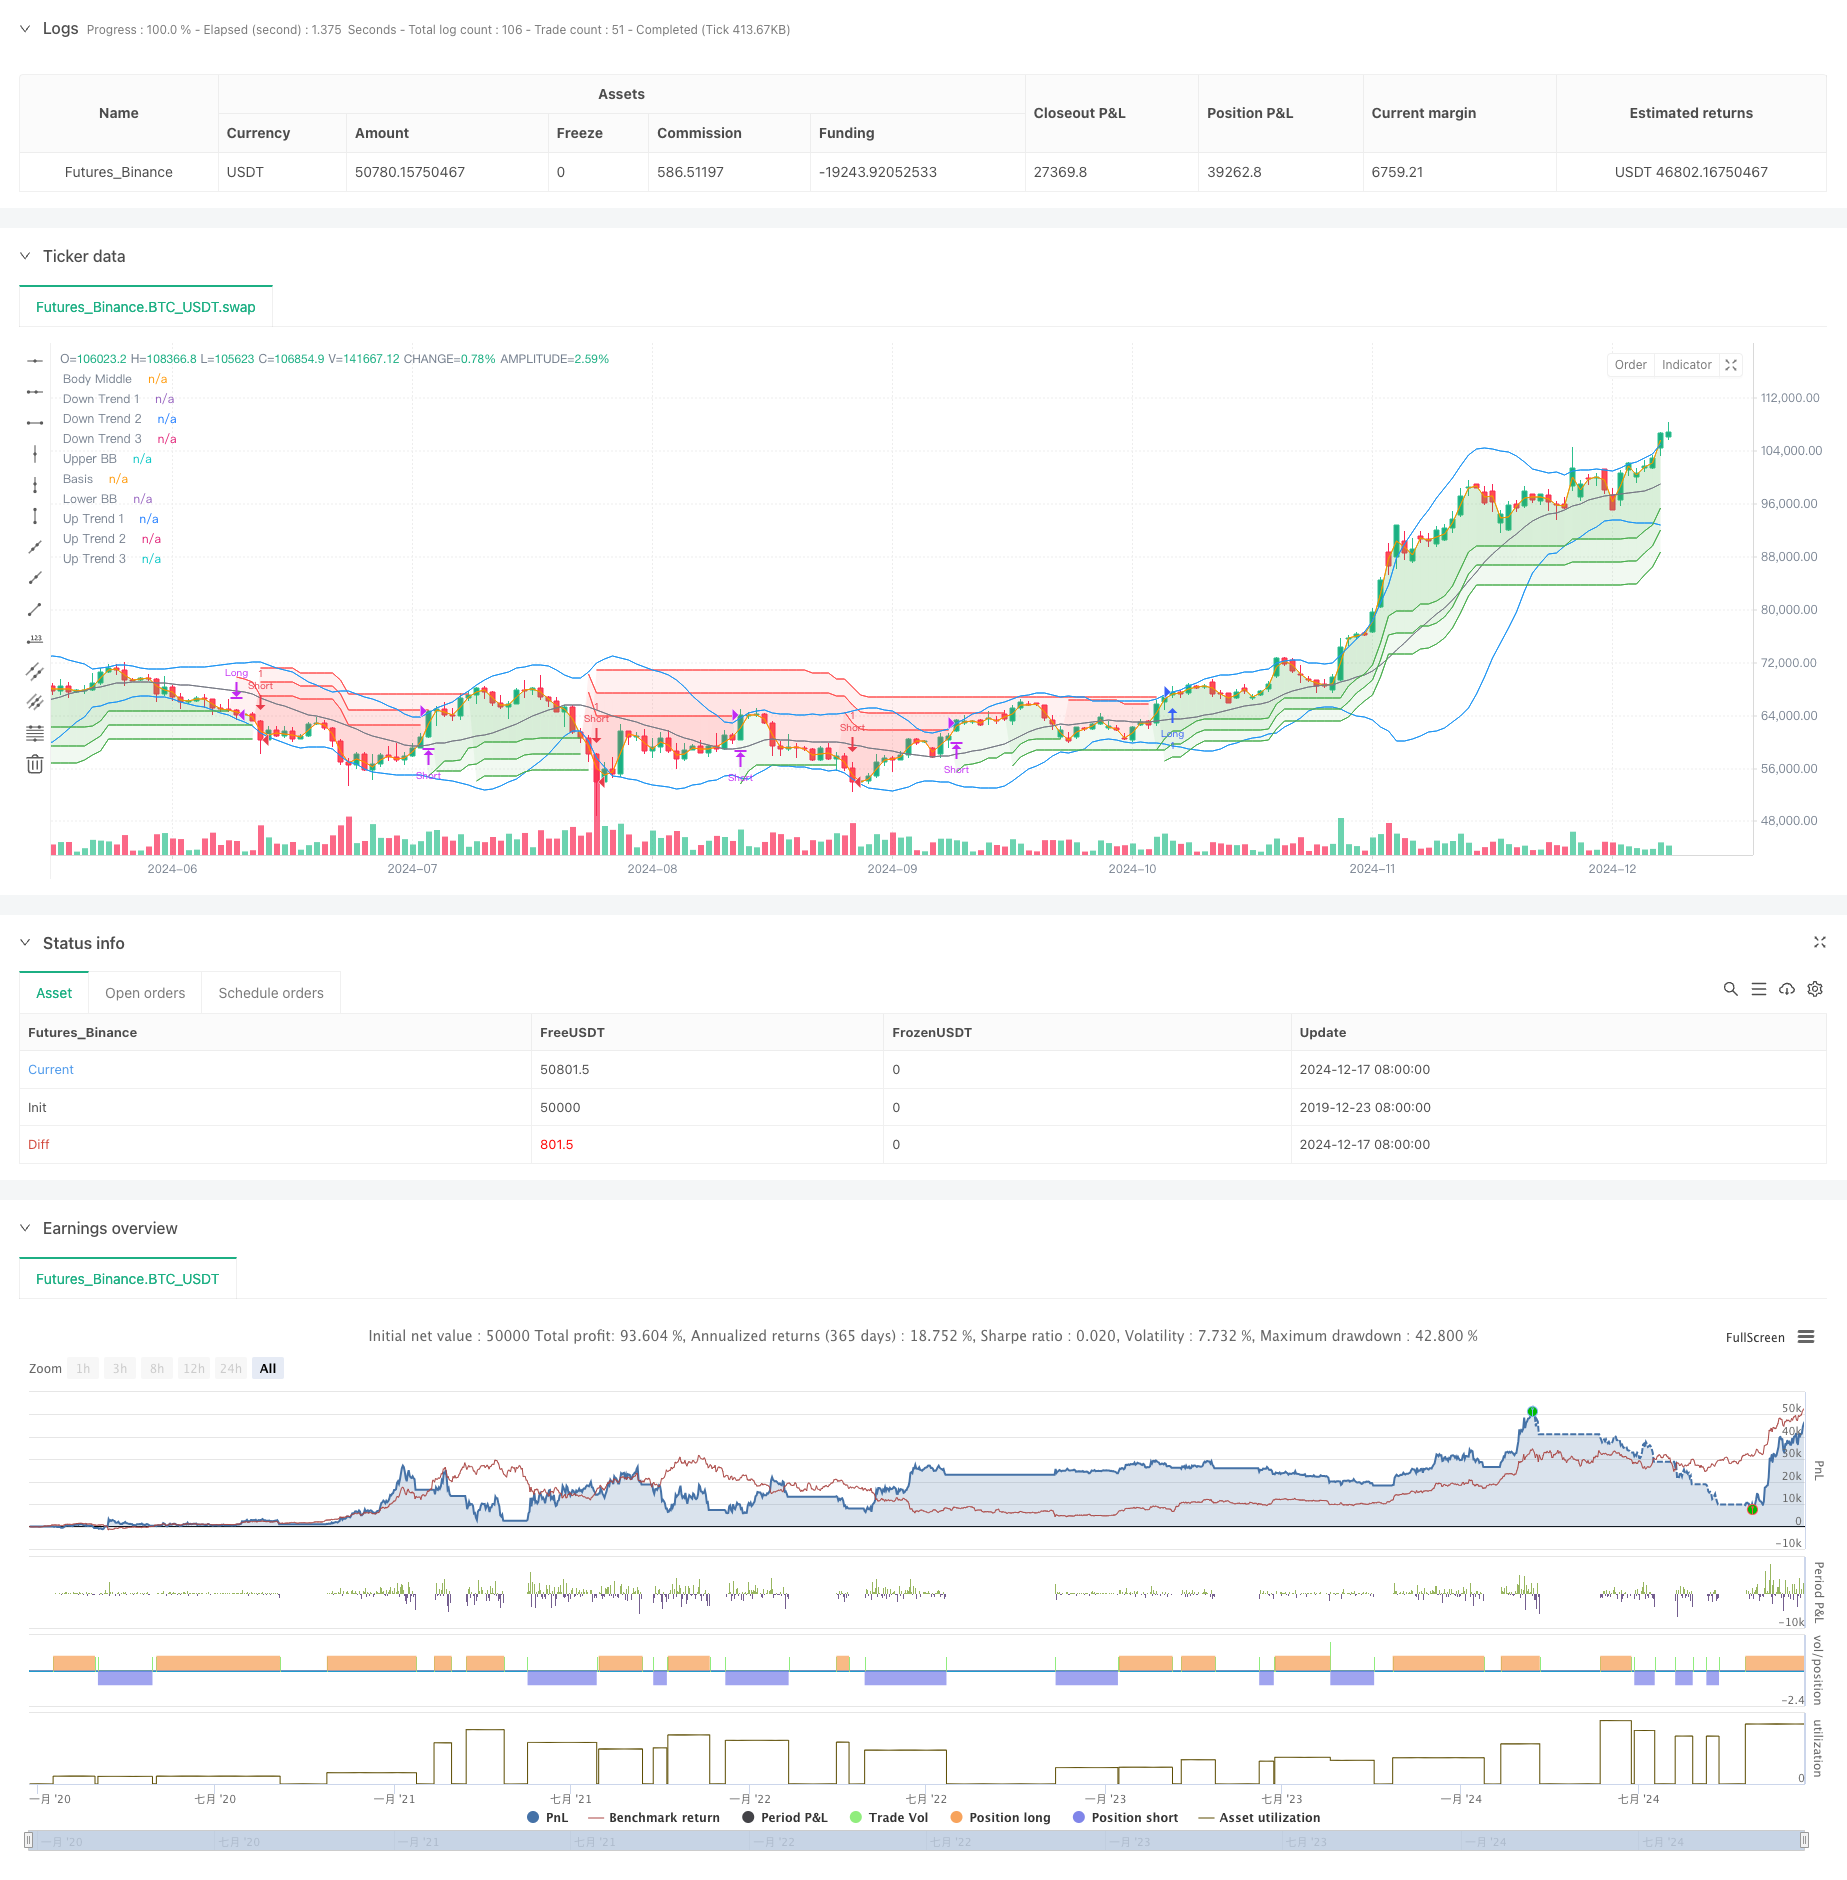
本策略采用布林带和三重超趋势指标相结合的方法进行交易。通过布林带的波动区间判断和三重超趋势的趋势确认,形成了一个稳健的趋势跟踪系统。布林带用于识别价格的极端波动,而三重超趋势则通过不同参数设置提供趋势方向的多重确认。当所有信号一致时才进行交易,以此降低虚假信号的风险。这种组合方法既保留了趋势跟踪的优势,又增加了交易的可靠性。
策略原理
策略的核心逻辑包含以下几个关键部分:
- 使用20周期的布林带,标准差倍数为2.0,用于判断价格波动
- 设置三条超趋势线,周期分别为10,参数分别为3.0、4.0和5.0
- 多头入场条件:价格突破布林带上轨且三条超趋势线都显示上涨趋势
- 空头入场条件:价格跌破布林带下轨且三条超趋势线都显示下跌趋势
- 当任意一条超趋势线改变方向时,平仓当前持仓
- 使用中间价格线作为填充参考,增强视觉效果
策略优势
- 多重确认机制:通过布林带和三重超趋势的组合,大大降低了虚假信号
- 趋势跟踪能力强:超趋势指标的递进参数设置,能够有效捕捉不同级别的趋势
- 风险控制完善:当趋势出现转折迹象时快速平仓,控制回撤
- 参数可调性强:各项指标参数均可根据不同市场特征进行优化
- 自动化程度高:策略逻辑清晰,便于系统化实现
策略风险
- 震荡市场风险:在横盘震荡市场可能频繁产生假突破信号
- 滑点影响:在剧烈波动时期,可能面临较大的滑点损失
- 延迟风险:多重确认机制可能导致入场时机偏晚
- 参数敏感性:不同参数组合可能导致策略表现差异较大
- 市场环境依赖:策略在趋势明显的市场表现更好
策略优化方向
- 引入成交量指标:通过成交量确认价格突破的有效性
- 优化止损机制:可以添加移动止损或基于ATR的动态止损
- 增加时间过滤:在特定时间段禁止交易,避免低效波动
- 加入波动率过滤:在过度波动时期调整仓位或暂停交易
- 开发参数自适应机制:根据市场状态动态调整参数
总结
这是一个结合布林带和三重超趋势的趋势跟踪策略,通过多重技术指标的确认来提高交易的可靠性。策略具有较强的趋势捕捉能力和风险控制能力,但也需要注意市场环境对策略表现的影响。通过持续优化和完善,策略有望在不同市场条件下都能保持稳定的表现。建议在实盘交易前进行充分的回测和参数优化,并结合市场实际情况进行适当的调整。 ||
Overview
This strategy combines Bollinger Bands with Triple Supertrend indicators for trading. It creates a robust trend-following system by utilizing Bollinger Bands for volatility range assessment and Triple Supertrend for trend confirmation. The Bollinger Bands identify extreme price movements, while the Triple Supertrend provides multiple confirmations of trend direction through different parameter settings. Trades are executed only when all signals align, reducing the risk of false signals. This combination maintains the advantages of trend following while enhancing trading reliability.
Strategy Principles
The core logic includes the following key components:
- Uses 20-period Bollinger Bands with 2.0 standard deviation multiplier for volatility judgment
- Implements three Supertrend lines with period 10 and factors 3.0, 4.0, and 5.0
- Long entry conditions: price breaks above upper Bollinger Band and all three Supertrend lines show uptrend
- Short entry conditions: price breaks below lower Bollinger Band and all three Supertrend lines show downtrend
- Positions are closed when any Supertrend line changes direction
- Uses middle price line as fill reference for enhanced visualization
Strategy Advantages
- Multiple confirmation mechanism: Combination of Bollinger Bands and Triple Supertrend significantly reduces false signals
- Strong trend-following capability: Progressive Supertrend parameters effectively capture trends at different levels
- Comprehensive risk control: Quick position closure when trend reversal signs appear
- High parameter adaptability: All indicator parameters can be optimized for different market characteristics
- High automation level: Clear strategy logic facilitates systematic implementation
Strategy Risks
- Choppy market risk: May generate frequent false breakout signals in sideways markets
- Slippage impact: May face significant slippage losses during volatile periods
- Delay risk: Multiple confirmation mechanism may lead to delayed entries
- Parameter sensitivity: Different parameter combinations may result in varying strategy performance
- Market environment dependence: Strategy performs better in trending markets
Strategy Optimization Directions
- Incorporate volume indicators: Confirm price breakout validity through volume analysis
- Optimize stop-loss mechanism: Add trailing stops or ATR-based dynamic stops
- Add time filters: Restrict trading during specific periods to avoid inefficient volatility
- Implement volatility filters: Adjust position sizes or pause trading during excessive volatility
- Develop parameter adaptation mechanism: Dynamically adjust parameters based on market conditions
Summary
This is a trend-following strategy combining Bollinger Bands and Triple Supertrend, enhancing trading reliability through multiple technical indicator confirmations. The strategy demonstrates strong trend capture capability and risk control, but market conditions significantly impact its performance. Through continuous optimization and refinement, the strategy can maintain stable performance across different market conditions. It is recommended to conduct thorough backtesting and parameter optimization before live trading, and make appropriate adjustments based on actual market conditions.[/trans]
Source (PineScript)
//@version=5
strategy("Demo GPT - Bollinger + Triple Supertrend Combo", overlay=true, commission_type=strategy.commission.percent, commission_value=0.1, slippage=3)

// -------------------------------
// User Input for Date Range
// -------------------------------
startDate = input(title="Start Date", defval=timestamp("2018-01-01 00:00:00"))
endDate   = input(title="End Date",   defval=timestamp("2069-12-31 23:59:59"))

// -------------------------------
// Bollinger Band Inputs
// -------------------------------
lengthBB = input.int(20, "Bollinger Length")
multBB   = input.float(2.0, "Bollinger Multiplier")

// -------------------------------
// Supertrend Inputs for 3 lines
// -------------------------------
// Line 1
atrPeriod1 = input.int(10, "ATR Length (Line 1)", minval = 1)
factor1    = input.float(3.0, "Factor (Line 1)", minval = 0.01, step = 0.01)

// Line 2
atrPeriod2 = input.int(10, "ATR Length (Line 2)", minval = 1)
factor2    = input.float(4.0, "Factor (Line 2)", minval = 0.01, step = 0.01)

// Line 3
atrPeriod3 = input.int(10, "ATR Length (Line 3)", minval = 1)
factor3    = input.float(5.0, "Factor (Line 3)", minval = 0.01, step = 0.01)

// -------------------------------
// Bollinger Band Calculation
// -------------------------------
basis = ta.sma(close, lengthBB)
dev   = multBB * ta.stdev(close, lengthBB)
upperBand = basis + dev
lowerBand = basis - dev

// Plot Bollinger Bands
plot(upperBand, "Upper BB", color=color.new(color.blue, 0))
plot(basis,     "Basis",    color=color.new(color.gray, 0))
plot(lowerBand, "Lower BB", color=color.new(color.blue, 0))

// -------------------------------
// Supertrend Calculation Line 1
// -------------------------------
[supertrendLine1, direction1] = ta.supertrend(factor1, atrPeriod1)
supertrendLine1 := barstate.isfirst ? na : supertrendLine1

upTrend1   = plot(direction1 < 0 ? supertrendLine1 : na, "Up Trend 1",   color = color.green, style = plot.style_linebr)
downTrend1 = plot(direction1 < 0 ? na : supertrendLine1, "Down Trend 1", color = color.red,   style = plot.style_linebr)

// -------------------------------
// Supertrend Calculation Line 2
// -------------------------------
[supertrendLine2, direction2] = ta.supertrend(factor2, atrPeriod2)
supertrendLine2 := barstate.isfirst ? na : supertrendLine2

upTrend2   = plot(direction2 < 0 ? supertrendLine2 : na, "Up Trend 2",   color = color.new(color.green, 0), style = plot.style_linebr)
downTrend2 = plot(direction2 < 0 ? na : supertrendLine2, "Down Trend 2", color = color.new(color.red, 0),   style = plot.style_linebr)

// -------------------------------
// Supertrend Calculation Line 3
// -------------------------------
[supertrendLine3, direction3] = ta.supertrend(factor3, atrPeriod3)
supertrendLine3 := barstate.isfirst ? na : supertrendLine3

upTrend3   = plot(direction3 < 0 ? supertrendLine3 : na, "Up Trend 3",   color = color.new(color.green, 0), style = plot.style_linebr)
downTrend3 = plot(direction3 < 0 ? na : supertrendLine3, "Down Trend 3", color = color.new(color.red, 0),   style = plot.style_linebr)

// -------------------------------
// Middle line for fill (used as a reference line)
// -------------------------------
bodyMiddle = plot(barstate.isfirst ? na : (open + close) / 2, "Body Middle", display = display.none)

// Fill areas for each supertrend line
fill(bodyMiddle, upTrend1,   color.new(color.green, 90), fillgaps = false)
fill(bodyMiddle, downTrend1, color.new(color.red,   90), fillgaps = false)

fill(bodyMiddle, upTrend2,   color.new(color.green, 90), fillgaps = false)
fill(bodyMiddle, downTrend2, color.new(color.red,   90), fillgaps = false)

fill(bodyMiddle, upTrend3,   color.new(color.green, 90), fillgaps = false)
fill(bodyMiddle, downTrend3, color.new(color.red,   90), fillgaps = false)

// Alerts for the first line only (as an example)
alertcondition(direction1[1] > direction1, title='Downtrend to Uptrend (Line 1)', message='Supertrend Line 1 switched from Downtrend to Uptrend')
alertcondition(direction1[1] < direction1, title='Uptrend to Downtrend (Line 1)', message='Supertrend Line 1 switched from Uptrend to Downtrend')
alertcondition(direction1[1] != direction1, title='Trend Change (Line 1)', message='Supertrend Line 1 switched trend')

// -------------------------------
// Strategy Logic
// -------------------------------
inDateRange = true

// Long Conditions
longEntryCondition = inDateRange and close > upperBand and direction1 < 0 and direction2 < 0 and direction3 < 0
longExitCondition = direction1 > 0 or direction2 > 0 or direction3 > 0

// Short Conditions
shortEntryCondition = inDateRange and close < lowerBand and direction1 > 0 and direction2 > 0 and direction3 > 0
shortExitCondition = direction1 < 0 or direction2 < 0 or direction3 < 0

// Execute Long Trades
if longEntryCondition and strategy.position_size <= 0
    strategy.entry("Long", strategy.long)

if strategy.position_size > 0 and longExitCondition
    strategy.close("Long")

// Execute Short Trades
if shortEntryCondition and strategy.position_size >= 0
    strategy.entry("Short", strategy.short)

if strategy.position_size < 0 and shortExitCondition
    strategy.close("Short")
Detail
https://www.fmz.com/strategy/475596
Last Modified
2024-12-20 14:28:58