
6.0 KiB
Name
七笔形态震荡突破策略Seven-Candlestick-Oscillation-Breakthrough-Strategy
Author
ChaoZhang
Strategy Description
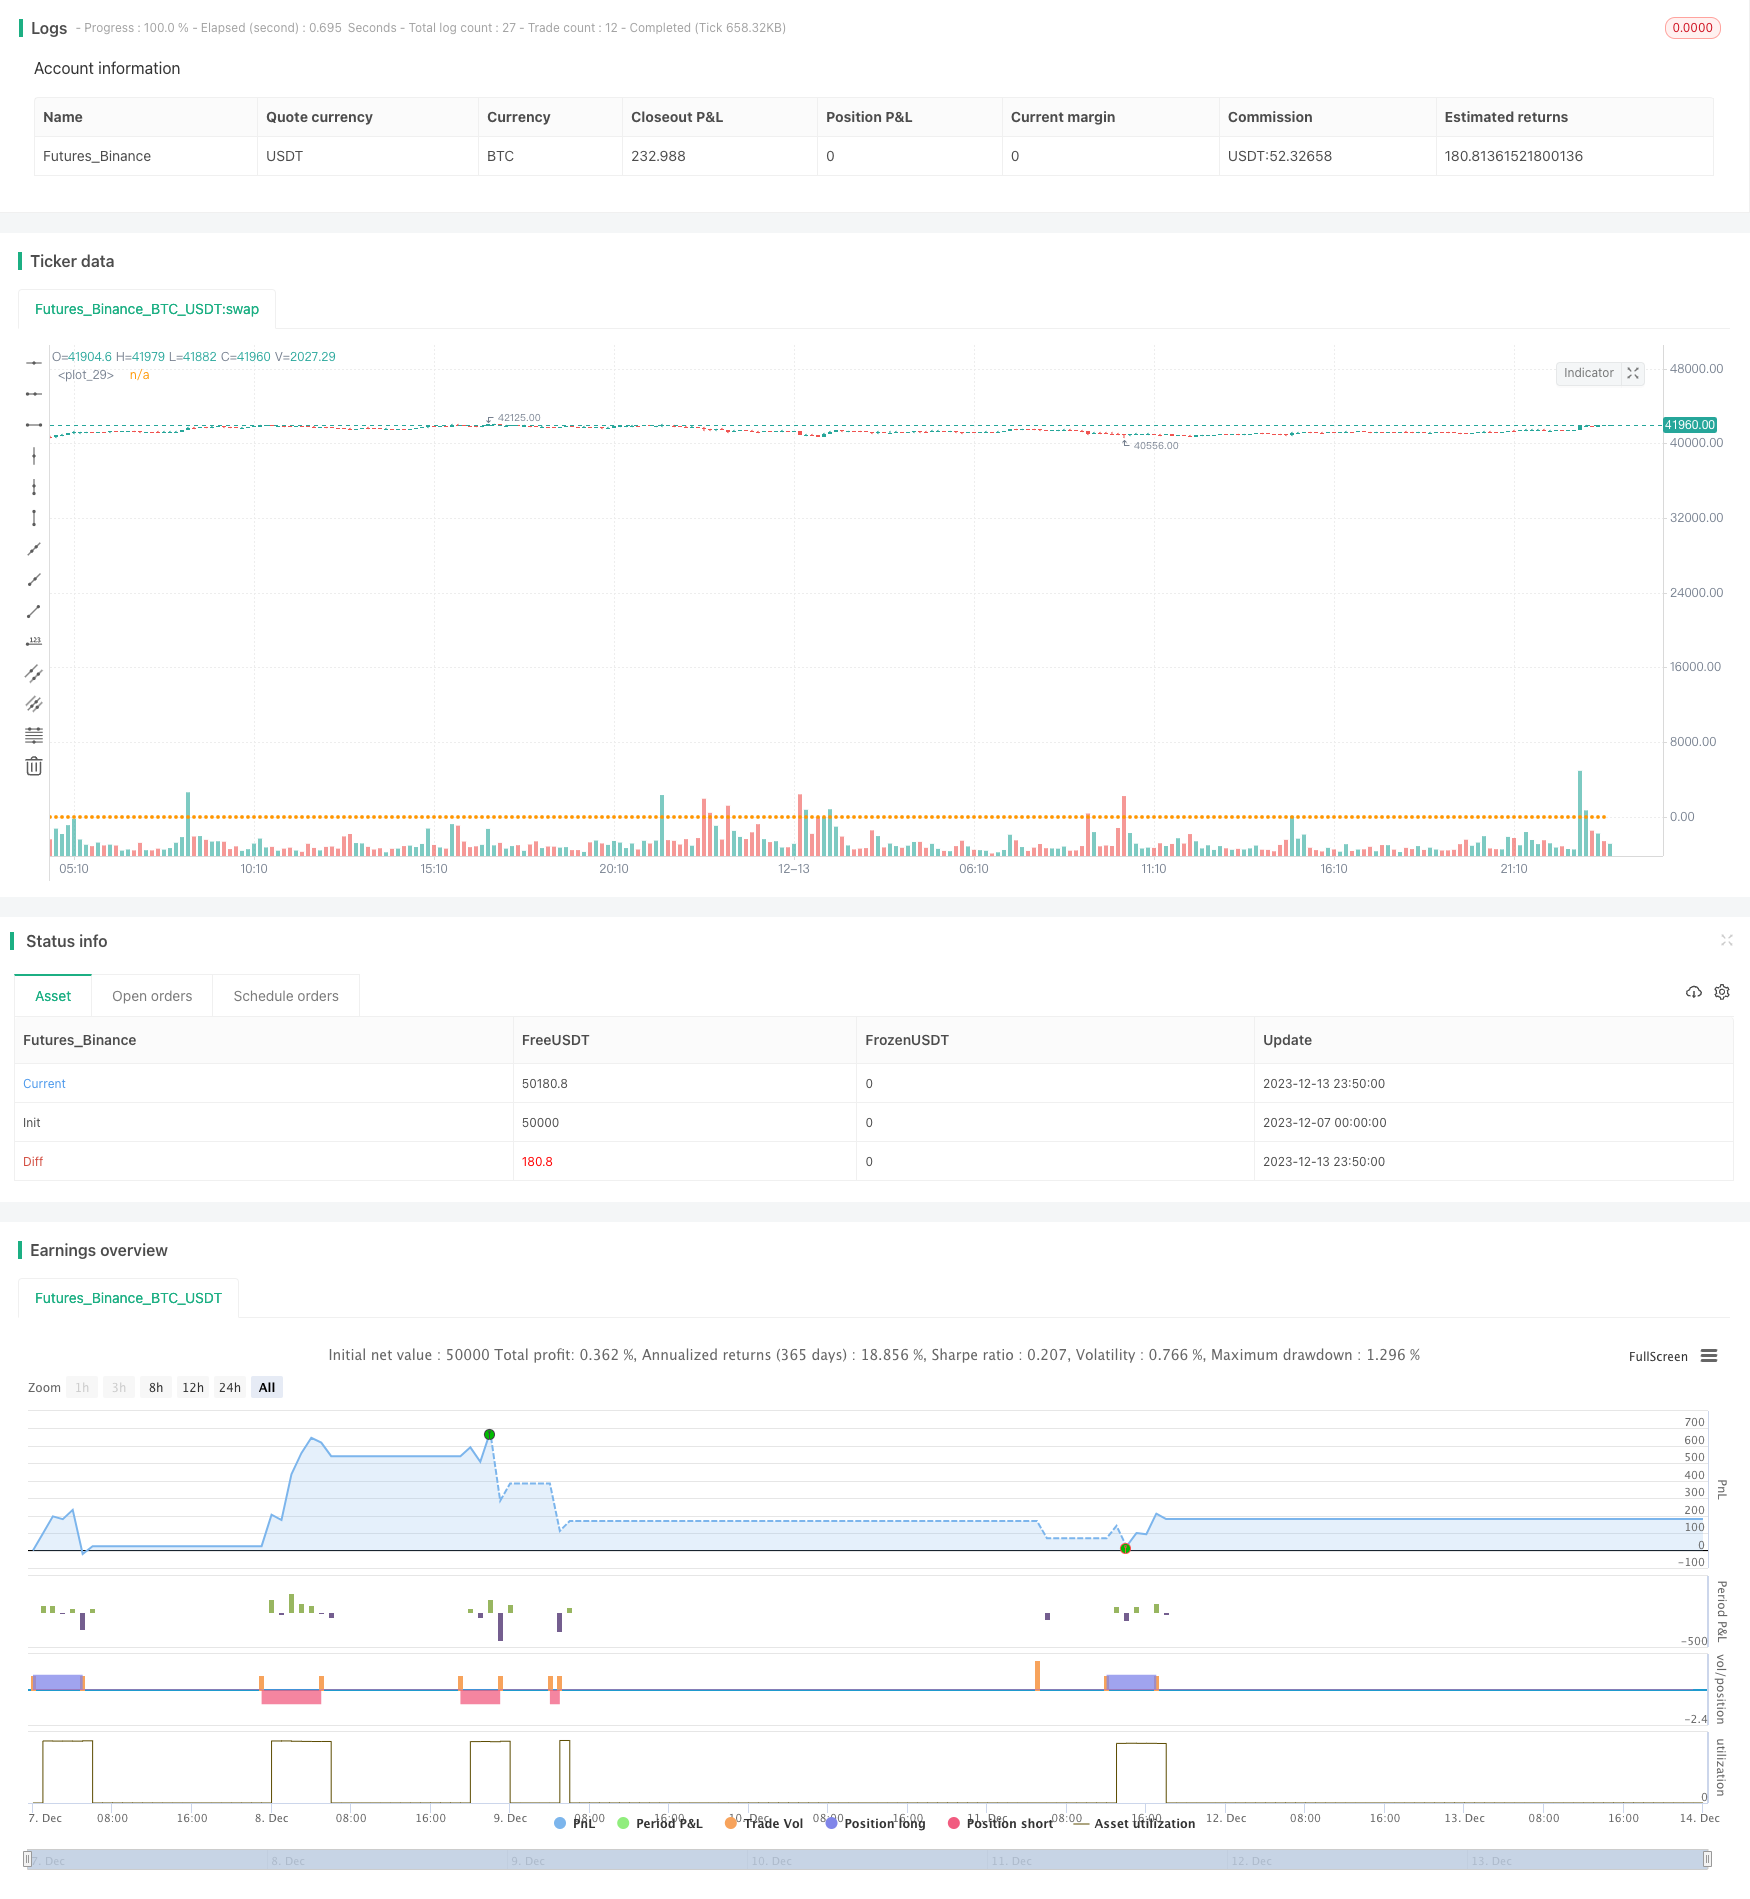 [trans]
概述
七笔形态震荡突破策略通过检测价格形成七根K线的persistence上涨或下跌的形态,判断市场震荡趋势,并在固定时间点进行突破操作,实现盈利。
策略原理
该策略的核心逻辑基于两个指标:
- sevenReds:检测到7根持续下跌的K线,定义为市场震荡下行趋势
- sevenGreens:检测到7根持续上涨的K线,定义为市场震荡上行趋势
当检测到sevenReds时,做多;当检测到sevenGreens时,做空。
此外,策略还在每天固定时间(美国重要数据发布时间)进行平仓,锁定利润。
优势分析
七笔形态震荡突破策略具有以下优势:
- 捕捉市场震荡趋势,七根K线过滤市场噪音,提高信号质量
- 定时操作,避开重要经济数据造成的大幅跳空行情的系统风险
- 定时止盈,及时锁定收益,降低回撤概率
风险分析
七笔形态震荡突破策略也存在一定的风险:
- 形态识别错误风险。七根K线无法完全过滤市场噪音,可能会发出错误信号
- 止损措施不完善,无法限制单笔损失
- 锁定收益的时间无法动态调整,存在未及时止盈的风险
对应解决方法:
- 增加K线数量,提高persistence判断阈值
- 增加移动止损逻辑
- 动态调整止盈时间,结合波动率指标判断
优化方向
七笔形态震荡突破策略可以从以下方面进行优化:
- 增加多个证券池,进行指数或行业轮动
- 增加机器学习模型,辅助判断市场状态
- 结合均线指标进行入场时机优化
- 动态调整仓位利用率,根据回撤情况控制风险敞口
总结
七笔形态震荡突破策略通过捕捉市场中短期震荡趋势实现盈利,同时利用定时操作规避重大风险,并设置止盈逻辑锁定利润。该策略可通过多证券池轮动、机器学习等方式进行效果优化,是一种较为典型的中频量化交易策略。
||
Overview
The seven candlestick oscillation breakthrough strategy detects the persistence up and down candlestick patterns formed by seven K-lines to determine market oscillation trends and make breakthrough operations at fixed times to profit.
Strategy Principle
The core logic of this strategy is based on two indicators:
- sevenReds: detecting 7 consecutive declining K-lines, defined as a downward trend in market oscillation
- sevenGreens: detecting 7 consecutive rising K-lines, defined as an upward trend in market oscillation
When sevenReds is detected, go long; when sevenGreens is detected, go short.
In addition, the strategy also closes positions at fixed times (important US data release times) every day to lock in profits.
Advantage Analysis
The seven candlestick oscillation breakthrough strategy has the following advantages:
- Captures market oscillation trends. Seven K-lines filter out market noise and improve signal quality
- Timed operation avoids systemic risks associated with large gap moves around major economic data
- Timely profit-taking locks in gains and reduces drawdowns
Risk Analysis
The seven candlestick oscillation breakthrough strategy also has some risks:
- Pattern recognition error risk. Seven K-lines cannot completely filter noise and may generate incorrect signals
- Lack of stop loss measures to limit per trade loss
- Profit-taking times cannot adjust dynamically, risk of failure to take profits in time
Corresponding solutions:
- Increase number of K-lines, raise persistence threshold
- Add moving stop loss logic
- Dynamically adjust profit-taking time based on volatility indicators
Optimization Directions
The seven candlestick oscillation breakthrough strategy can be optimized in the following aspects:
- Add multiple security pools for index/sector rotation
- Add machine learning models to aid market regime prediction
- Incorporate moving averages for optimized entry signals
- Dynamically adjust position sizing based on drawdown to control risk
Conclusion
The seven candlestick oscillation breakthrough strategy profits by capturing short-term oscillation trends in the market, while using timed execution to avoid major risks and taking profits to lock in gains. The strategy can be enhanced via multi-asset rotation, machine learning etc. It is a typical medium-frequency quantitative trading strategy.
[/trans]
Source (PineScript)
/*backtest
start: 2023-12-07 00:00:00
end: 2023-12-14 00:00:00
period: 10m
basePeriod: 1m
exchanges: [{"eid":"Futures_Binance","currency":"BTC_USDT"}]
*/

// This source code is subject to the terms of the Mozilla Public License 2.0 at https://mozilla.org/MPL/2.0/
// © Eliza123123

//@version=5
strategy("Breakeven Line Demo", overlay=true)

// Generic signal (not a viable strategy don't use, just some code I wrote quick for demo purposes only)
red = open > close, green = open < close
sevenReds = red and red[1] and red[2] and red[3] and red[4] and red[5] and red[6]
sevenGreens = green and green[1] and green[2] and green[3] and green[4] and green[5] and green[6]
if sevenReds
    strategy.entry('Buy', direction=strategy.long)
if sevenGreens
    strategy.entry('Sell', direction=strategy.short)
if (hour == 5 and minute == 0 ) or (hour == 11 and minute == 0) or (hour == 17 and minute == 0 ) or (hour == 23 and minute == 0)
    strategy.close_all("Close")

// Breakeven line for visualising breakeven price on stacked orders.
var breakEvenLine = 0.0
if strategy.opentrades > 0
    breakEvenLine := strategy.position_avg_price
else
    breakEvenLine := 0.0
color breakEvenLineColor = na
if strategy.position_size > 0
    breakEvenLineColor := #15FF00
if strategy.position_size < 0
    breakEvenLineColor := #FF000D
plot(breakEvenLine, color = breakEvenLine and breakEvenLine[1] > 0 ? breakEvenLineColor : na, linewidth = 2, style = plot.style_circles)
Detail
https://www.fmz.com/strategy/435514
Last Modified
2023-12-15 16:14:32