
11 KiB
Name
一目均衡动力指数策略Ichimoku-Oscillator-with-Stochastic-Momentum-Index-Strategy
Author
ChaoZhang
Strategy Description
 [trans]
概述
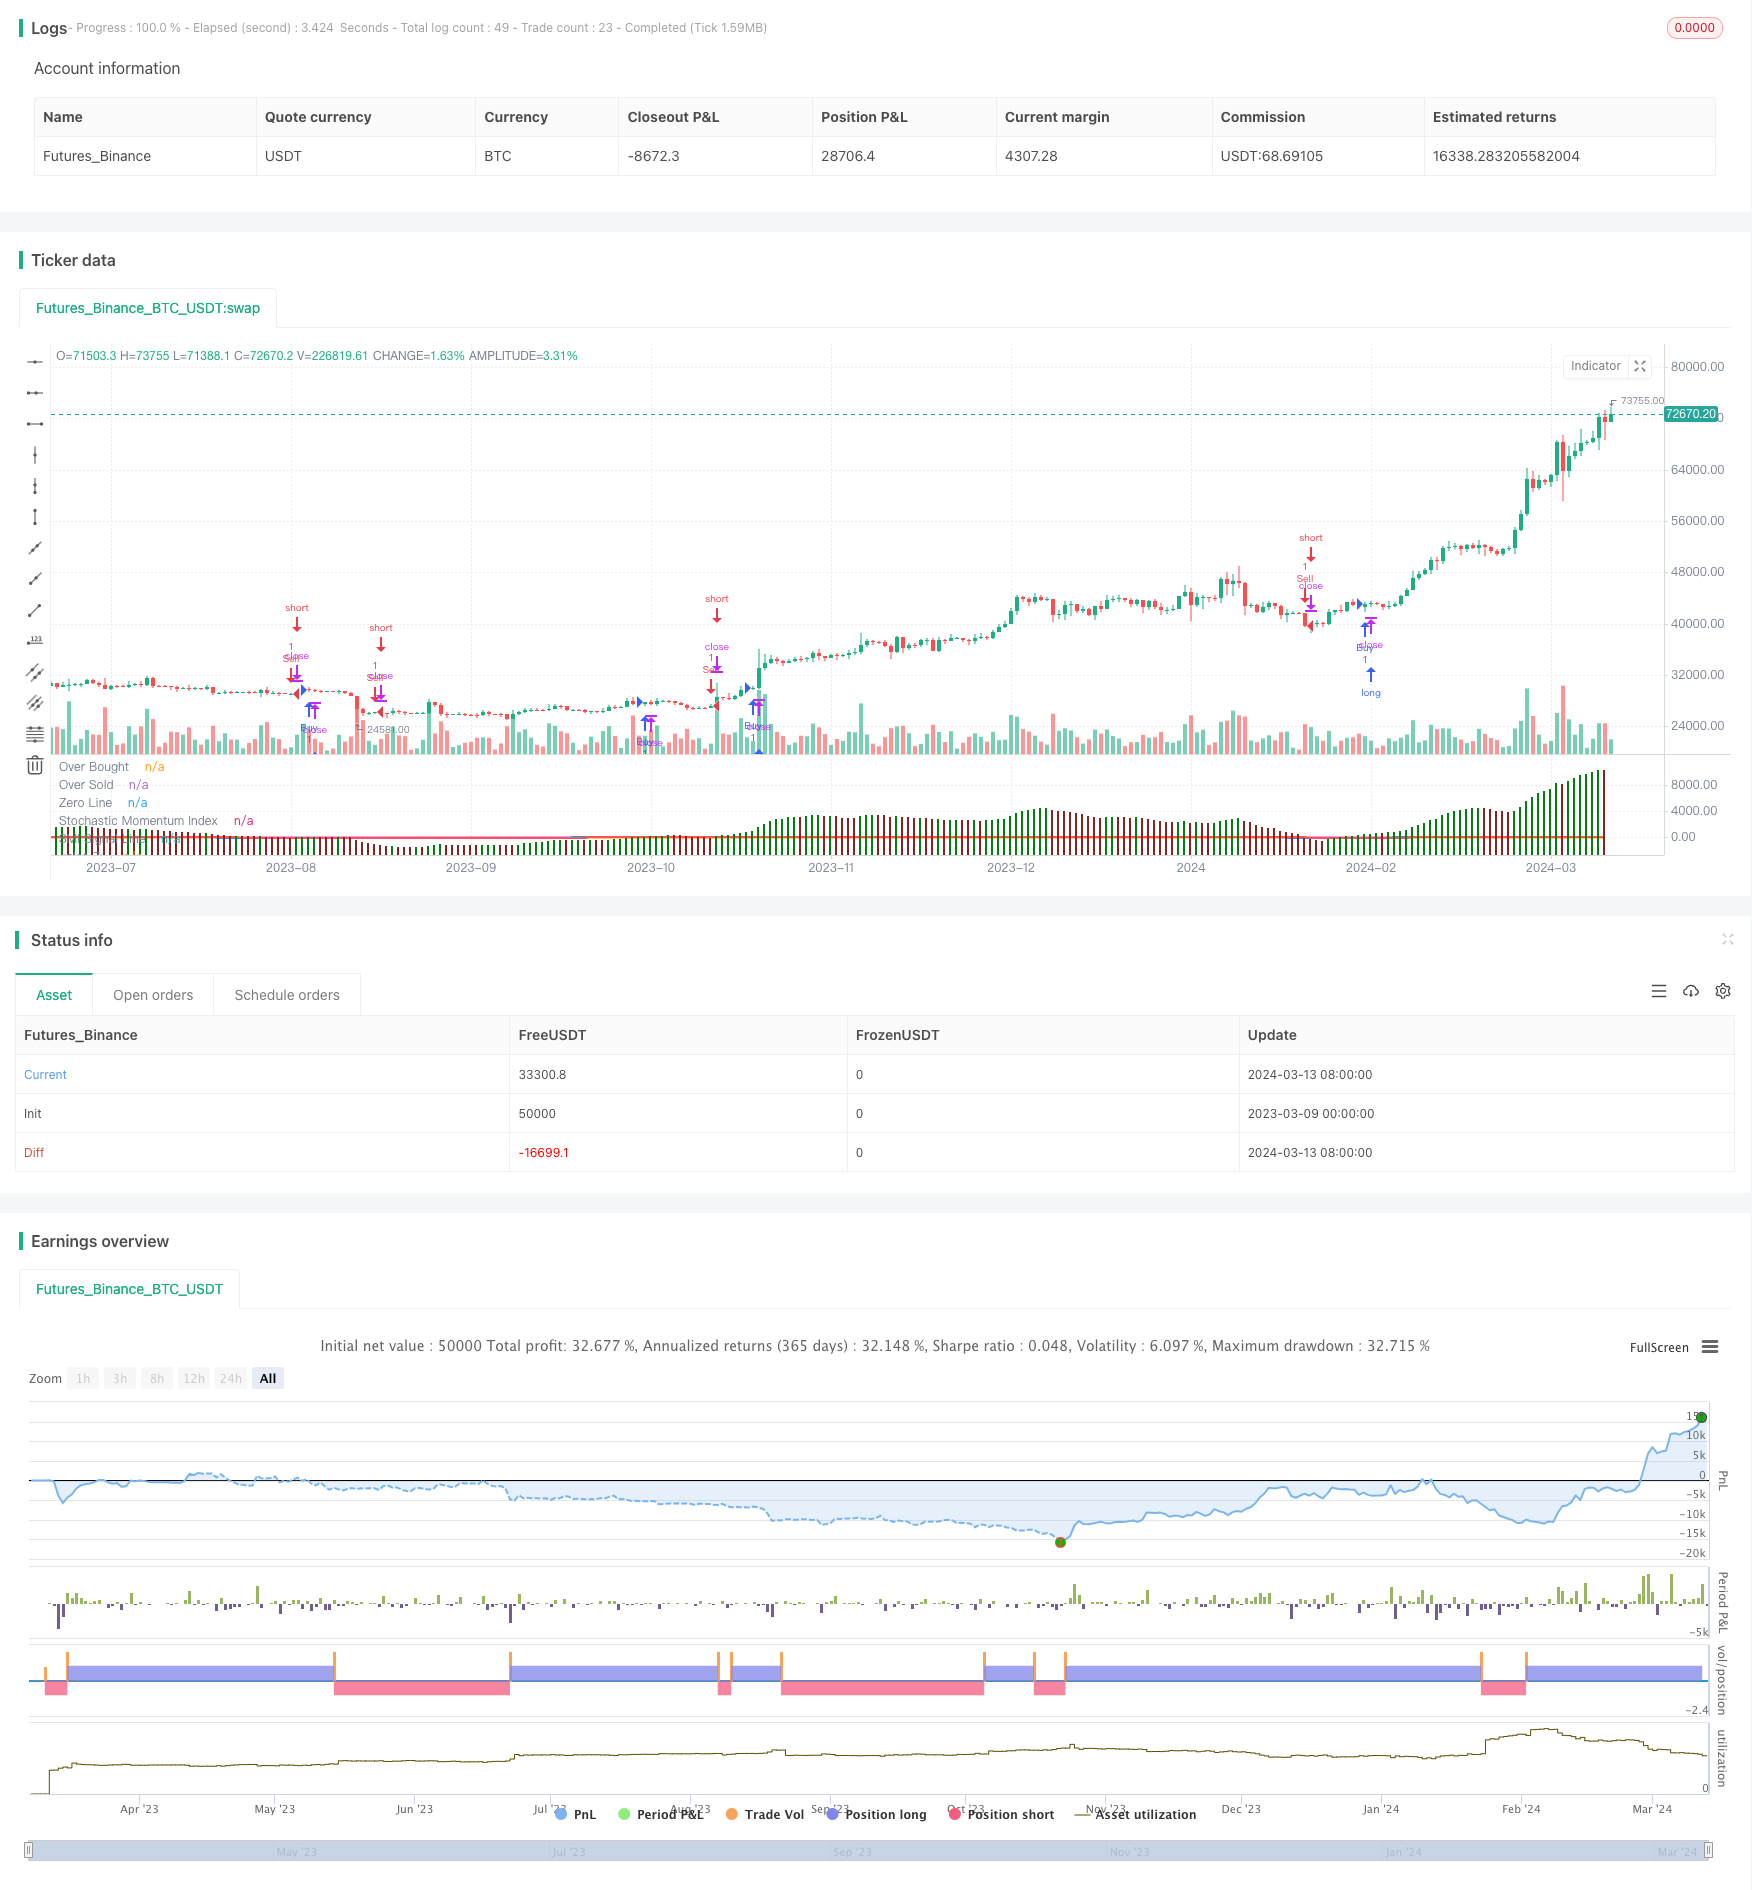
一目均衡动力指数策略是一个结合了一目均衡指标(Ichimoku)和随机动量指数(Stochastic Momentum Index)的交易策略。该策略通过计算一目均衡震荡指标(Ichimoku Oscillator)和随机动量指数,产生交易信号,适用于股票、商品、指数等多个市场和多个时间周期。
策略原理
该策略的核心是计算一目均衡震荡指标(IO)和随机动量指数(SMI)。其中,IO指标通过9日、26日、52日的不同周期EMA以及14日SMA计算得出,反映了市场的超买超卖情况。SMI指标通过计算一定周期内价格相对于最高最低价的位置,并用嵌套的EMA平滑处理,同样反映了市场的超买超卖情况。
策略的交易信号如下:
- 当SMI上穿其信号线,且IO大于0时,开多仓
- 当SMI下穿其信号线,且IO小于0时,开空仓
这样的交易信号结合了IO和SMI两个指标,可以更好地捕捉市场转折点,提高交易准确率。
优势分析
一目均衡动力指数策略具有以下优势:
- 结合了一目均衡指标和随机动量指数两个有效的技术指标,互为补充,可以更全面地分析市场趋势和走势。
- IO指标采用了多个周期的EMA和SMA,可以平滑价格波动,减少噪音干扰。
- SMI指标在随机指标的基础上进行了优化,使用嵌套的EMA使曲线更加平滑,避免了随机指标的掉头问题。
- 交易信号同时考虑了IO和SMI的情况,可以有效过滤假信号,提高胜率。
- 适用于多个市场和多个时间周期,具有良好的适应性和稳定性。
风险分析
尽管一目均衡动力指数策略具有诸多优势,但仍然存在一些潜在风险:
- 该策略依赖于历史数据进行计算和分析,对未来市场的适应性可能会下降。
- IO和SMI指标本质上还是滞后指标,在市场快速变化时,可能出现信号延迟的情况。
- 该策略并未考虑市场的基本面因素,如重大利好利空消息等,遇到这些情况可能失效。
- 在市场震荡区间内,该策略可能出现频繁交易的情况,增加了交易成本。
针对这些风险,可以采取以下措施:
- 定期检测和调整策略参数,提高适应性。
- 结合其他领先指标或市场信息进行分析,弥补滞后性。
- 设置适当的止盈止损,控制单次交易风险。
- 针对震荡市可以增大IO和SMI指标的周期参数,减少交易频率。
优化方向
该策略还有以下几个可以优化的方向:
- 对于IO指标,可以尝试更多不同的周期组合,找到更有代表性的参数。
- 对于SMI指标,可以研究不同的平滑方法,如考虑使用威尔德平滑法等,进一步降低指标的滞后性。
- 可以适当纳入交易量等其他指标,丰富交易信号的纬度。
- 针对不同的市场特点,可以设置不同的参数和阈值,提高策略的适应性。
- 可以将该策略与其他策略进行组合,如趋势策略、均值回归策略等,建立策略体系,提高整体收益。
通过以上优化,可以进一步提升一目均衡动力指数策略的表现和稳定性。
总结
一目均衡动力指数策略是一个有效的技术分析策略。它巧妙地结合了一目均衡指标和随机动量指数两个经典指标,互为补充,可以比较全面地分析市场的超买超卖情况和趋势转折点,为交易决策提供依据。该策略logic清晰,适用性广,具有较强的实用价值。当然,任何策略都有其局限性和风险,在实际应用中需要进一步优化和改进,并结合其他分析手段和风控措施,才能更好地发挥效用。总的来说,一目均衡动力指数策略为量化交易提供了一个新的思路和方法,值得进一步探索和研究。
||
Overview
The Ichimoku Oscillator with Stochastic Momentum Index Strategy is a trading strategy that combines the Ichimoku indicator and the Stochastic Momentum Index (SMI). This strategy generates trading signals by calculating the Ichimoku Oscillator (IO) and the Stochastic Momentum Index, and is suitable for various markets such as stocks, commodities, indices, and different time frames.
Strategy Principle
The core of this strategy is to calculate the Ichimoku Oscillator (IO) and the Stochastic Momentum Index (SMI). The IO indicator is calculated using different period EMAs (9, 26, 52) and a 14-day SMA, reflecting the overbought and oversold conditions of the market. The SMI indicator calculates the position of the price relative to the highest and lowest prices within a certain period, and uses nested EMAs for smoothing, also reflecting the overbought and oversold conditions of the market.
The trading signals of the strategy are as follows:
- When the SMI crosses above its signal line and the IO is greater than 0, open a long position.
- When the SMI crosses below its signal line and the IO is less than 0, open a short position.
These trading signals combine both the IO and SMI indicators, which can better capture market turning points and improve trading accuracy.
Advantage Analysis
The Ichimoku Oscillator with Stochastic Momentum Index Strategy has the following advantages:
- It combines two effective technical indicators, Ichimoku and Stochastic Momentum Index, which complement each other and provide a more comprehensive analysis of market trends and movements.
- The IO indicator uses multiple period EMAs and SMAs to smooth price fluctuations and reduce noise interference.
- The SMI indicator is an optimization based on the stochastic indicator, using nested EMAs to make the curve smoother and avoid the problem of stochastic indicator reversals.
- The trading signals consider both the IO and SMI conditions, which can effectively filter out false signals and improve the win rate.
- It is applicable to multiple markets and time frames, with good adaptability and stability.
Risk Analysis
Despite the many advantages of the Ichimoku Oscillator with Stochastic Momentum Index Strategy, there are still some potential risks:
- The strategy relies on historical data for calculation and analysis, and its adaptability to future markets may decline.
- The IO and SMI indicators are essentially lagging indicators, and signal delays may occur when the market changes rapidly.
- The strategy does not consider fundamental factors of the market, such as major positive or negative news, and may fail in these situations.
- In range-bound markets, the strategy may result in frequent trading, increasing transaction costs.
To address these risks, the following measures can be taken:
- Regularly test and adjust strategy parameters to improve adaptability.
- Combine with other leading indicators or market information for analysis to compensate for the lag.
- Set appropriate take-profit and stop-loss levels to control single transaction risk.
- For range-bound markets, increase the period parameters of the IO and SMI indicators to reduce trading frequency.
Optimization Direction
The strategy can be optimized in the following directions:
- For the IO indicator, try more different period combinations to find more representative parameters.
- For the SMI indicator, study different smoothing methods, such as considering the use of Wilder's smoothing method, to further reduce the lag of the indicator.
- Appropriately incorporate other indicators such as trading volume to enrich the dimensions of trading signals.
- Set different parameters and thresholds for different market characteristics to improve the adaptability of the strategy.
- Combine this strategy with other strategies, such as trend strategies, mean reversion strategies, etc., to establish a strategy system and improve overall returns.
Through the above optimizations, the performance and stability of the Ichimoku Oscillator with Stochastic Momentum Index Strategy can be further improved.
Summary
The Ichimoku Oscillator with Stochastic Momentum Index Strategy is an effective technical analysis strategy. It cleverly combines two classic indicators, Ichimoku and Stochastic Momentum Index, which complement each other and provide a relatively comprehensive analysis of the overbought and oversold conditions and trend turning points of the market, providing a basis for trading decisions. The strategy logic is clear and widely applicable, with strong practical value. Of course, any strategy has its limitations and risks. In practical application, further optimization and improvement are needed, combined with other analysis methods and risk control measures, in order to better play its role. In general, the Ichimoku Oscillator with Stochastic Momentum Index Strategy provides a new idea and method for quantitative trading, which is worthy of further exploration and research.
[/trans]
Strategy Arguments
| Argument | Default | Description |
|---|---|---|
| v_input_1 | 21 | Percent K Length |
| v_input_2 | 9 | Percent D Length |
Source (PineScript)
/*backtest
start: 2023-03-09 00:00:00
end: 2024-03-14 00:00:00
period: 1d
basePeriod: 1h
exchanges: [{"eid":"Futures_Binance","currency":"BTC_USDT"}]
*/

// This Pine Script™ code is subject to the terms of the Mozilla Public License 2.0 at https://mozilla.org/MPL/2.0/
// © manoharbauskar

//@version=5
strategy(title='Ichimoku Oscillator with SMI', shorttitle='IOSMI', overlay = false)
io = ta.ema(hl2, 9) / 2 + ta.ema(hl2, 26) / 2 + ta.sma(close, 14) - ta.ema(hl2, 52) - ta.sma(open, 14)
plot(io, color=ta.change(io) <= 0 ? #872323 : #007F0E, style=plot.style_columns)
a = input(21, 'Percent K Length')
b = input(9, 'Percent D Length')
// Range Calculation
ll = ta.lowest(low, a)
hh = ta.highest(high, a)
diff = hh - ll
rdiff = close - (hh + ll) / 2
// Nested Moving Average for smoother curves
avgrel = ta.ema(ta.ema(rdiff, b), b)
avgdiff = ta.ema(ta.ema(diff, b), b)
// SMI calculations
SMI = avgdiff != 0 ? avgrel / (avgdiff / 2) * 100 : 0
SMIsignal = ta.ema(SMI, b)
//All PLOTS
plot(SMI, color = color.blue , title='Stochastic Momentum Index', linewidth = 2)
plot(SMIsignal, color=color.new(#FF5252, 0), title='SMI Signal Line', linewidth = 2)
plot(60, color=color.new(#00E676, 0), title='Over Bought')
plot(-60, color=color.new(#FF9800, 0), title='Over Sold')
plot(0, color=color.new(#E040FB, 0), title='Zero Line')

longCondition = SMI > SMIsignal and io > 0
if (longCondition)
    strategy.entry("Buy", strategy.long)

shortCondition = SMI < SMIsignal and io < 0
if (shortCondition)
    strategy.entry("Sell", strategy.short)
Detail
https://www.fmz.com/strategy/444975
Last Modified
2024-03-15 16:23:55