
17 KiB
Name
VAWSI和趋势持续性反转策略结合动态长度计算的多指标综合分析系统-VAWSI-and-Trend-Persistence-Reversal-Strategy-with-Dynamic-Length-Calculation-Multi-Indicator-Analysis-System
Author
ChaoZhang
Strategy Description
[trans]
概述
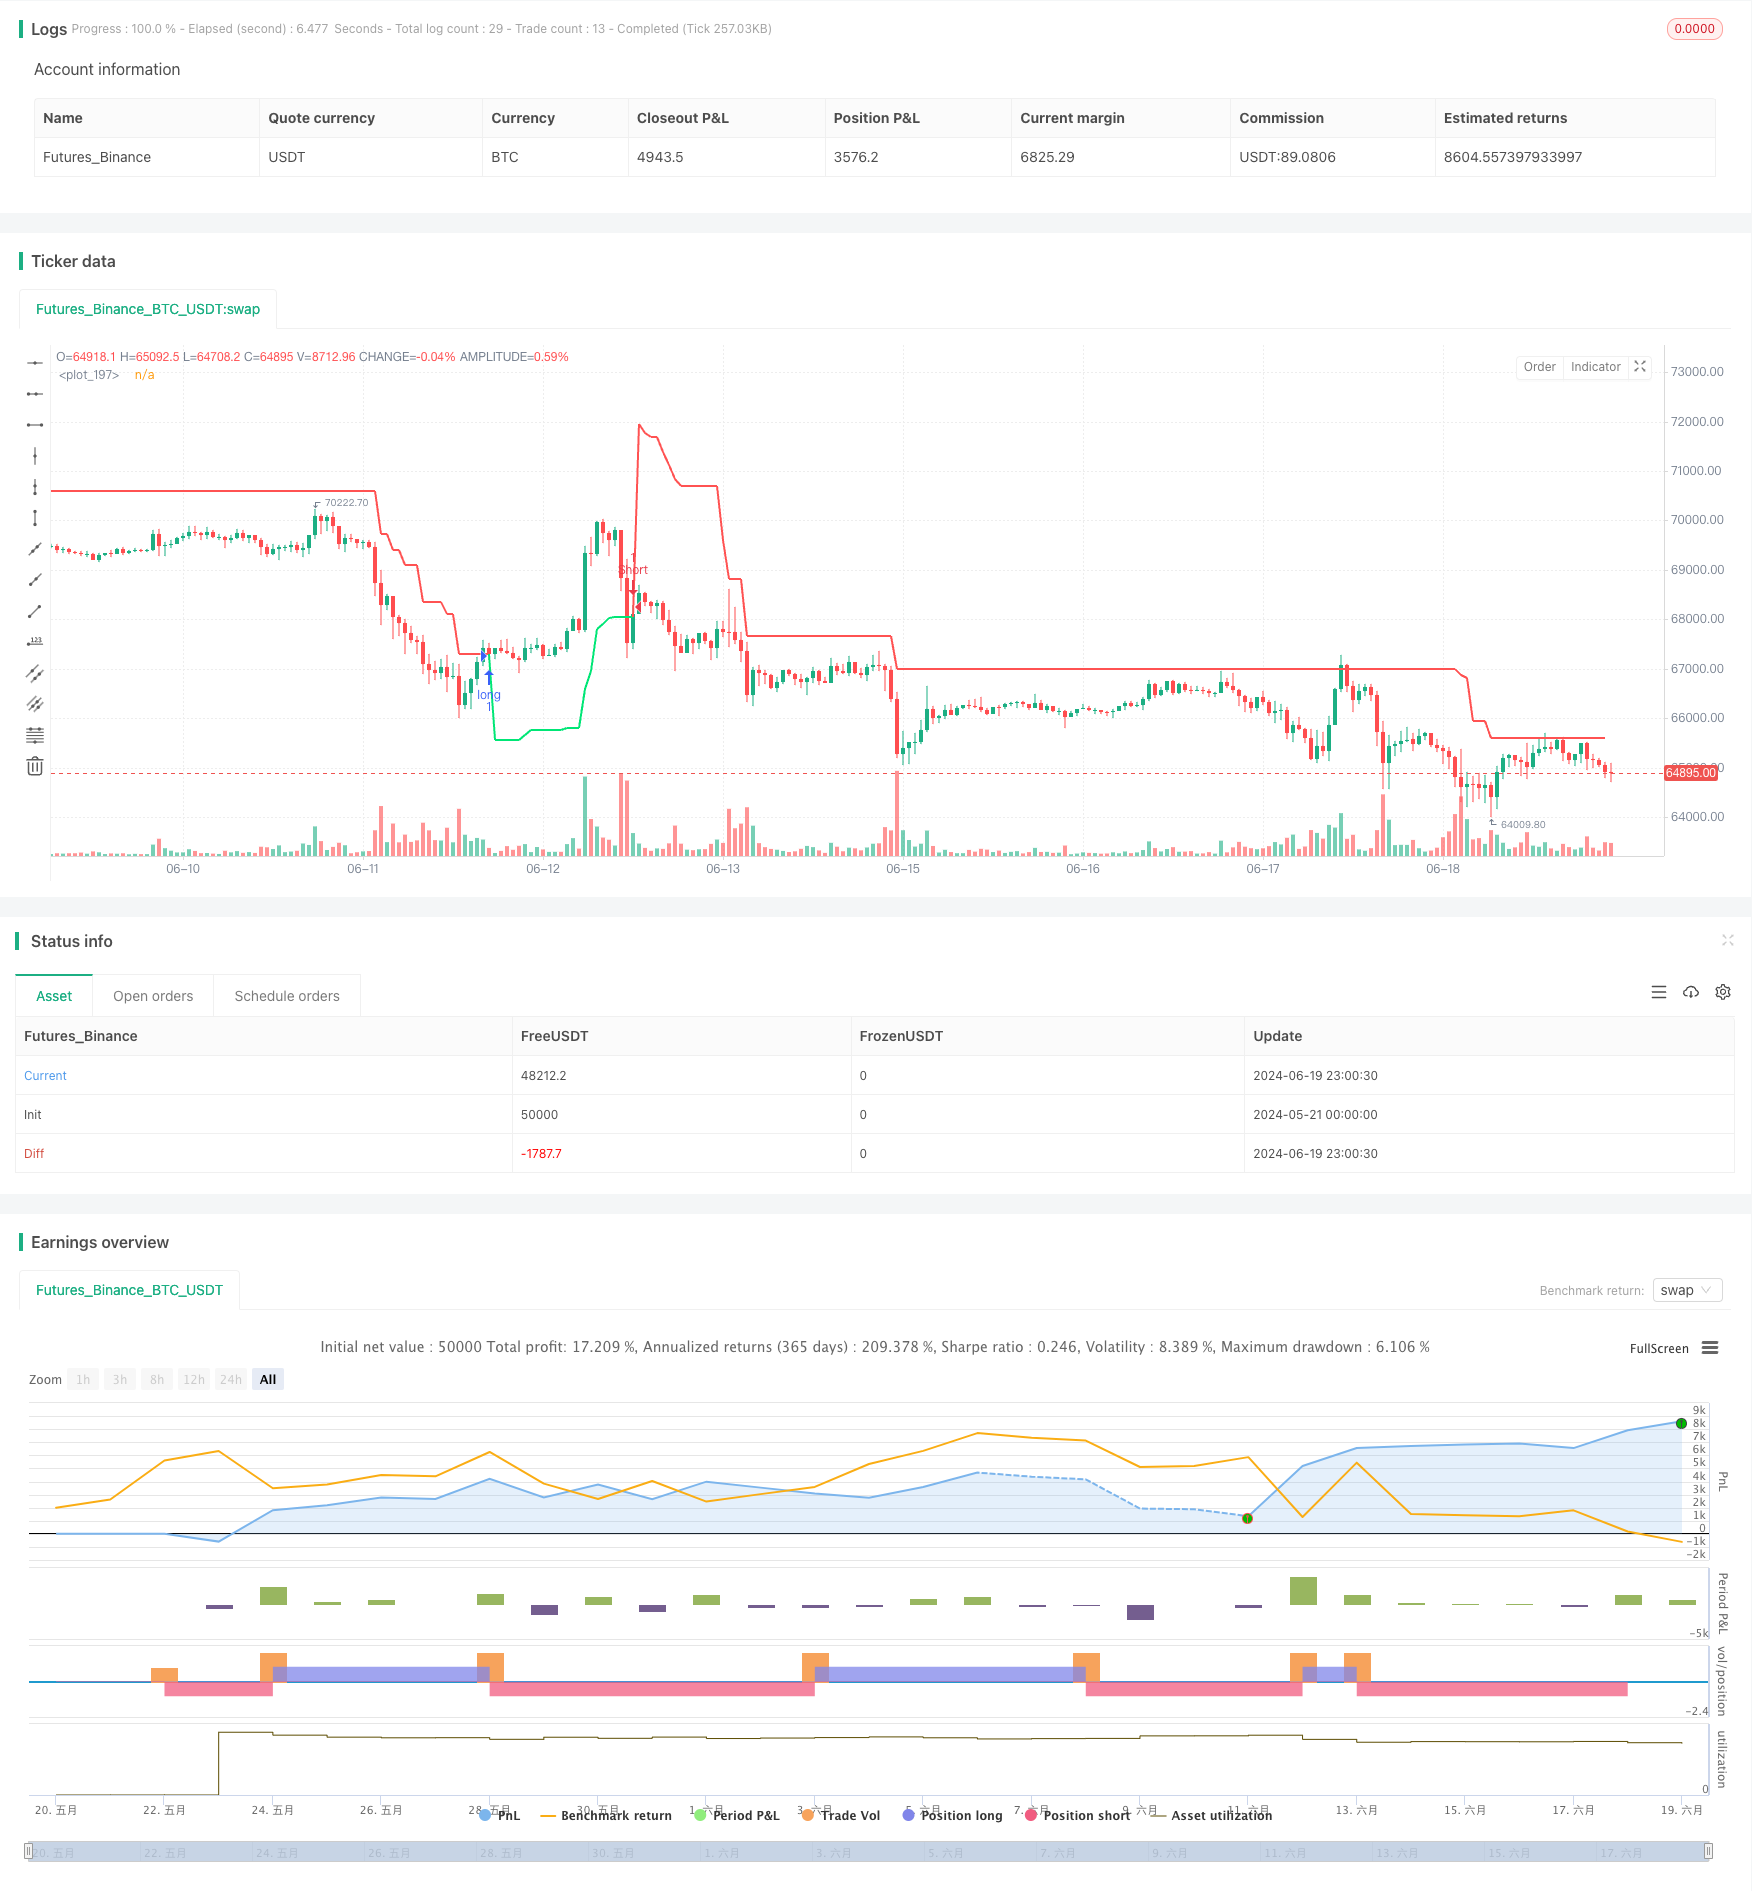
这个策略是一个结合多个指标的综合分析系统,主要基于VAWSI(体积和ATR加权强度指数)、趋势持续性指标和修改版ATR来判断市场趋势和可能的反转点。该策略还引入了动态长度计算,以适应不同市场条件。它通过设置动态的止损和获利点来管理风险,并在识别到潜在反转信号时进行交易。
该策略的核心在于通过多个自定义指标来衡量市场趋势的强度、持续时间和波动性,从而找出最佳的交易时机。它特别适用于具有明显趋势的市场,但也包含了适应性机制以处理不同的市场状态。
策略原理
-
VAWSI指标:这是一个原创指标,类似于RSI,但使用VAWMA(体积和ATR加权移动平均线)代替RMA。它衡量新兴趋势的强度。
-
趋势持续性指标:另一个原创指标,用于测量趋势持续的时间。它计算源数据与指定长度内最高/最低点的最大偏差,然后累积这个偏差并创建一个强度指数。
-
修改版ATR:取高-低和|源-前一源|的最大值,然后取其变化的绝对值并用源数据归一化。
-
动态长度计算:使用BlackCat1402的动态长度计算方法,根据市场条件调整指标的长度参数。
-
综合分析:将VAWSI、趋势持续性和ATR的读数结合起来,生成一个综合指标。较低的最终数值表示即将发生反转,较高的数值表示市场不稳定或震荡。
-
动态止损/获利:基于综合指标和当前趋势方向计算动态的止损和获利水平。
-
交易信号:当价格完全穿过计算出的阈值线时,系统会确认交叉并产生交易信号。
策略优势
-
多维度分析:通过结合多个指标,策略能够从不同角度分析市场,提高判断的准确性。
-
自适应性:动态长度计算使策略能够适应不同的市场条件,增强了策略的灵活性。
-
风险管理:动态止损和获利点的设置有助于更好地控制风险,适应市场的变化。
-
原创指标:VAWSI和趋势持续性指标提供了独特的市场洞察,可能捕捉到传统指标忽视的信号。
-
防止重绘:使用barstate.isconfirmed确保信号不会重绘,提高了回测的准确性。
-
可定制性:多个参数可以调整,使策略能够适应不同的交易品种和时间框架。
策略风险
-
过度优化:大量参数可能导致过度优化,在实盘交易中表现不佳。
-
市场适应性:虽然在某些市场表现良好,但可能不适用于所有市场条件,特别是在波动性较低的市场中。
-
复杂性:策略的复杂性可能使其难以理解和维护,增加了操作错误的风险。
-
计算密集:多个自定义指标和动态计算可能导致较高的计算负荷,影响执行速度。
-
依赖历史数据:策略使用大量历史数据进行计算,在某些情况下可能导致滞后。
优化方向
-
参数优化:使用机器学习算法来优化各种权重和长度参数,以提高策略在不同市场条件下的表现。
-
市场状态识别:增加一个市场状态识别模块,以便在不同的市场环境中自动调整策略参数。
-
信号过滤:引入额外的过滤机制,如趋势强度阈值,以减少假信号。
-
成交量分析:深化对成交量的分析,可能引入成交量形态识别,以增强信号的可靠性。
-
多时间框架分析:整合多个时间框架的信号,以提高交易决策的稳健性。
-
风险管理优化:实现更复杂的风险管理策略,如动态仓位sizing和多层次止损。
-
计算效率:优化代码以提高计算效率,特别是在处理大量历史数据时。
总结
VAWSI和趋势持续性反转策略是一个复杂而全面的交易系统,结合了多个创新指标和动态参数调整。它的优势在于多维度的市场分析和自适应性,使其能够在不同的市场条件下寻找潜在的反转机会。然而,策略的复杂性也带来了过度优化和适应性方面的挑战。
通过进一步的优化,特别是在参数调整、市场状态识别和风险管理方面,该策略有潜力成为一个强大的交易工具。然而,使用者应该注意到,没有一个策略是完美的,持续的监控和调整是必要的。在实际应用中,建议在模拟账户上进行充分的测试,并结合其他分析工具和市场知识来做出交易决策。
||
Overview
This strategy is a comprehensive analysis system combining multiple indicators, primarily based on VAWSI (Volume and ATR Weighted Strength Index), Trend Persistence Indicator, and a modified ATR to assess market trends and potential reversal points. The strategy also incorporates dynamic length calculation to adapt to different market conditions. It manages risk by setting dynamic stop-loss and take-profit levels and executes trades when potential reversal signals are identified.
The core of this strategy lies in its use of multiple custom indicators to measure the strength, duration, and volatility of market trends, thereby identifying optimal trading opportunities. It is particularly suited for markets with clear trends but also includes adaptive mechanisms to handle various market states.
Strategy Principles
-
VAWSI Indicator: An original indicator similar to RSI but using VAWMA (Volume and ATR Weighted Moving Average) instead of RMA. It measures the strength of emerging trends.
-
Trend Persistence Indicator: Another original indicator that measures how long a trend has persisted. It calculates the maximum deviation of the source from the highest/lowest over a specified length, then creates a cumulative measure and strength index from this deviation.
-
Modified ATR: Takes the maximum of high-low and |source - previous source|, then takes the absolute value of its change and normalizes it with the source.
-
Dynamic Length Calculation: Utilizes BlackCat1402's dynamic length calculation method to adjust indicator length parameters based on market conditions.
-
Composite Analysis: Combines readings from VAWSI, Trend Persistence, and ATR to generate a composite indicator. Lower final values indicate imminent reversal, while higher values suggest unstable or choppy markets.
-
Dynamic Stop-Loss/Take-Profit: Calculates dynamic stop-loss and take-profit levels based on the composite indicator and current trend direction.
-
Trade Signals: Confirms crossovers and generates trade signals when price fully crosses the calculated threshold line.
Strategy Advantages
-
Multi-dimensional Analysis: By combining multiple indicators, the strategy can analyze the market from different angles, improving decision accuracy.
-
Adaptability: Dynamic length calculation allows the strategy to adapt to different market conditions, enhancing its flexibility.
-
Risk Management: Dynamic stop-loss and take-profit settings help better control risk and adapt to market changes.
-
Original Indicators: VAWSI and Trend Persistence indicators provide unique market insights that might capture signals overlooked by traditional indicators.
-
Anti-Repainting: Use of barstate.isconfirmed ensures signals don't repaint, improving backtesting accuracy.
-
Customizability: Multiple adjustable parameters allow the strategy to be adapted for different trading instruments and timeframes.
Strategy Risks
-
Over-optimization: The large number of parameters may lead to over-optimization, potentially performing poorly in live trading.
-
Market Adaptability: While performing well in certain markets, it may not be suitable for all market conditions, especially in low-volatility markets.
-
Complexity: The strategy's complexity may make it difficult to understand and maintain, increasing the risk of operational errors.
-
Computation Intensive: Multiple custom indicators and dynamic calculations may result in high computational load, affecting execution speed.
-
Reliance on Historical Data: The strategy uses a large amount of historical data for calculations, which may lead to lag in some situations.
Optimization Directions
-
Parameter Optimization: Use machine learning algorithms to optimize various weight and length parameters to improve strategy performance under different market conditions.
-
Market State Recognition: Add a market state recognition module to automatically adjust strategy parameters in different market environments.
-
Signal Filtering: Introduce additional filtering mechanisms, such as trend strength thresholds, to reduce false signals.
-
Volume Analysis: Deepen volume analysis, possibly introducing volume pattern recognition to enhance signal reliability.
-
Multi-timeframe Analysis: Integrate signals from multiple timeframes to improve the robustness of trading decisions.
-
Risk Management Optimization: Implement more sophisticated risk management strategies, such as dynamic position sizing and multi-level stop-losses.
-
Computational Efficiency: Optimize code to improve calculation efficiency, especially when processing large amounts of historical data.
Conclusion
The VAWSI and Trend Persistence Reversal Strategy is a complex and comprehensive trading system that combines multiple innovative indicators and dynamic parameter adjustments. Its strengths lie in multi-dimensional market analysis and adaptability, allowing it to seek potential reversal opportunities under various market conditions. However, the strategy's complexity also brings challenges in terms of over-optimization and adaptability.
Through further optimization, especially in parameter adjustment, market state recognition, and risk management, this strategy has the potential to become a powerful trading tool. However, users should note that no strategy is perfect, and continuous monitoring and adjustment are necessary. In practical application, it is recommended to conduct thorough testing on demo accounts and to combine this strategy with other analytical tools and market knowledge to make trading decisions.
[/trans]
Source (PineScript)
/*backtest
start: 2024-05-21 00:00:00
end: 2024-06-20 00:00:00
period: 1h
basePeriod: 15m
exchanges: [{"eid":"Futures_Binance","currency":"BTC_USDT"}]
*/

//@version=5
strategy("VAWSI and Trend Persistance Reversal", overlay=true, max_bars_back = 4999, process_orders_on_close = true)


//INPUTS
sltp = input.float(title = "Minimum SL/TP", defval = 5.0)
rsi_weight = input.float(title = "Wawsi weight", defval = 100.0)
half_weight= input.float(title = "Trend Persistence Weight", defval = 79.0)
atr_weight = input.float(title = "ATR Weight", defval = 20.0)
com_mult = input.float(title = "Combination Mult", defval = 1, step = .001)
smoothing = input.int(title = "Trend Persistence smooth length", defval = 3)
CycPart = input.float(1.1, step = .001, title = "Length Cycle Decimal")
src = close
hclose = request.security(ticker.heikinashi(syminfo.tickerid), timeframe.period, src)

//BlackCat1402's Dynamic Length Calculation
EhlersHoDyDC(Price, CycPart) =>
    // Vars:
    Smooth = 0.00
    Detrender = 0.00
    I1 = 0.00
    Q1 = 0.00
    jI = 0.00
    jQ = 0.00
    I2 = 0.00
    Q2 = 0.00
    Re = 0.00
    Im = 0.00
    Period = 0.00
    SmoothPeriod = 0.00
    pi = 2 * math.asin(1)
    DomCycle = 0.0

    //Hilbert Transform
    Smooth := bar_index > 5 ? (4 * Price + 3 * nz(Price[1]) + 2 * nz(Price[2]) + nz(Price[3])) / 10 : Smooth
    Detrender := bar_index > 5 ? (.0962 * Smooth + .5769 * nz(Smooth[2]) - .5769 * nz(Smooth[4]) - .0962 * nz(Smooth[6])) * (.075 * nz(Period[1]) + .54) : Detrender
    //Compute InPhase and Quadrature components
    Q1 := bar_index > 5 ? (.0962 * Detrender + .5769 * nz(Detrender[2]) - .5769 * nz(Detrender[4]) - .0962 * nz(Detrender[6])) * (.075 * nz(Period[1]) + .54) : Q1
    I1 := bar_index > 5 ? nz(Detrender[3]) : I1

    //Advance the phase of I1 and Q1 by 90 degrees
    jI := (.0962 * I1 + .5769 * nz(I1[2]) - .5769 * nz(I1[4]) - .0962 * nz(I1[6])) * (.075 * nz(Period[1]) + .54)
    jQ := (.0962 * Q1 + .5769 * nz(Q1[2]) - .5769 * nz(Q1[4]) - .0962 * nz(Q1[6])) * (.075 * nz(Period[1]) + .54)

    //Phasor addition for 3 bar averaging
    I2 := I1 - jQ
    Q2 := Q1 + jI

    //Smooth the I and Q components before applying the discriminator
    I2 := .2 * I2 + .8 * nz(I2[1])
    Q2 := .2 * Q2 + .8 * nz(Q2[1])

    //Homodyne Discriminator
    Re := I2 * nz(I2[1]) + Q2 * nz(Q2[1])
    Im := I2 * nz(Q2[1]) - Q2 * nz(I2[1])
    Re := .2 * Re + .8 * nz(Re[1])
    Im := .2 * Im + .8 * nz(Im[1])

    Period := Im != 0 and Re != 0 ? 2 * pi / math.atan(Im / Re) : Period
    Period := Period > 1.5 * nz(Period[1]) ? 1.5 * nz(Period[1]) : Period
    Period := Period < .67 * nz(Period[1]) ? .67 * nz(Period[1]) : Period
    //Limit Period to be within the bounds of 6 bar and 50 bar cycles
    Period := Period < 6 ? 6 : Period
    Period := Period > 50 ? 50 : Period
    Period := .2 * Period + .8 * nz(Period[1])
    SmoothPeriod := .33 * Period + .67 * nz(SmoothPeriod[1])
    //it can add filter to Period here
    DomCycle := math.ceil(CycPart * SmoothPeriod) > 34 ? 34 : math.ceil(CycPart * SmoothPeriod) < 1 ? 1 : math.ceil(CycPart * SmoothPeriod)
    DomCycle

wma(src, length) =>
    wma = 0.0
    sum = 0.0
    norm = length * (length + 1) / 2
    for i = 0 to length - 1
        sum := sum + src[i] * (length - i)
    wma := sum / norm


length = math.round(math.ceil(EhlersHoDyDC(hclose,CycPart)))

// Traditional Function initialization
highest_custom(src, length) =>
    x = src
    for i = 0 to math.min(length, 4999)
        if src[i] > x
            x := src[i]
    x
lowest_custom(src, length) =>
    x = src
    for i = 0 to math.min(length, 4999)
        if src[i] < x
            x := src[i]
    x

rma(src, len) =>
    sum = 0.0
    for i = 0 to len - 1
        math.min(1, len)
        sum += src[i]
    rma = sum / len
    rma := nz(rma[1]) * (len - 1) / len + src / len

sma(src, length) =>
    math.sum(src, length) / length

hln(src, length) =>
    TR = math.max(math.abs(src - src[1]), high - low)
    TR := src / math.abs(ta.change(rma(TR, length)))
    TR := (1 / TR) * 100

vawma(src, length) =>
    atr = ta.atr(1)
    aavg = sma(atr, length)
    vavg = sma(volume, length)
    weighted_sum = 0.0
    sum_weights = 0.0
    weighted = 0.0
    for i = 0 to length
        weight = ((volume[i] / vavg + (atr[i]) / aavg) / 2)
        weighted_sum += src[i] * weight
        sum_weights += weight
    a = (weighted_sum / sum_weights)

vawsi(src, len) =>
    rmaUp = vawma(math.max(ta.change(src), 0), len)
    rmaDown = vawma(-math.min(ta.change(src), 0), len)
    rsi = 100 - (100 / (1 + rmaUp / rmaDown))

trendPersistence(src, length, smoothing) =>
    trendu = math.abs(src - highest_custom(src, length))
    trendd = math.abs(src - lowest_custom(src, length))
    trendu := wma(trendu, smoothing)
    trendd := wma(trendd, smoothing)
    trendu := ta.change(ta.cum(trendu))
    trendd := ta.change(ta.cum(trendd))
    trend = wma(math.max(trendu, trendd), smoothing)
    rmaUp = rma(math.max(ta.change(trend), 0), length)
    rmaDown = rma(-math.min(ta.change(trend), 0), length)
    rsi = 100 - (100 / (1 + rmaUp / rmaDown))

//Strategy Calculations
sl = ((100 - sltp) / 100) * close
tp = ((100 + sltp) / 100) * close

var bool crossup = na
var bool crossdown = na
var float dir = na
var float BearGuy = 0

BullGuy = ta.barssince(crossup or crossdown)
if na(BullGuy)
    BearGuy += 1
else
    BearGuy := math.min(BullGuy, 4999)


rsiw = rsi_weight / 100
cew = half_weight / 100
atrw = atr_weight / 100

atr = hln(hclose, length) * atrw
ce = 1 / trendPersistence(hclose, length, smoothing)
com = 1 / math.max(math.abs(vawsi(hclose, length) - 50) * 2, 20)

comfin = (((com * rsiw) + (ce * cew) - atr)) * com_mult

lower = highest_custom(math.min((math.max(highest_custom(src, BearGuy) * (1 - comfin), sl)), src[1]), BearGuy)
upper = lowest_custom(math.max((math.min(lowest_custom(src, BearGuy) * (1 + comfin), tp)), src[1]), BearGuy)

var float thresh = na

if na(thresh)
    thresh := lower
if na(dir)
    dir := 1
if crossdown
    dir := -1
if crossup
    dir := 1
if dir == 1
    thresh := lower
if dir == -1
    thresh := upper

crossup := ta.crossover(hclose, thresh) and barstate.isconfirmed
crossdown := ta.crossunder(hclose, thresh) and barstate.isconfirmed

//STRATEGY
if crossup
    strategy.entry("long", strategy.long)
if crossdown
    strategy.entry("Short", strategy.short)

//PLOTTING
col = hclose > thresh ? color.lime : color.red
plot(thresh, linewidth = 2, color = color.new(col[1], 0))
Detail
https://www.fmz.com/strategy/454745
Last Modified
2024-06-21 15:36:43