
20 KiB
Name
TrippleMACD均线交叉与相对强弱指标结合的高频加密货币交易策略High-Frequency-Cryptocurrency-Trading-Strategy-Combining-TrippleMACD-Crossover-and-Relative-Strength-Index
Author
ChaoZhang
Strategy Description
 [trans]
概述
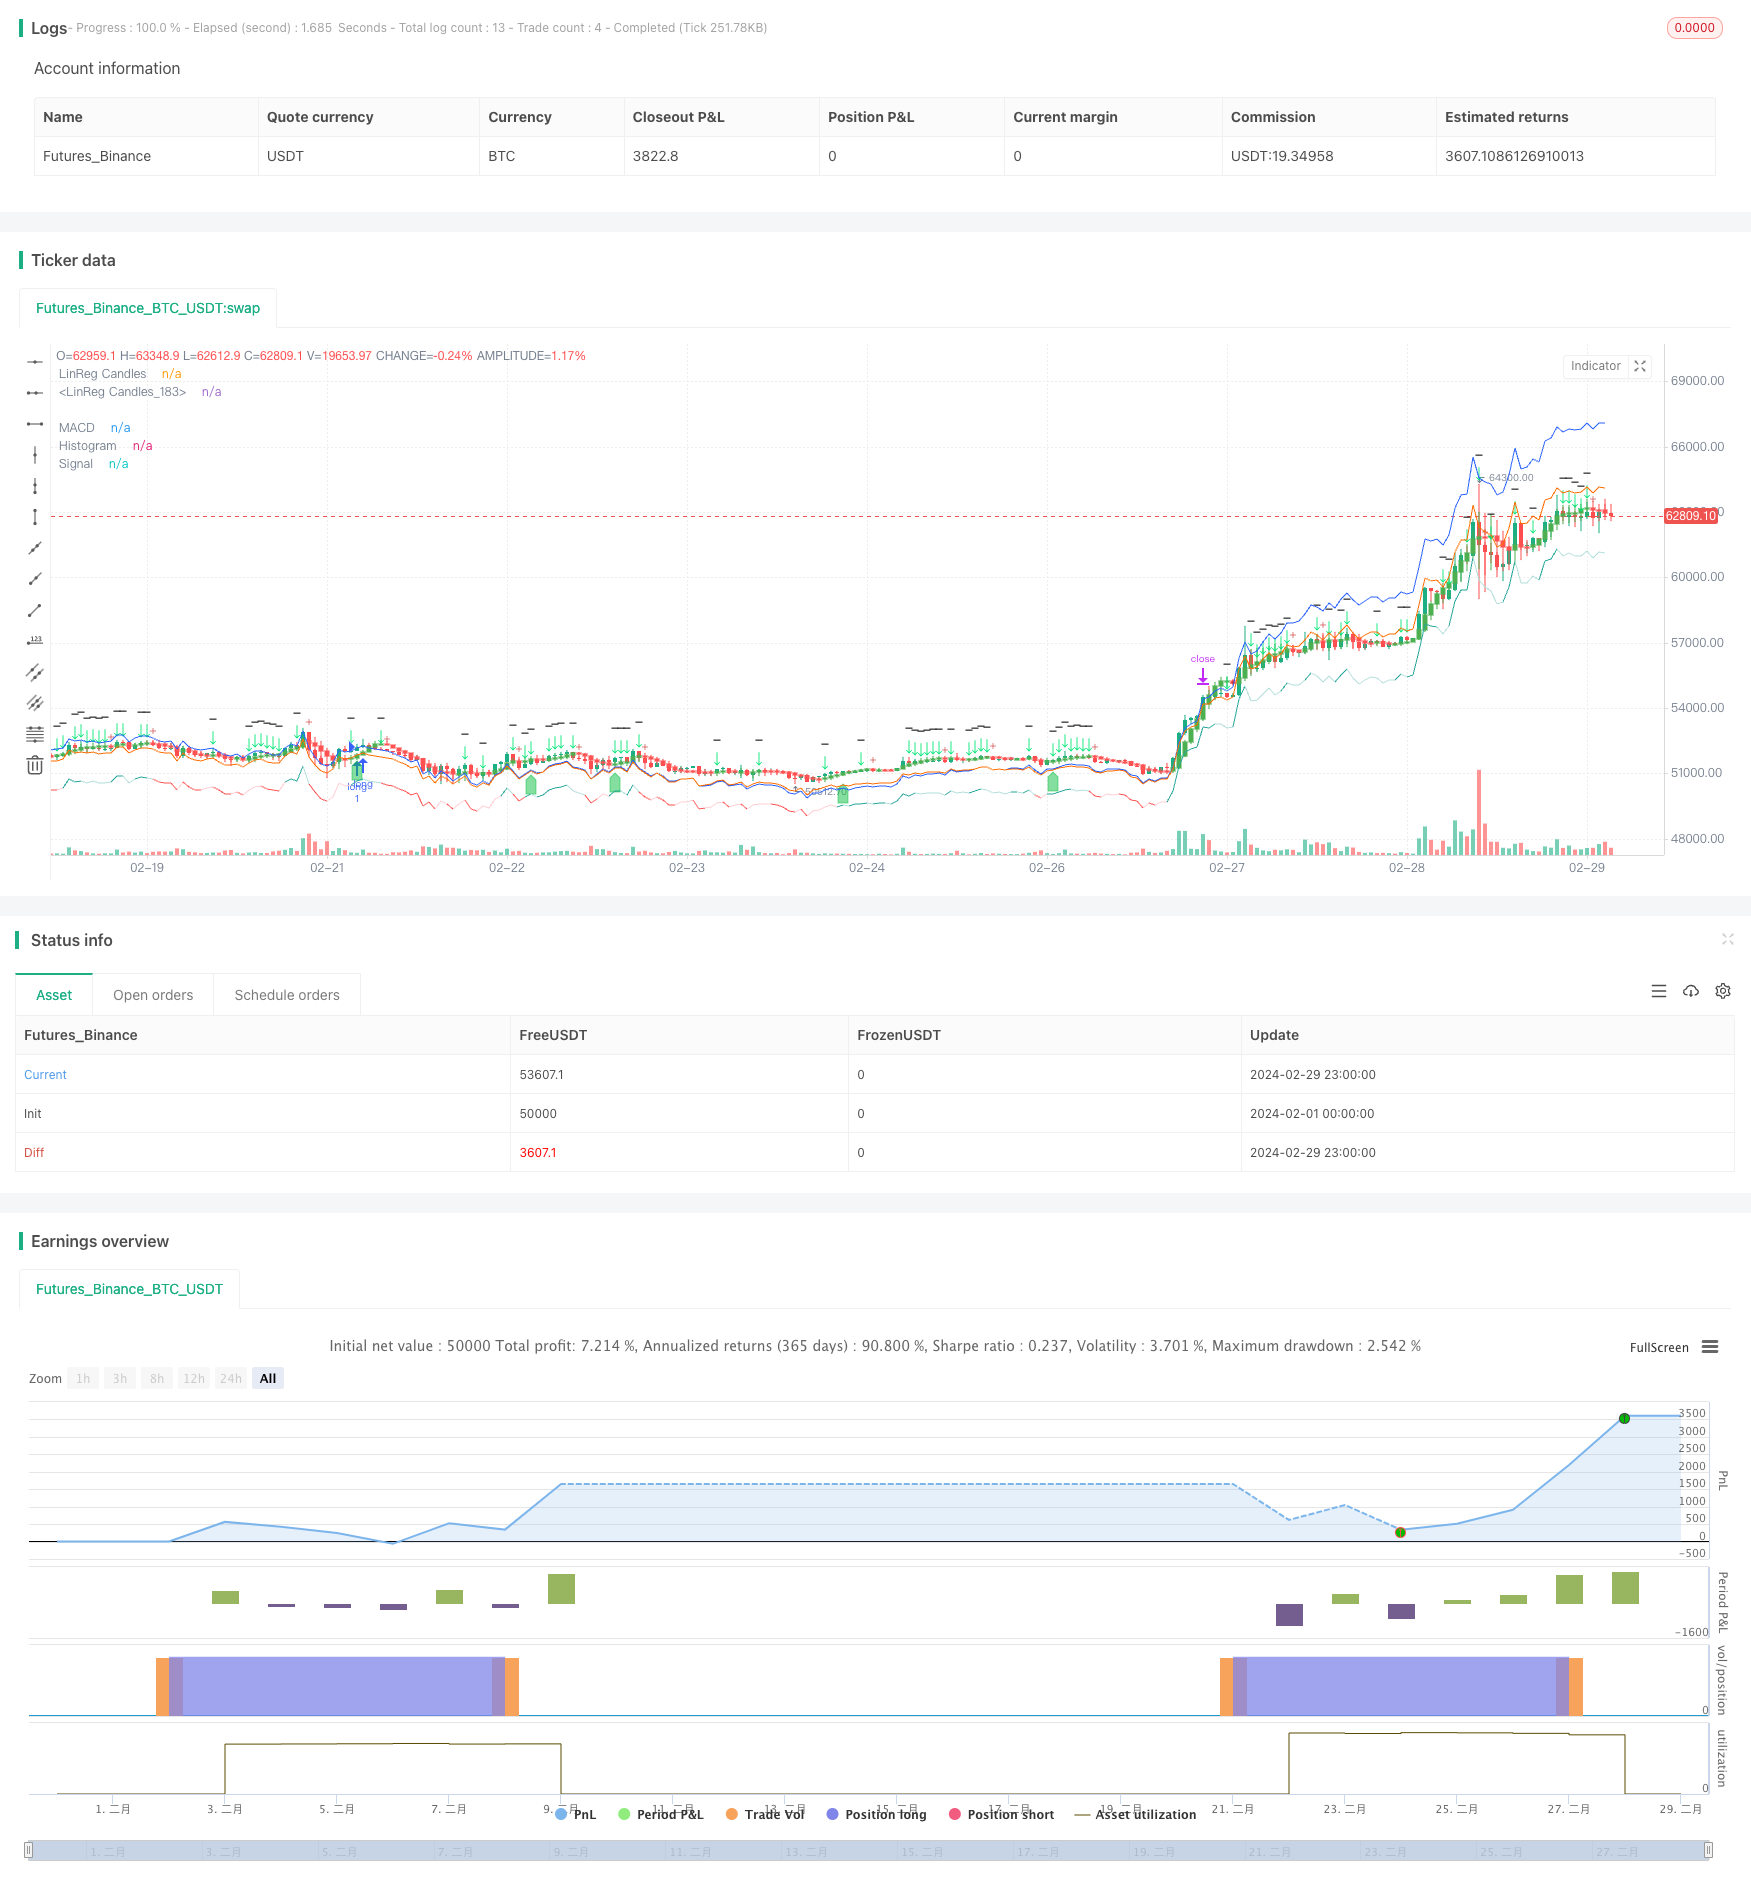
本文介绍了一种基于TrippleMACD均线交叉与相对强弱指标(RSI)结合的高频加密货币交易策略。该策略利用了三组不同参数的MACD指标,并对它们的信号线进行平均,同时结合RSI指标来确定最佳的买入和卖出时机。该策略专为1分钟时间框架的自动化交易设计,仅考虑多头交易。此外,该策略还利用线性回归来识别市场的盘整阶段,以避免在震荡行情中交易。
策略原理
该策略的核心是利用三组不同参数的MACD指标来捕捉不同时间尺度上的趋势信号。通过对这三组MACD指标的信号线进行平均,可以有效平滑噪音并提供更可靠的交易信号。同时,RSI指标被用来确认多头趋势的强度。只有当所有三组MACD指标都显示多头信号,并且RSI指标也确认了多头趋势的强度时,该策略才会发出买入信号。
此外,该策略还利用线性回归来识别市场的盘整阶段。通过计算蜡烛图上下影线与实体的比例,可以判断当前市场是否处于盘整状态。如果上下影线的长度是实体长度的两倍以上,则认为市场处于盘整阶段,此时该策略将避免交易。
优势分析
-
多时间尺度分析:通过使用三组不同参数的MACD指标,该策略可以捕捉不同时间尺度上的趋势信号,提高了交易的准确性和可靠性。
-
信号平滑:通过对三组MACD指标的信号线进行平均,可以有效平滑噪音,避免了单一指标可能产生的误导性信号。
-
趋势确认:结合RSI指标来确认多头趋势的强度,可以进一步提高交易信号的可靠性。
-
盘整识别:利用线性回归来识别市场的盘整阶段,可以避免在震荡行情中交易,降低了策略的风险。
-
自动化交易:该策略专为1分钟时间框架的自动化交易设计,可以快速响应市场变化并执行交易,提高了交易效率。
风险分析
-
参数优化:该策略涉及多个参数,如三组MACD指标的快慢线周期、RSI指标的周期等。这些参数的选择对策略性能有重要影响,如果参数优化不当,可能导致策略性能下降。
-
过拟合风险:该策略在特定的历史数据上可能表现良好,但在实际应用中可能无法适应市场变化,导致策略失效。
-
黑天鹅事件:该策略主要基于技术指标,对于一些重大的基本面事件可能反应不足,这可能导致策略在极端市场环境下表现不佳。
优化方向
-
动态参数调整:根据市场状况的变化,动态调整策略中的各项参数,如MACD指标的快慢线周期、RSI指标的周期等,以适应不同的市场环境。
-
加入更多指标:在现有的MACD和RSI指标基础上,可以考虑加入其他技术指标,如布林带、移动平均线等,以进一步提高交易信号的准确性和可靠性。
-
风险管理优化:在策略中加入更完善的风险管理措施,如动态止损、仓位管理等,以降低策略的整体风险。
-
机器学习优化:利用机器学习算法,如神经网络、支持向量机等,对策略的参数和交易规则进行优化,提高策略的适应性和稳健性。
总结
本文介绍了一种基于TrippleMACD均线交叉与RSI指标结合的高频加密货币交易策略。该策略利用了三组不同参数的MACD指标和RSI指标来生成可靠的交易信号,同时利用线性回归来识别市场的盘整阶段,以避免在震荡行情中交易。该策略的优势在于多时间尺度分析、信号平滑、趋势确认、盘整识别和自动化交易等方面,但也存在参数优化、过拟合和黑天鹅事件等风险。未来可以从动态参数调整、加入更多指标、风险管理优化和机器学习优化等方面对该策略进行改进,以提高其适应性和稳健性,更好地应对加密货币市场的变化。
||
Overview
This article introduces a high-frequency cryptocurrency trading strategy that combines TrippleMACD crossover with the Relative Strength Index (RSI). The strategy employs three sets of MACD indicators with different parameters and averages their signal lines, while also incorporating the RSI indicator to determine optimal buy and sell timings. The strategy is designed for automated trading on a 1-minute timeframe, considering only long trades. Additionally, the strategy utilizes linear regression to identify consolidation phases in the market, avoiding trades during choppy market conditions.
Strategy Principle
The core of this strategy is to utilize three sets of MACD indicators with different parameters to capture trend signals on various time scales. By averaging the signal lines of these three MACD indicators, noise can be effectively smoothed out, providing more reliable trading signals. At the same time, the RSI indicator is used to confirm the strength of bullish trends. The strategy generates a buy signal only when all three MACD indicators show bullish signals and the RSI indicator also confirms the strength of the bullish trend.
Furthermore, the strategy employs linear regression to identify consolidation phases in the market. By calculating the ratio of the upper and lower shadow lengths to the body length of candles, it can be determined whether the current market is in a consolidation state. If the length of the upper and lower shadows is more than twice the length of the body, the market is considered to be in a consolidation phase, and the strategy will avoid trading during this time.
Advantage Analysis
-
Multi-timeframe analysis: By using three sets of MACD indicators with different parameters, the strategy can capture trend signals on various time scales, improving the accuracy and reliability of trades.
-
Signal smoothing: Averaging the signal lines of the three MACD indicators effectively smooths out noise, avoiding misleading signals that may be generated by a single indicator.
-
Trend confirmation: Incorporating the RSI indicator to confirm the strength of bullish trends further enhances the reliability of trading signals.
-
Consolidation identification: Utilizing linear regression to identify consolidation phases in the market allows the strategy to avoid trading during choppy market conditions, reducing the strategy's risk.
-
Automated trading: The strategy is designed for automated trading on a 1-minute timeframe, enabling quick responses to market changes and efficient trade execution.
Risk Analysis
-
Parameter optimization: The strategy involves multiple parameters, such as the fast and slow line periods of the three MACD indicators and the period of the RSI indicator. The selection of these parameters has a significant impact on the strategy's performance. If the parameters are not optimized properly, the strategy's performance may decline.
-
Overfitting risk: The strategy may perform well on specific historical data but may fail to adapt to market changes in actual application, leading to strategy failure.
-
Black swan events: The strategy primarily relies on technical indicators and may not adequately respond to significant fundamental events, which could lead to poor performance in extreme market conditions.
Optimization Direction
-
Dynamic parameter adjustment: Dynamically adjust the parameters in the strategy, such as the fast and slow line periods of the MACD indicators and the period of the RSI indicator, based on changes in market conditions to adapt to different market environments.
-
Incorporate additional indicators: In addition to the existing MACD and RSI indicators, consider incorporating other technical indicators, such as Bollinger Bands and moving averages, to further improve the accuracy and reliability of trading signals.
-
Risk management optimization: Implement more comprehensive risk management measures in the strategy, such as dynamic stop-loss and position management, to reduce the overall risk of the strategy.
-
Machine learning optimization: Utilize machine learning algorithms, such as neural networks and support vector machines, to optimize the strategy's parameters and trading rules, enhancing the adaptability and robustness of the strategy.
Conclusion
This article introduces a high-frequency cryptocurrency trading strategy that combines TrippleMACD crossover with the RSI indicator. The strategy employs three sets of MACD indicators with different parameters and the RSI indicator to generate reliable trading signals while utilizing linear regression to identify consolidation phases in the market, avoiding trades during choppy market conditions. The strategy's advantages lie in multi-timeframe analysis, signal smoothing, trend confirmation, consolidation identification, and automated trading. However, it also faces risks such as parameter optimization, overfitting, and black swan events. In the future, the strategy can be improved through dynamic parameter adjustment, incorporating additional indicators, risk management optimization, and machine learning optimization to enhance its adaptability and robustness, better coping with changes in the cryptocurrency market.
[/trans]
Strategy Arguments
| Argument | Default | Description |
|---|---|---|
| v_input_1 | 1.04 | stopLuse |
| v_input_2 | 5 | Fast Length |
| v_input_3 | 8 | Slow Length |
| v_input_4 | 13 | Fast Length2 |
| v_input_5 | 21 | Slow Length2 |
| v_input_6 | 34 | Fast Length3 |
| v_input_7 | 144 | Slow Length3 |
| v_input_8 | 68 | Fast Length3 |
| v_input_9 | 288 | Slow Length3 |
| v_input_10_close | 0 | Source: close |
| v_input_int_3 | 11 | Signal Smoothing |
| v_input_int_4 | 9 | Signal Smoothing |
| v_input_string_2 | 0 | Oscillator MA Type: EMA |
| v_input_string_3 | 0 | Signal Line MA Type: EMA |
| v_input_bool_2 | true | Simple MA (Signal Line) |
| v_input_bool_3 | true | Lin Reg |
| v_input_int_5 | 11 | Linear Regression Length |
| v_input_int_1 | 14 | (?RSI Settings)RSI Length |
| v_input_source_1_close | 0 | Source: close |
| v_input_bool_1 | false | Show Divergence |
| v_input_string_1 | 0 | (?MA Settings)MA Type: SMA |
| v_input_int_2 | 14 | MA Length |
| v_input_float_1 | 2 | BB StdDev |
Source (PineScript)
/*backtest
start: 2024-02-01 00:00:00
end: 2024-02-29 23:59:59
period: 1h
basePeriod: 15m
exchanges: [{"eid":"Futures_Binance","currency":"BTC_USDT"}]
*/

//@version=5
//indicator("Triplle",shorttitle="Triplle MACD", overlay=true, scale = scale.none)
//indicator("Triplle","TrippleMACD",true)
strategy(title="TrippleMACD", shorttitle="TrippleMACD + RSI strategy", format=format.price, precision=4, overlay=true)

// RSI
ma(source, length, type) =>
    switch type
        "SMA" => ta.sma(source, length)
        "Bollinger Bands" => ta.sma(source, length)
        "EMA" => ta.ema(source, length)
        "SMMA (RMA)" => ta.rma(source, length)
        "WMA" => ta.wma(source, length)
        "VWMA" => ta.vwma(source, length)

rsiLengthInput = input.int(14, minval=1, title="RSI Length", group="RSI Settings")
rsiSourceInput = input.source(close, "Source", group="RSI Settings")
maTypeInput = input.string("SMA", title="MA Type", options=["SMA", "Bollinger Bands", "EMA", "SMMA (RMA)", "WMA", "VWMA"], group="MA Settings")
maLengthInput = input.int(14, title="MA Length", group="MA Settings")
bbMultInput = input.float(2.0, minval=0.001, maxval=50, title="BB StdDev", group="MA Settings")
showDivergence = input.bool(false, title="Show Divergence", group="RSI Settings")

up = ta.rma(math.max(ta.change(rsiSourceInput), 0), rsiLengthInput)
down = ta.rma(-math.min(ta.change(rsiSourceInput), 0), rsiLengthInput)
rsi = down == 0 ? 100 : up == 0 ? 0 : 100 - (100 / (1 + up / down))
rsiMA = ma(rsi, maLengthInput, maTypeInput)
isBB = maTypeInput == "Bollinger Bands"

//rsiPlot = plot(rsi, "RSI", color=#7E57C2)
//plot(rsiMA, "RSI-based MA", color=color.yellow)
//rsiUpperBand = hline(70, "RSI Upper Band", color=#787B86)
//midline = hline(50, "RSI Middle Band", color=color.new(#787B86, 50))
//rsiLowerBand = hline(30, "RSI Lower Band", color=#787B86)
//fill(rsiUpperBand, rsiLowerBand, color=color.rgb(126, 87, 194, 90), title="RSI Background Fill")
bbUpperBand = plot(isBB ? rsiMA + ta.stdev(rsi, maLengthInput) * bbMultInput : na, title = "Upper Bollinger Band", color=color.green)
bbLowerBand = plot(isBB ? rsiMA - ta.stdev(rsi, maLengthInput) * bbMultInput : na, title = "Lower Bollinger Band", color=color.green)
//fill(bbUpperBand, bbLowerBand, color= isBB ? color.new(color.green, 90) : na, title="Bollinger Bands Background Fill")

//midLinePlot = plot(50, color = na, editable = false, display = display.none)
//fill(rsiPlot, midLinePlot, 100, 70, top_color = color.new(color.green, 0), bottom_color = color.new(color.green, 100),  title = "Overbought Gradient Fill")
//fill(rsiPlot, midLinePlot, 30,  0,  top_color = color.new(color.red, 100), bottom_color = color.new(color.red, 0),      title = "Oversold Gradient Fill")

// Divergence
lookbackRight = 5
lookbackLeft = 5
rangeUpper = 60
rangeLower = 5
bearColor = color.red
bullColor = color.green
textColor = color.white
noneColor = color.new(color.white, 100)

plFound = na(ta.pivotlow(rsi, lookbackLeft, lookbackRight)) ? false : true
phFound = na(ta.pivothigh(rsi, lookbackLeft, lookbackRight)) ? false : true
_inRange(cond) =>
	bars = ta.barssince(cond == true)
	rangeLower <= bars and bars <= rangeUpper

//------------------------------------------------------------------------------
// Regular Bullish
// rsi: Higher Low

rsiHL = rsi[lookbackRight] > ta.valuewhen(plFound, rsi[lookbackRight], 1) and _inRange(plFound[1])

// Price: Lower Low

priceLL = low[lookbackRight] < ta.valuewhen(plFound, low[lookbackRight], 1)
bullCondAlert = priceLL and rsiHL and plFound
bullCond = showDivergence and bullCondAlert

// plot(
//      plFound ? rsi[lookbackRight] : na,
//      offset=-lookbackRight,
//      title="Regular Bullish",
//      linewidth=2,
//      color=(bullCond ? bullColor : noneColor)
//      )

// plotshape(
// 	 bullCond ? rsi[lookbackRight] : na,
// 	 offset=-lookbackRight,
// 	 title="Regular Bullish Label",
// 	 text=" Bull ",
// 	 style=shape.labelup,
// 	 location=location.absolute,
// 	 color=bullColor,
// 	 textcolor=textColor
// 	 )

//------------------------------------------------------------------------------
// Regular Bearish
// rsi: Lower High

rsiLH = rsi[lookbackRight] < ta.valuewhen(phFound, rsi[lookbackRight], 1) and _inRange(phFound[1])

// Price: Higher High

priceHH = high[lookbackRight] > ta.valuewhen(phFound, high[lookbackRight], 1)

bearCondAlert = priceHH and rsiLH and phFound
bearCond = showDivergence and bearCondAlert

// plot(
// 	 phFound ? rsi[lookbackRight] : na,
// 	 offset=-lookbackRight,
// 	 title="Regular Bearish",
// 	 linewidth=2,
// 	 color=(bearCond ? bearColor : noneColor)
// 	 )

// plotshape(
// 	 bearCond ? rsi[lookbackRight] : na,
// 	 offset=-lookbackRight,
// 	 title="Regular Bearish Label",
// 	 text=" Bear ",
// 	 style=shape.labeldown,
// 	 location=location.absolute,
// 	 color=bearColor,
// 	 textcolor=textColor
// 	 )
// END RSI

// Getting inputs
stopLuse          = input(1.040)
fast_length = input(title = "Fast Length", defval = 5)
slow_length = input(title = "Slow Length", defval = 8)
fast_length2 = input(title = "Fast Length2", defval = 13)
slow_length2 = input(title = "Slow Length2", defval = 21)
fast_length3 = input(title = "Fast Length3", defval = 34)
slow_length3 = input(title = "Slow Length3", defval = 144)
fast_length4 = input(title = "Fast Length3", defval = 68)
slow_length4 = input(title = "Slow Length3", defval = 288)
src = input(title = "Source", defval = close)
signal_length2 = input.int(title="Signal Smoothing", minval = 1, maxval = 200, defval = 11)
signal_length = input.int(title = "Signal Smoothing",  minval = 1, maxval = 50, defval = 9)
sma_source = input.string(title = "Oscillator MA Type",  defval = "EMA", options = ["SMA", "EMA"])
sma_signal = input.string(title = "Signal Line MA Type", defval = "EMA", options = ["SMA", "EMA"])
// Calculating
fast_ma = sma_source == "SMA" ? ta.sma(src, fast_length) : ta.ema(src, fast_length)
slow_ma = sma_source == "SMA" ? ta.sma(src, slow_length) : ta.ema(src, slow_length)

fast_ma2 = sma_source == "SMA2" ? ta.sma(src, fast_length2) : ta.ema(src, fast_length2)
slow_ma2 = sma_source == "SMA2" ? ta.sma(src, slow_length2) : ta.ema(src, slow_length2)

fast_ma3 = sma_source == "SMA3" ? ta.sma(src, fast_length3) : ta.ema(src, fast_length3)
slow_ma3 = sma_source == "SMA3" ? ta.sma(src, slow_length3) : ta.ema(src, slow_length3)

fast_ma4 = sma_source == "SMA3" ? ta.sma(src, fast_length3) : ta.ema(src, fast_length3)
slow_ma4 = sma_source == "SMA3" ? ta.sma(src, slow_length3) : ta.ema(src, slow_length3)

macd = fast_ma - slow_ma
macd2 = fast_ma2 - slow_ma2
macd3 = fast_ma3 - slow_ma3
macd4 = fast_ma4 - slow_ma4

signal = sma_signal == "SMA" ? ta.sma(macd, signal_length) : ta.ema(macd, signal_length)
signal2 = sma_signal == "SMA" ? ta.sma(macd2, signal_length) : ta.ema(macd2, signal_length)
signal3 = sma_signal == "SMA" ? ta.sma(macd3, signal_length) : ta.ema(macd3, signal_length)
signal4 = sma_signal == "SMA" ? ta.sma(macd4, signal_length) : ta.ema(macd4, signal_length)
//hist = (macd + macd2 + macd3)/1 - (signal + signal2 + signal3)/1
hist = (macd + macd2 + macd3 + macd4)/4 - (signal + signal2 + signal3 + signal4)/4
signal5 = (signal + signal2 + signal3)/3

sma_signal2 = input.bool(title="Simple MA (Signal Line)", defval=true)

lin_reg = input.bool(title="Lin Reg", defval=true)
linreg_length = input.int(title="Linear Regression Length", minval = 1, maxval = 200, defval = 11)

bopen = lin_reg ? ta.linreg(open, linreg_length, 0) : open
bhigh = lin_reg ? ta.linreg(high, linreg_length, 0) : high
blow = lin_reg ? ta.linreg(low, linreg_length, 0) : low
bclose = lin_reg ? ta.linreg(close, linreg_length, 0) : close

shadow = (bhigh - bclose) + (bopen - blow)
body = bclose - bopen
perc = (shadow/body)
cond2 = perc >=2 and bclose+bclose[1]/2 > bopen+bopen[1]/2

r = bopen < bclose

//signal5 = sma_signal2 ? ta.sma(bclose, signal_length) : ta.ema(bclose, signal_length)
plotcandle(r ? bopen : na, r ? bhigh : na, r ? blow: na, r ? bclose : na, title="LinReg Candles", color= color.green, wickcolor=color.green, bordercolor=color.green, editable= true)
plotcandle(r ? na : bopen, r ? na : bhigh, r ? na : blow, r ? na : bclose, title="LinReg Candles", color=color.red, wickcolor=color.red, bordercolor=color.red, editable= true)
//alertcondition(hist[1] >= 0 and hist < 0, title = 'Rising to falling', message = 'The MACD histogram switched from a rising to falling state')
//alertcondition(hist[1] <= 0 and hist > 0, title = 'Falling to rising', message = 'The MACD histogram switched from a falling to rising state')

green = hist >= 0 ? (hist[1] < hist ? "G" : "GL") : (hist[1] < hist ? "RL" : "R")
Buy = green == "G" and green[1] != "G" and green[1] != "GL" and bopen < bclose and rsi < 55.0 //and not cond2
//StopBuy = (green == "R" or green == "RL" or green == "RL") and bopen > bclose and bopen[1] < bclose[1]
StopBuy = bopen > bclose and bopen[1] < bclose[1] and (green == "G" or green == "GL" or green == "R") and bopen[2] < bclose[2] and bopen[3] < bclose[3]
hists = close[3] < close[2] and close[2] < close[1]
//Buy = green == "RL" and hist[0] > -0.07 and hist[0] < 0.00 and rsi < 55.0 and hists
//StopBuy = green == "GL" or green == "R"
alertcondition(Buy, "Long","Покупка в лонг")
alertcondition(StopBuy, "StopLong","Закрытие сделки")

//hline(0, "Zero Line", color = color.new(#787B86, 50))
plot(hist + (close - (close * 0.03)), title = "Histogram", style = plot.style_line, color = (hist >= 0 ? (hist[1] < hist ? #26A69A : #B2DFDB) : (hist[1] < hist ? #FFCDD2 : #FF5252)))
plotshape(Buy ? low : na, 'Buy', shape.labelup, location.belowbar , color=color.new(#0abe40, 50), size=size.small, offset=0)
plotshape(StopBuy ? low : na, 'Buy', shape.cross, location.abovebar , color=color.new(#be0a0a, 50), size=size.small, offset=0)
plot(macd4  + (close - (close * 0.01)),   title = "MACD",   color = #2962FF)
plot(signal5 + (close - (close * 0.01)), title = "Signal", color = #FF6D00)

plotchar(cond2 , char='↓', color = color.rgb(0, 230, 119), text = "-")

if (Buy)
    strategy.entry("long", strategy.long)

// if (startShortTrade)
//     strategy.entry("short", strategy.short)

profitTarget = strategy.position_avg_price * stopLuse
strategy.exit("Take Profit", "long", limit=profitTarget)
// strategy.exit("Take Profit", "short", limit=profitTarget)
Detail
https://www.fmz.com/strategy/445833
Last Modified
2024-03-22 15:41:46