
17 KiB
Name
SPY增强型空头信号策略-基于动态ATR目标优化的量化交易系统-SPY-Enhanced-Short-Signals-Strategy-Quantitative-Trading-System-with-Dynamic-ATR-Target-Optimization
Author
ianzeng123
Strategy Description
[trans]
概述
SPY增强型空头信号策略是一个基于5分钟时间框架的量化交易系统,专为SPY市场设计。该策略通过综合分析价格与阻力位的关系、RSI指标、MACD动量指标以及成交量等多维度因素,捕捉市场下跌信号。当价格接近阻力位且满足特定的看跌条件时(RSI低于45、MACD动量向下、成交量突破),系统会触发空头交易信号。该策略采用基于ATR(平均真实波幅)的动态退出机制,通过自适应的止盈止损设置来有效管理风险。策略的核心优势在于其精确的入场时机判断和风险控制能力,能够在市场下跌趋势中捕捉稳定的收益机会。
策略原理
该策略的运行原理基于多重技术指标的协同验证,主要包括以下几个关键要素:
-
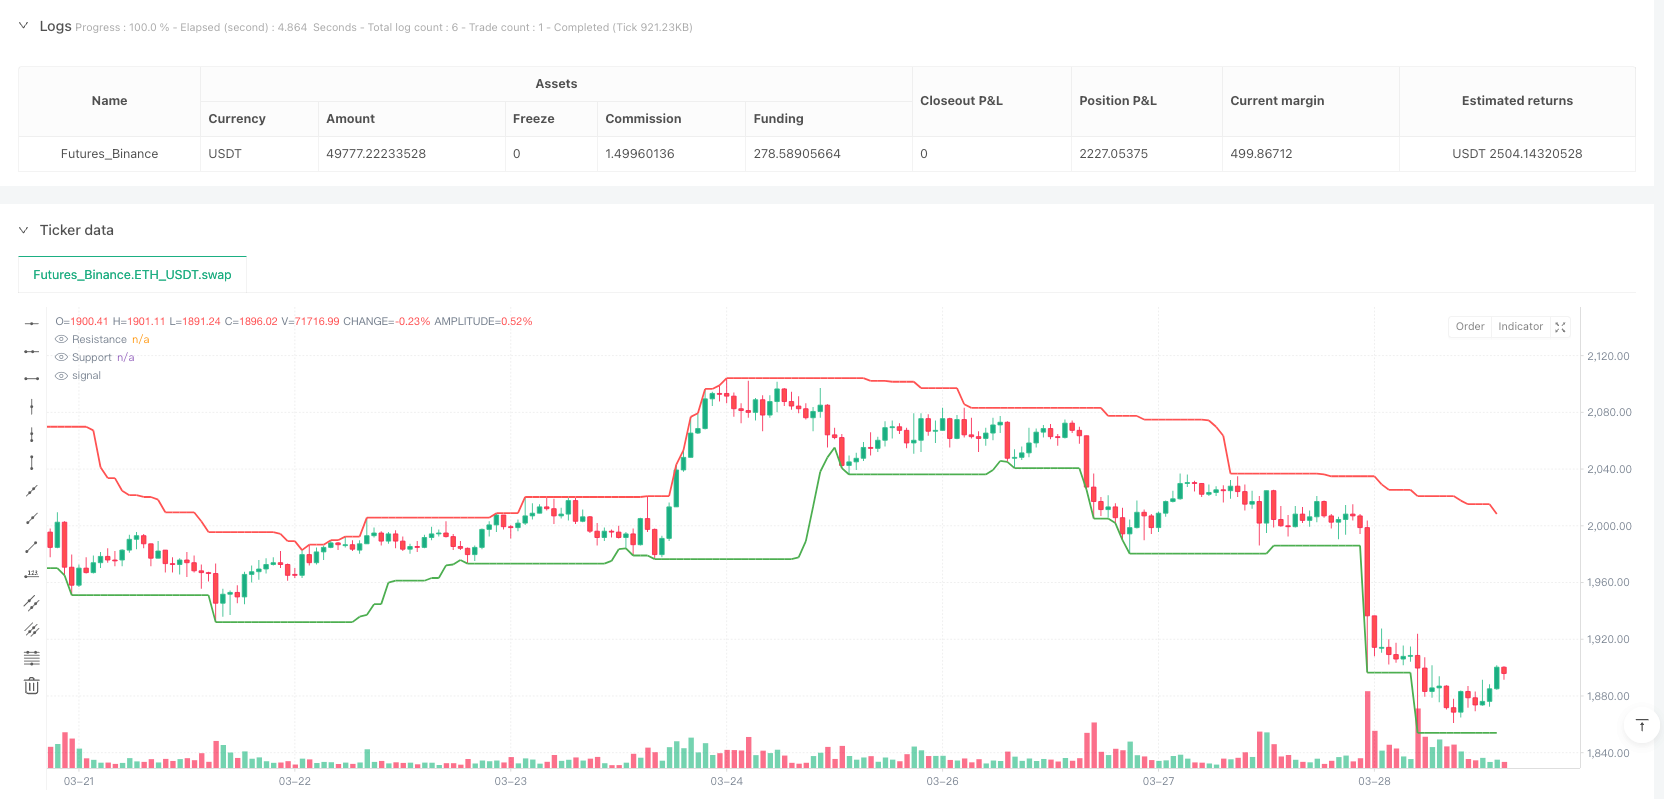
阻力位识别: 系统通过计算指定回溯期间(默认20个周期)的最高价来确定阻力位。当价格接近阻力位(位于阻力位下方1%范围内)或穿越阻力位向下时,满足第一个入场条件。
-
RSI过滤: 策略要求RSI(20周期)指标低于预设阈值(默认45),确保市场处于相对超卖或中性偏空的状态。
-
MACD动量确认: 使用MACD(12,26,9)指标判断动量方向,当MACD线低于信号线时,表明价格具有向下的动量,符合空头策略的方向。
-
成交量验证: 策略要求当前成交量超过20周期成交量简单移动平均线的特定倍数(默认1.5倍),确保有足够的市场参与度支持价格变动。
-
动态退出机制: 采用14周期ATR指标计算动态止盈和止损水平。止盈目标设置为入场价格减去ATR乘以利润乘数(默认1.5),止损水平为入场价格加上ATR乘以损失乘数(默认1.0)。
当所有条件同时满足时,策略触发空头入场信号,并根据预设的动态退出条件管理交易。
策略优势
-
多维度信号确认: 策略结合价格、技术指标和成交量进行多维度分析,有效过滤假信号,提高交易质量。价格靠近阻力位、RSI较低、MACD向下和成交量放大的组合条件,能够有效捕捉真实的做空机会。
-
精确的入场时机: 通过识别价格与阻力位的关系,策略能在技术性反转点位精确入场,提高获利概率。
-
动态风险管理: 采用基于ATR的动态止盈止损机制,使风险管理适应市场波动性,在高波动环境中提供更宽松的止损,在低波动环境中收紧止损,优化风险收益比。
-
自适应性强: 策略参数可调整性高,用户可以根据市场环境和个人风险偏好,调整RSI阈值、成交量倍数和ATR乘数等参数,实现策略的灵活优化。
-
专注于高质量交易: 策略条件较为严格,避免了过度交易,专注于捕捉高概率的做空机会,降低了交易成本和情绪干扰。
策略风险
-
假突破风险: 价格可能临时突破阻力位后迅速反弹,导致错误信号。解决方法是增加时间过滤器,要求价格在阻力位下方维持一定时间,或者增加确认信号如蜡烛形态分析。
-
逆势交易风险: 在强势上涨市场中做空可能面临持续上涨的挑战。建议增加长期趋势过滤器,在上升趋势中禁用或提高信号门槛。
-
参数敏感性: 策略性能对RSI阈值、成交量倍数等参数变化较为敏感。建议进行全面的历史回测和敏感性分析,找到最佳参数组合,并定期检查参数有效性。
-
流动性风险: 在交易量低的时段,成交量突破条件可能不可靠。解决方法是在交易时间选择上增加限制,避开市场流动性不足的时段。
-
动态止损不足: 单一的ATR乘数在不同市场环境下可能不够优化。可以考虑基于波动率的自适应ATR乘数,或结合趋势强度动态调整止损水平。
策略优化方向
-
趋势过滤: 增加长期趋势判断机制,如20/50周期均线关系或更长周期的趋势指标,确保策略在市场总体趋势方向上运行,避免逆势交易。这样可以提高胜率并减少不必要的损失。
-
时间过滤: 加入时间过滤功能,避开特定的市场时段如开盘前30分钟或重大经济数据发布期间,这些时段波动性通常不可预测,可能导致策略表现不佳。
-
自适应参数: 实现基于市场波动率的参数自适应机制,例如在波动率增加时提高RSI阈值或成交量倍数,使策略能够更好地适应市场环境变化。
-
增强信号确认: 考虑增加蜡烛图形态分析或价格行为模式识别,作为额外的确认信号,提高入场精度。例如,要求在入场点附近出现看跌蜡烛形态如"黄昏之星"或"看跌吞没形态"。
-
分批出场策略: 优化目前的单一出场机制,实现分批出场策略。例如,当价格达到一定盈利水平时,平仓一部分仓位,同时将剩余仓位的止损移至成本线或盈利位置,有效锁定部分利润并让利润继续增长。
-
多时间框架分析: 整合更高时间框架(如15分钟、1小时)的信号确认,确保短期信号与更大时间框架趋势一致,提高策略的稳健性。
总结
SPY增强型空头信号策略是一个基于多重技术指标和精确入场条件的高效量化交易系统。通过综合分析价格与阻力位关系、RSI、MACD动量和成交量变化,策略能够捕捉市场中具有高概率的做空机会。其基于ATR的动态风险管理机制为交易提供了自适应的止盈止损水平,有效平衡了风险和收益。
该策略的核心优势在于其严格的入场条件过滤和精确的时机把握,避免了过度交易和情绪干扰。同时,策略的自适应性和可调参数使其能够适应不同的市场环境。尽管如此,用户仍需注意假突破、逆势交易和参数敏感性等潜在风险,并根据实际交易表现进行针对性优化。
通过加入趋势过滤、时间过滤、自适应参数和多时间框架分析等优化措施,策略的表现可以进一步提升。总体而言,这是一个理念清晰、逻辑严密且具有实际应用价值的量化交易策略,适合经验丰富的交易者在适当风险管理下应用于实盘交易。 ||
Overview
The SPY Enhanced Short Signals Strategy is a quantitative trading system designed for the SPY market on a 5-minute timeframe. This strategy captures market downtrend signals through comprehensive analysis of price-resistance relationships, RSI indicator, MACD momentum, and volume factors. When price approaches resistance levels and meets specific bearish conditions (RSI below 45, downward MACD momentum, volume breakout), the system triggers short trade signals. The strategy employs a dynamic exit mechanism based on ATR (Average True Range) with adaptive take-profit and stop-loss settings for effective risk management. The core advantage lies in its precise entry timing and risk control capabilities, enabling consistent profit opportunities during market downtrends.
Strategy Principles
The strategy operates based on collaborative verification of multiple technical indicators, including these key elements:
-
Resistance Identification: The system determines resistance levels by calculating the highest price over a specified lookback period (default 20 periods). The first entry condition is met when price approaches resistance (within 1% below) or crosses below resistance.
-
RSI Filter: The strategy requires the RSI (20-period) indicator to be below a preset threshold (default 45), ensuring the market is in a relatively oversold or neutral-bearish state.
-
MACD Momentum Confirmation: Using the MACD (12,26,9) indicator to determine momentum direction, when the MACD line is below the signal line, it indicates downward price momentum, aligning with the short strategy direction.
-
Volume Verification: The strategy requires current volume to exceed the 20-period simple moving average of volume by a specific multiple (default 1.5x), ensuring sufficient market participation supports the price movement.
-
Dynamic Exit Mechanism: Using the 14-period ATR indicator to calculate dynamic take-profit and stop-loss levels. The take-profit target is set at entry price minus ATR multiplied by a profit multiplier (default 1.5), while the stop-loss level is entry price plus ATR multiplied by a loss multiplier (default 1.0).
When all conditions are simultaneously met, the strategy triggers a short entry signal and manages the trade according to preset dynamic exit conditions.
Strategy Advantages
-
Multi-dimensional Signal Confirmation: The strategy combines price, technical indicators, and volume for multi-dimensional analysis, effectively filtering false signals and improving trade quality. The combination of price near resistance, low RSI, downward MACD, and increased volume effectively captures genuine short opportunities.
-
Precise Entry Timing: By identifying the relationship between price and resistance levels, the strategy can enter precisely at technical reversal points, increasing profit probability.
-
Dynamic Risk Management: Using ATR-based dynamic take-profit and stop-loss mechanisms adapts risk management to market volatility, providing wider stops in high-volatility environments and tighter stops in low-volatility environments, optimizing the risk-reward ratio.
-
Strong Adaptability: The strategy features highly adjustable parameters, allowing users to adapt RSI thresholds, volume multipliers, and ATR multipliers according to market conditions and personal risk preferences for flexible strategy optimization.
-
Focus on High-Quality Trades: The strategy's strict conditions avoid overtrading, focusing on capturing high-probability short opportunities, reducing transaction costs and emotional interference.
Strategy Risks
-
False Breakout Risk: Prices may temporarily break through resistance levels before quickly rebounding, leading to false signals. The solution is to add time filters, requiring price to maintain below resistance for a certain period, or add confirmation signals such as candlestick pattern analysis.
-
Counter-trend Trading Risk: Shorting in strong upward markets may face challenges of continued upward movement. It's recommended to add long-term trend filters, disabling or raising signal thresholds during uptrends.
-
Parameter Sensitivity: Strategy performance is sensitive to changes in parameters such as RSI thresholds and volume multipliers. Comprehensive historical backtesting and sensitivity analysis are recommended to find optimal parameter combinations and regularly check parameter validity.
-
Liquidity Risk: During low-volume trading sessions, volume breakout conditions may be unreliable. The solution is to add restrictions on trading times, avoiding periods of insufficient market liquidity.
-
Inadequate Dynamic Stop-Loss: A single ATR multiplier may not be optimized across different market environments. Consider volatility-based adaptive ATR multipliers or dynamically adjusting stop-loss levels based on trend strength.
Strategy Optimization Directions
-
Trend Filtering: Add long-term trend judgment mechanisms, such as 20/50 period moving average relationships or longer-period trend indicators, ensuring the strategy operates in the overall market trend direction, avoiding counter-trend trading. This can improve win rates and reduce unnecessary losses.
-
Time Filtering: Incorporate time filtering functionality to avoid specific market periods such as 30 minutes before market open or during major economic data releases, when volatility is typically unpredictable and may lead to poor strategy performance.
-
Adaptive Parameters: Implement parameter adaptation mechanisms based on market volatility, such as increasing RSI thresholds or volume multipliers when volatility increases, allowing the strategy to better adapt to changing market environments.
-
Enhanced Signal Confirmation: Consider adding candlestick pattern analysis or price action pattern recognition as additional confirmation signals to improve entry precision. For example, require bearish candlestick formations such as "evening star" or "bearish engulfing pattern" near entry points.
-
Scaled Exit Strategy: Optimize the current single exit mechanism with a scaled exit strategy. For example, close part of the position when price reaches certain profit levels, while moving the stop-loss for remaining positions to breakeven or profit, effectively locking in partial profits while allowing for continued growth.
-
Multi-timeframe Analysis: Integrate signal confirmation from higher timeframes (such as 15-minute, 1-hour), ensuring short-term signals align with larger timeframe trends, improving strategy robustness.
Conclusion
The SPY Enhanced Short Signals Strategy is an efficient quantitative trading system based on multiple technical indicators and precise entry conditions. Through comprehensive analysis of price-resistance relationships, RSI, MACD momentum, and volume changes, the strategy captures high-probability shorting opportunities in the market. Its ATR-based dynamic risk management mechanism provides adaptive take-profit and stop-loss levels, effectively balancing risk and reward.
The strategy's core advantages lie in its strict entry condition filtering and precise timing, avoiding overtrading and emotional interference. Meanwhile, the strategy's adaptability and adjustable parameters allow it to accommodate different market environments. Nevertheless, users should remain aware of potential risks such as false breakouts, counter-trend trading, and parameter sensitivity, making targeted optimizations based on actual trading performance.
By incorporating trend filtering, time filtering, adaptive parameters, and multi-timeframe analysis, the strategy's performance can be further enhanced. Overall, this is a quantitative trading strategy with clear concepts, rigorous logic, and practical application value, suitable for experienced traders to apply in live trading under appropriate risk management.[/trans]
Source (PineScript)
/*backtest
start: 2024-03-31 00:00:00
end: 2025-03-29 08:00:00
period: 1h
basePeriod: 1h
exchanges: [{"eid":"Futures_Binance","currency":"ETH_USDT"}]
*/

//@version=6
strategy("SPY Enhanced Short Signals – Fixed", overlay=true, initial_capital=100000, default_qty_type=strategy.percent_of_equity, default_qty_value=10)

// ===== Inputs =====
length = input.int(20, "Lookback Period", minval=5)
rsiThreshold = input.float(45, "RSI Threshold", minval=1, maxval=50)
volMultiplier = input.float(1.5, "Volume Spike Multiplier", step=0.1)

// ATR multipliers for dynamic exits
atrProfitMultiplier = input.float(1.5, "ATR Profit Multiplier", step=0.1)
atrLossMultiplier   = input.float(1.0, "ATR Stop Loss Multiplier", step=0.1)

// ===== Level Calculations =====
support = ta.lowest(low, length)
resistance = ta.highest(high, length)

// ===== Short Entry Conditions =====
// nearResistance: Price is within 1% *below* resistance.
nearResistance = close >= resistance * 0.99
// bearishRSI: RSI (period 20) must be below the specified threshold.
bearishRSI = ta.rsi(close, 20) < rsiThreshold

// MACD for momentum
[macdLine, signalLine, _] = ta.macd(close, 12, 26, 9)
bearishMomentum = macdLine < signalLine

// Volume spike: volume exceeds the 20-period SMA times the multiplier.
volSMA = ta.sma(volume, 20)
volumeSpike = volume > volSMA * volMultiplier

// Compute the crossunder result once and assign it to a global variable.
crossunderRes = ta.crossunder(close, resistance)

// Combine conditions: Enter short if either nearResistance or a crossunder occurs, and RSI, MACD, and volume conditions are met.
enterShort = (nearResistance or crossunderRes) and bearishRSI and bearishMomentum and volumeSpike

// ===== Dynamic Exit Conditions =====
dynamicATR = ta.atr(14)
dynamicProfit = dynamicATR * atrProfitMultiplier
dynamicLoss   = dynamicATR * atrLossMultiplier

// ===== Execute Short Trade =====
if (enterShort)
    strategy.entry("Short", strategy.short)
    strategy.exit("Exit Short", "Short", limit = strategy.position_avg_price - dynamicProfit, stop = strategy.position_avg_price + dynamicLoss)

// ===== Plotting =====
plot(resistance, title="Resistance", color=color.red, linewidth=2)
plot(support, title="Support", color=color.green, linewidth=2)
plotshape(enterShort, title="SELL Signal", style=shape.triangledown, location=location.abovebar, color=color.red, size=size.small, text="SELL")
Detail
https://www.fmz.com/strategy/488882
Last Modified
2025-03-31 15:40:06