
9.4 KiB
Name
SMC市场高低点突破策略-SMC-Market-High-Low-Breakout-Strategy
Author
ChaoZhang
Strategy Description
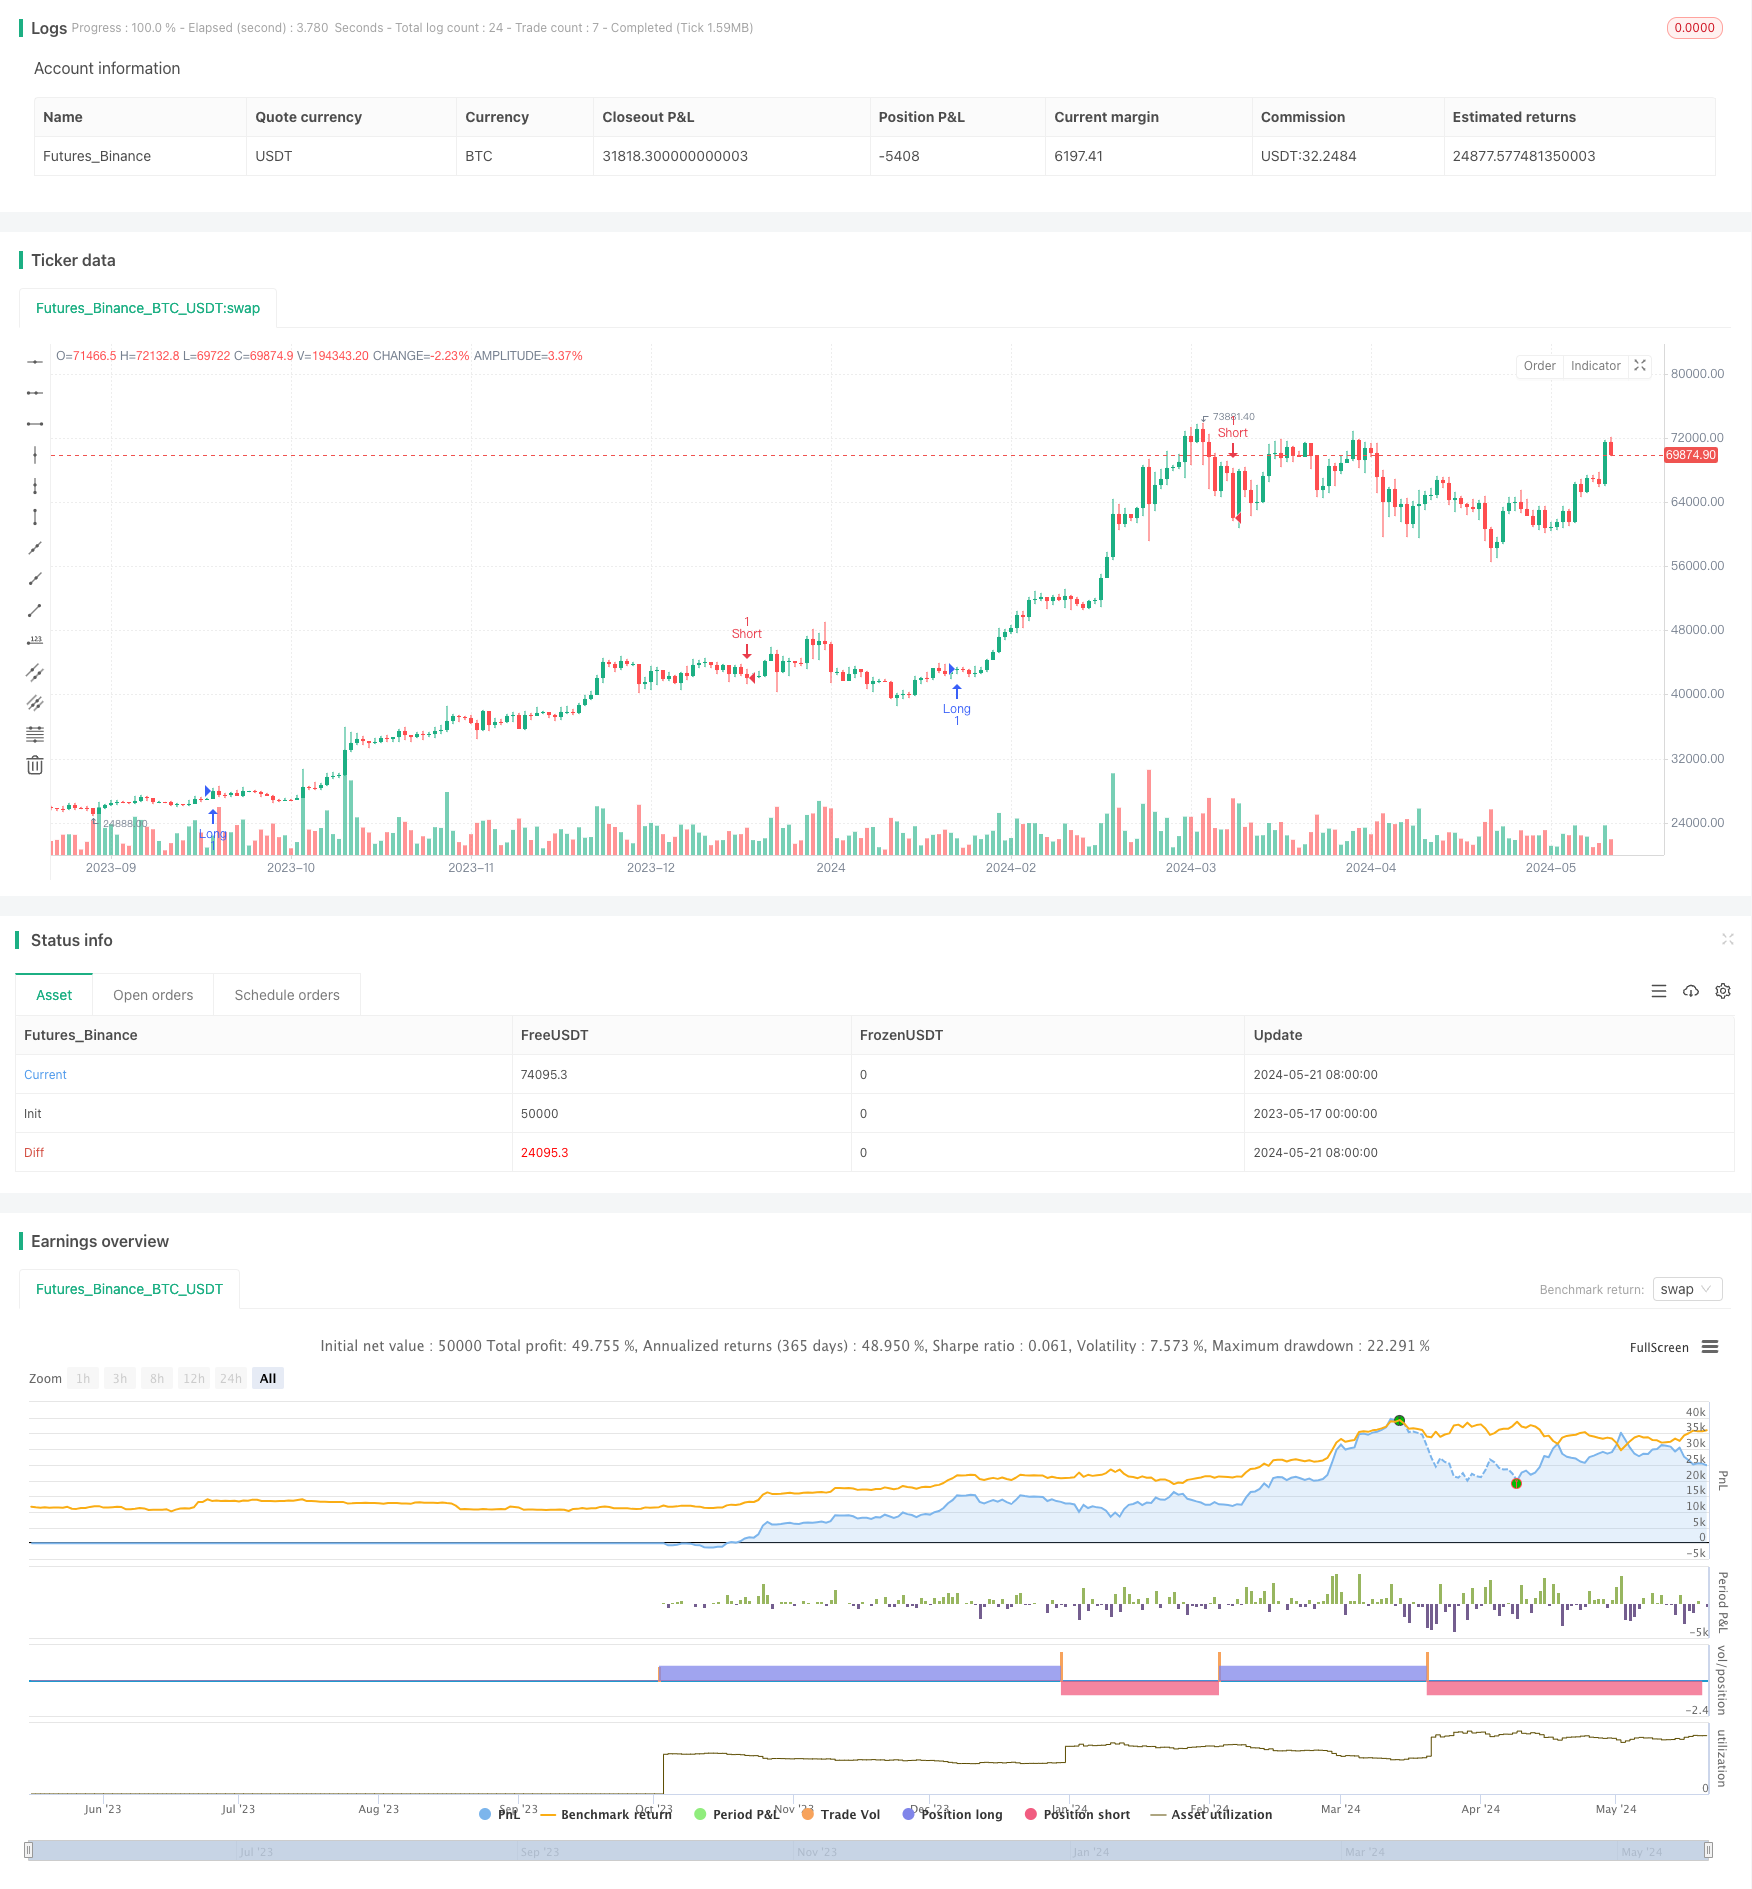
[trans]
概述
SMC市场高低点突破策略是一个基于高级市场概念(SMC)原理的量化交易策略。该策略在高级别时间框架中识别重要的买卖压力区域(订单区块),并在当前时间框架中寻找最佳的突破点入场。这与SMC原理相一致,即这些区块通常作为支撑位或阻力位。策略同时考虑了趋势方向、诱导形态和风险回报比,以优化进场点位和盈亏比。
策略原理
- 在高级别时间框架(如1小时图)中识别上升趋势和下降趋势。上升趋势定义为收盘价高于前一周期收盘价,且低点高于前一周期低点。下降趋势则相反。
- 在高级别时间框架中寻找诱导形态。多头诱导形态为在上升趋势中,前一周期高点高于前两周期和前三周期高点。空头诱导形态则在下降趋势中,前一周期低点低于前两周期和前三周期低点。
- 在高级别时间框架中识别订单区块。在多头诱导形态后,将该周期的最高价和最低价定义为订单区块的上下边界。空头诱导形态则相反。
- 在当前时间框架(如15分钟图)中寻找最佳进场点。多头进场为当前收盘价突破订单区块下沿,且前一周期收盘价在区块内。空头进场则为收盘价跌破订单区块上沿。
- 设置止损和止盈。止损位置为订单区块的边界,止盈根据设定的风险回报比(如1:1.5)计算。
策略优势
- 基于SMC原理,在高级别时间框架中捕捉主要趋势和关键支撑阻力位,避免了在低级别时间框架中的市场噪音干扰。
- 诱导形态的识别有助于判断趋势强度和可持续性,为进场提供更多依据。
- 在当前时间框架中精确突破进场,减少无效信号和回撤风险。
- 灵活的风险回报比设置,可根据个人风险偏好进行调整。
策略风险
- 在震荡市或趋势反转初期,该策略可能面临一定回撤风险。
- 极端行情下(如급涨急跌),订单区块可能失效,导致止损位过于宽松。
- 仅考虑价格行为,忽略了成交量等其他重要指标,判断可能存在偏差。
策略优化方向
- 引入更多高级别时间框架(如日线、周线)作为过滤,确保捕捉长期趋势。
- 在识别趋势和诱导形态时,可结合均线系统、动量指标等,提高判断准确性。
- 对订单区块边界进行动态优化,如考虑ATR(平均真实波幅)或通道宽度,以应对不同市场状态。
- 进场后可设置移动止损,如跟踪ATR或SAR(抛物线指标),以降低持仓风险。
- 考虑市场情绪指标(如 VIX)或宏观经济数据,以识别可能的趋势反转或黑天鹅事件。
总结
SMC市场高低点突破策略是一个基于SMC原理的量化交易策略,通过在高级别时间框架中识别关键压力区域,并在当前时间框架中寻找最佳突破点入场。该策略综合考虑了趋势方向、诱导形态和风险回报比,以优化进场点位和盈亏比。策略优势在于基于高级别时间框架过滤噪音,精确捕捉趋势,并具有灵活的风险管理功能。但在震荡市或趋势反转初期,策略可能面临一定回撤风险。未来可通过引入更多时间框架、优化订单区块边界、动态止损以及考虑市场情绪等方面进行优化,以提高策略稳健性和适应性。
||
Overview
The SMC Market High-Low Breakout Strategy is a quantitative trading strategy based on the principles of Superior Market Concepts (SMC). It identifies significant buying/selling pressure areas (order blocks) on higher timeframes and seeks optimal breakout entry points on the current timeframe. This aligns with the SMC principle that these blocks often act as support or resistance levels. The strategy considers trend direction, inducement patterns, and risk-reward ratio to optimize entry levels and profit targets.
Strategy Principles
- Identify uptrends and downtrends on the higher timeframe (e.g., 1-hour chart). An uptrend is defined as a higher close and higher low compared to the previous period. A downtrend is the opposite.
- Look for inducement patterns on the higher timeframe. A bullish inducement occurs in an uptrend when the previous high is higher than the highs of the past two and three periods. A bearish inducement occurs in a downtrend when the previous low is lower than the lows of the past two and three periods.
- Identify order blocks on the higher timeframe. After a bullish inducement, the high and low of that period define the upper and lower boundaries of the order block. The opposite applies to a bearish inducement.
- Find optimal entry points on the current timeframe (e.g., 15-minute chart). A long entry occurs when the current close breaks above the lower boundary of the order block, and the previous close is within the block. A short entry occurs when the close breaks below the upper boundary.
- Set stop-loss and take-profit levels. The stop-loss is placed at the boundary of the order block, while the take-profit is calculated based on the set risk-reward ratio (e.g., 1:1.5).
Strategy Advantages
- Based on SMC principles, it captures major trends and key support/resistance levels on higher timeframes, avoiding noise interference on lower timeframes.
- Identifying inducement patterns helps gauge trend strength and sustainability, providing more basis for entry.
- Precise breakout entries on the current timeframe reduce false signals and drawdown risks.
- Flexible risk-reward ratio settings can be adjusted according to individual risk preferences.
Strategy Risks
- During market consolidation or early trend reversals, the strategy may face drawdown risks.
- In extreme market conditions (e.g., sharp rises or falls), order blocks may become invalid, leading to overly loose stop-losses.
- Considering only price action and ignoring other important indicators like volume may lead to biased judgments.
Strategy Optimization Directions
- Introduce more higher timeframes (e.g., daily, weekly) for filtering to ensure capturing long-term trends.
- Combine moving average systems, momentum indicators, etc., to improve the accuracy of trend and inducement pattern identification.
- Dynamically optimize order block boundaries, such as considering Average True Range (ATR) or channel width, to adapt to different market conditions.
- Implement trailing stop-losses after entry, such as tracking ATR or Parabolic SAR, to reduce holding risks.
- Consider market sentiment indicators (e.g., VIX) or macroeconomic data to identify potential trend reversals or black swan events.
Summary
The SMC Market High-Low Breakout Strategy is a quantitative trading strategy based on SMC principles. It identifies key pressure areas on higher timeframes and seeks optimal breakout entry points on the current timeframe. The strategy comprehensively considers trend direction, inducement patterns, and risk-reward ratio to optimize entry levels and profit targets. Its advantages lie in filtering out noise based on higher timeframes, precisely capturing trends, and providing flexible risk management features. However, the strategy may face drawdown risks during market consolidation or early trend reversals. Future optimizations can introduce more timeframes, optimize order block boundaries, implement dynamic stop-losses, and consider market sentiment to improve the strategy's robustness and adaptability. [/trans]
Source (PineScript)
//@version=5
strategy("SMC Indian Market Strategy", overlay=true)

// Input Parameters
htf = input.timeframe("60", title="Higher Timeframe")  // For Inducement & Order Block
riskRewardRatio = input.float(1.5, title="Risk:Reward Ratio", minval=0.1)

// Higher Timeframe Data
[htfOpen, htfHigh, htfLow, htfClose] = request.security(syminfo.tickerid, htf, [open, high, low, close])

// Trend Identification (HTF)
bool htfUptrend = htfClose > htfClose[1] and htfLow > htfLow[1]  // Price action
bool htfDowntrend = htfClose < htfClose[1] and htfHigh < htfHigh[1]

// Inducement Identification (HTF)
bool htfInducementHigh = htfUptrend and high[1] > high[2] and high[1] > high[3]
bool htfInducementLow = htfDowntrend and low[1] < low[2] and low[1] < low[3]
float inducementLevel = htfInducementHigh ? high[1] : htfInducementLow ? low[1] : na

// Order Block Identification (HTF)
var float htfOBHigh = na // Highest high within the order block
var float htfOBLow = na  // Lowest low within the order block

if htfInducementHigh
    htfOBHigh := htfHigh
    htfOBLow := htfLow
else if htfInducementLow
    htfOBHigh := htfHigh
    htfOBLow := htfLow

// Optimal Entry (Current Timeframe)
bool longEntry = htfUptrend and close > htfOBLow and close[1] < htfOBLow  // Break of OB low
bool shortEntry = htfDowntrend and close < htfOBHigh and close[1] > htfOBHigh  // Break of OB high

// Stop Loss and Take Profit
float longSL = htfOBLow
float longTP = close + (close - longSL) * riskRewardRatio
float shortSL = htfOBHigh
float shortTP = close - (shortSL - close) * riskRewardRatio

// Strategy Execution
if longEntry
    strategy.entry("Long", strategy.long, stop=longSL, limit=longTP)
else if shortEntry
    strategy.entry("Short", strategy.short, stop=shortSL, limit=shortTP)
Detail
https://www.fmz.com/strategy/452277
Last Modified
2024-05-23 18:04:59