
9.8 KiB
Name
SMA双均线交叉策略-SMA-Dual-Moving-Average-Crossover-Strategy
Author
ChaoZhang
Strategy Description
[trans]
概述
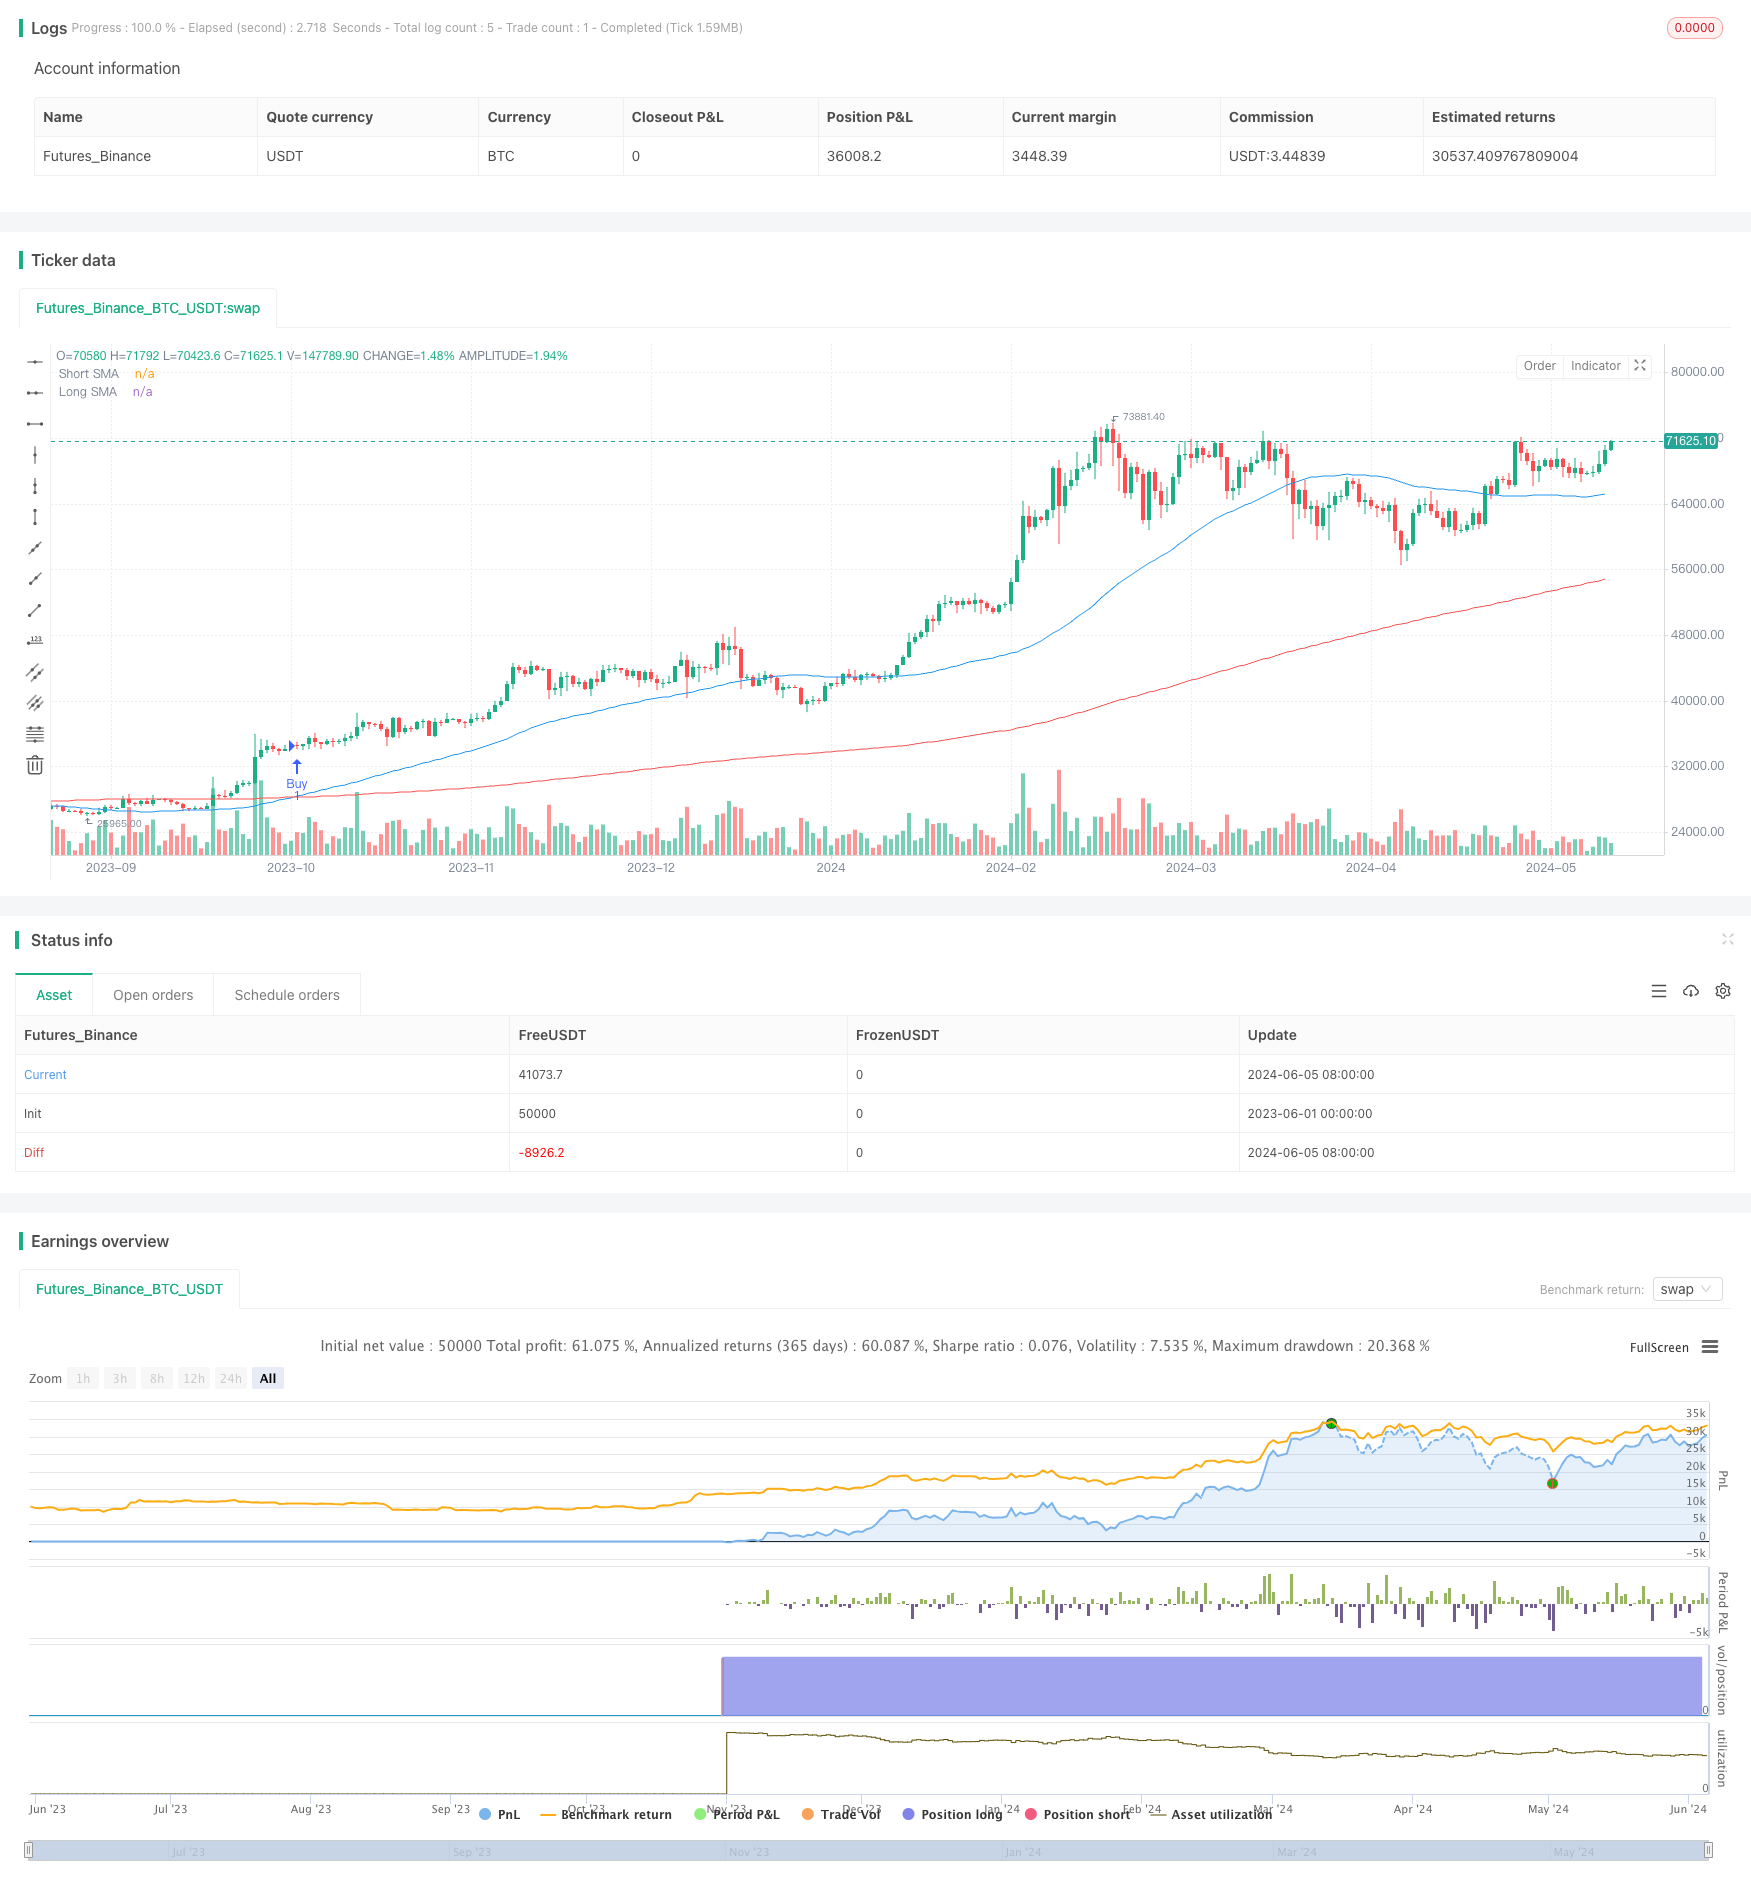
该策略是一种基于双均线交叉原理的量化交易策略。策略通过计算两条不同周期的简单移动平均线(SMA),当短期SMA上穿长期SMA时产生买入信号,当短期SMA下穿长期SMA时产生卖出信号。该策略代码还引入了日期范围和时间框架的设置,可以灵活地对策略进行回测和优化。
策略原理
该策略的核心原理是利用不同周期的移动平均线之间的交叉关系来捕捉价格趋势的变化。移动平均线是一种常用的技术指标,通过对过去一段时间内的价格进行平均,可以滤除短期波动,反映价格的整体趋势。当短期移动平均线上穿长期移动平均线时,表明价格可能开始出现上升趋势,此时产生买入信号;反之,当短期移动平均线下穿长期移动平均线时,表明价格可能开始出现下降趋势,此时产生卖出信号。
策略优势
- 简单易懂:该策略基于移动平均线的交叉原理,逻辑清晰,易于理解和实现。
- 适应性强:通过调整短期和长期移动平均线的周期参数,可以适应不同的市场和交易品种。
- 趋势跟踪:移动平均线能够有效地捕捉价格的整体趋势,有助于在趋势形成的早期阶段进行交易。
- 可自定义:该策略代码提供了日期范围和时间框架的设置,可以灵活地对策略进行回测和优化。
策略风险
- 参数敏感:策略的表现可能对移动平均线的周期参数较为敏感,不同的参数设置可能导致不同的结果。
- 频繁交易:当市场波动较大或者处于震荡区间时,该策略可能会产生较多的交易信号,导致频繁交易和高额手续费。
- 滞后效应:移动平均线存在一定的滞后性,可能在趋势已经形成后才产生交易信号,错过最佳入场时机。
- 突发事件:该策略主要依赖历史价格数据,对于突发的重大事件可能反应不足。
策略优化方向
- 引入其他技术指标:可以考虑将其他技术指标如RSI、MACD等与移动平均线结合,提高交易信号的可靠性。
- 优化参数选择:对短期和长期移动平均线的周期参数进行优化,找到适合特定市场和交易品种的最佳参数组合。
- 增加过滤条件:引入交易量、波动率等额外的过滤条件,过滤掉一些可能的假信号。
- 动态调整参数:根据市场状态的变化,动态调整移动平均线的周期参数,以适应不同的市场环境。
- 加入风险管理:设置合理的止损和止盈规则,控制单笔交易的风险敞口,提高策略的风险调整后收益。
总结
该SMA双均线交叉策略是一种简单易懂、适应性强的量化交易策略。通过利用不同周期移动平均线的交叉关系,策略能够有效地捕捉价格趋势的变化,为交易者提供买入和卖出信号。但是,策略的表现可能对参数选择较为敏感,并且在市场波动较大时可能产生频繁交易和滞后效应。为了进一步优化策略,可以考虑引入其他技术指标、优化参数选择、增加过滤条件、动态调整参数和加入风险管理等措施。总的来说,该策略可以作为量化交易的基础策略之一,但在实际应用中还需要根据具体情况进行适当的优化和改进。
||
Overview
This strategy is a quantitative trading strategy based on the principle of dual moving average crossover. The strategy generates buy signals when the short-term SMA crosses above the long-term SMA, and generates sell signals when the short-term SMA crosses below the long-term SMA. The strategy code also introduces settings for date range and timeframe, allowing flexible backtesting and optimization of the strategy.
Strategy Principle
The core principle of this strategy is to capture changes in price trends by utilizing the crossover relationship between moving averages of different periods. Moving average is a commonly used technical indicator that filters out short-term fluctuations and reflects the overall price trend by averaging prices over a past period of time. When the short-term moving average crosses above the long-term moving average, it indicates that the price may start an upward trend, generating a buy signal; conversely, when the short-term moving average crosses below the long-term moving average, it indicates that the price may start a downward trend, generating a sell signal.
Strategy Advantages
- Simple and easy to understand: The strategy is based on the principle of moving average crossover, with clear logic and easy to understand and implement.
- High adaptability: By adjusting the period parameters of short-term and long-term moving averages, it can adapt to different markets and trading instruments.
- Trend tracking: Moving averages can effectively capture the overall trend of prices, helping to trade in the early stages of trend formation.
- Customizable: The strategy code provides settings for date range and timeframe, allowing flexible backtesting and optimization of the strategy.
Strategy Risks
- Parameter sensitivity: The performance of the strategy may be sensitive to the period parameters of the moving averages, and different parameter settings may lead to different results.
- Frequent trading: When the market is highly volatile or in a fluctuating range, the strategy may generate more trading signals, resulting in frequent trading and high transaction fees.
- Lag effect: Moving averages have a certain lag, and trading signals may be generated only after the trend has formed, missing the best entry point.
- Unexpected events: The strategy mainly relies on historical price data and may not respond sufficiently to sudden major events.
Strategy Optimization Directions
- Introduce other technical indicators: Consider combining other technical indicators such as RSI, MACD, etc. with moving averages to improve the reliability of trading signals.
- Optimize parameter selection: Optimize the period parameters of short-term and long-term moving averages to find the best parameter combination suitable for specific markets and trading instruments.
- Add filtering conditions: Introduce additional filtering conditions such as trading volume and volatility to filter out some possible false signals.
- Dynamic parameter adjustment: Dynamically adjust the period parameters of moving averages according to changes in market conditions to adapt to different market environments.
- Incorporate risk management: Set reasonable stop-loss and take-profit rules, control the risk exposure of a single transaction, and improve the risk-adjusted return of the strategy.
Summary
The SMA dual moving average crossover strategy is a simple, easy-to-understand, and highly adaptable quantitative trading strategy. By utilizing the crossover relationship of moving averages with different periods, the strategy can effectively capture changes in price trends and provide buy and sell signals for traders. However, the performance of the strategy may be sensitive to parameter selection, and it may generate frequent trading and lag effects when the market is highly volatile. To further optimize the strategy, measures such as introducing other technical indicators, optimizing parameter selection, adding filtering conditions, dynamically adjusting parameters, and incorporating risk management can be considered. Overall, this strategy can serve as one of the basic strategies for quantitative trading, but it needs to be appropriately optimized and improved according to specific situations in practical application. [/trans]
Source (PineScript)
/*backtest
start: 2023-06-01 00:00:00
end: 2024-06-06 00:00:00
period: 1d
basePeriod: 1h
exchanges: [{"eid":"Futures_Binance","currency":"BTC_USDT"}]
*/

//@version=5
strategy("SMA Crossover Strategy with Date Range and Timeframe", overlay=true, default_qty_type=strategy.fixed, default_qty_value=1, initial_capital=1000, currency=currency.USD, pyramiding=0, commission_type=strategy.commission.percent, commission_value=0)

// Define the lengths for the short and long SMAs
shortSMA_length = input.int(50, title="Short SMA Length", minval=1)
longSMA_length = input.int(200, title="Long SMA Length", minval=1)

// Define the start and end dates for the backtest
startDate = input(timestamp("2024-06-01 00:00"), title="Start Date")
endDate = input(timestamp("2024-06-05 00:00"), title="End Date")

// Define the timeframe for the SMAs
smaTimeframe = input.timeframe("D", title="SMA Timeframe")

// Request the short and long SMAs from the selected timeframe
dailyShortSMA = request.security(syminfo.tickerid, smaTimeframe, ta.sma(close, shortSMA_length))
dailyLongSMA = request.security(syminfo.tickerid, smaTimeframe, ta.sma(close, longSMA_length))

// Plot the SMAs on the chart
plot(dailyShortSMA, color=color.blue, title="Short SMA")
plot(dailyLongSMA, color=color.red, title="Long SMA")

// Define the crossover conditions based on the selected timeframe SMAs
buyCondition = ta.crossover(dailyShortSMA, dailyLongSMA)
sellCondition = ta.crossunder(dailyShortSMA, dailyLongSMA)

// Generate buy and sell signals only if the current time is within the date range

if (buyCondition)
    strategy.entry("Buy", strategy.long)
if (sellCondition)
    strategy.close("Buy")

// Optional: Add visual buy/sell markers on the chart
plotshape(series=buyCondition and (time >= startDate and time <= endDate), title="Buy Signal", location=location.belowbar, color=color.green, style=shape.labelup, text="BUY")
plotshape(series=sellCondition and (time >= startDate and time <= endDate), title="Sell Signal", location=location.abovebar, color=color.red, style=shape.labeldown, text="SELL")
Detail
https://www.fmz.com/strategy/453646
Last Modified
2024-06-07 14:49:52