
13 KiB
Name
SMA交叉与成交量过滤的自适应动态止盈止损策略Adaptive-Dynamic-Stop-Loss-and-Take-Profit-Strategy-with-SMA-Crossover-and-Volume-Filter
Author
ChaoZhang
Strategy Description
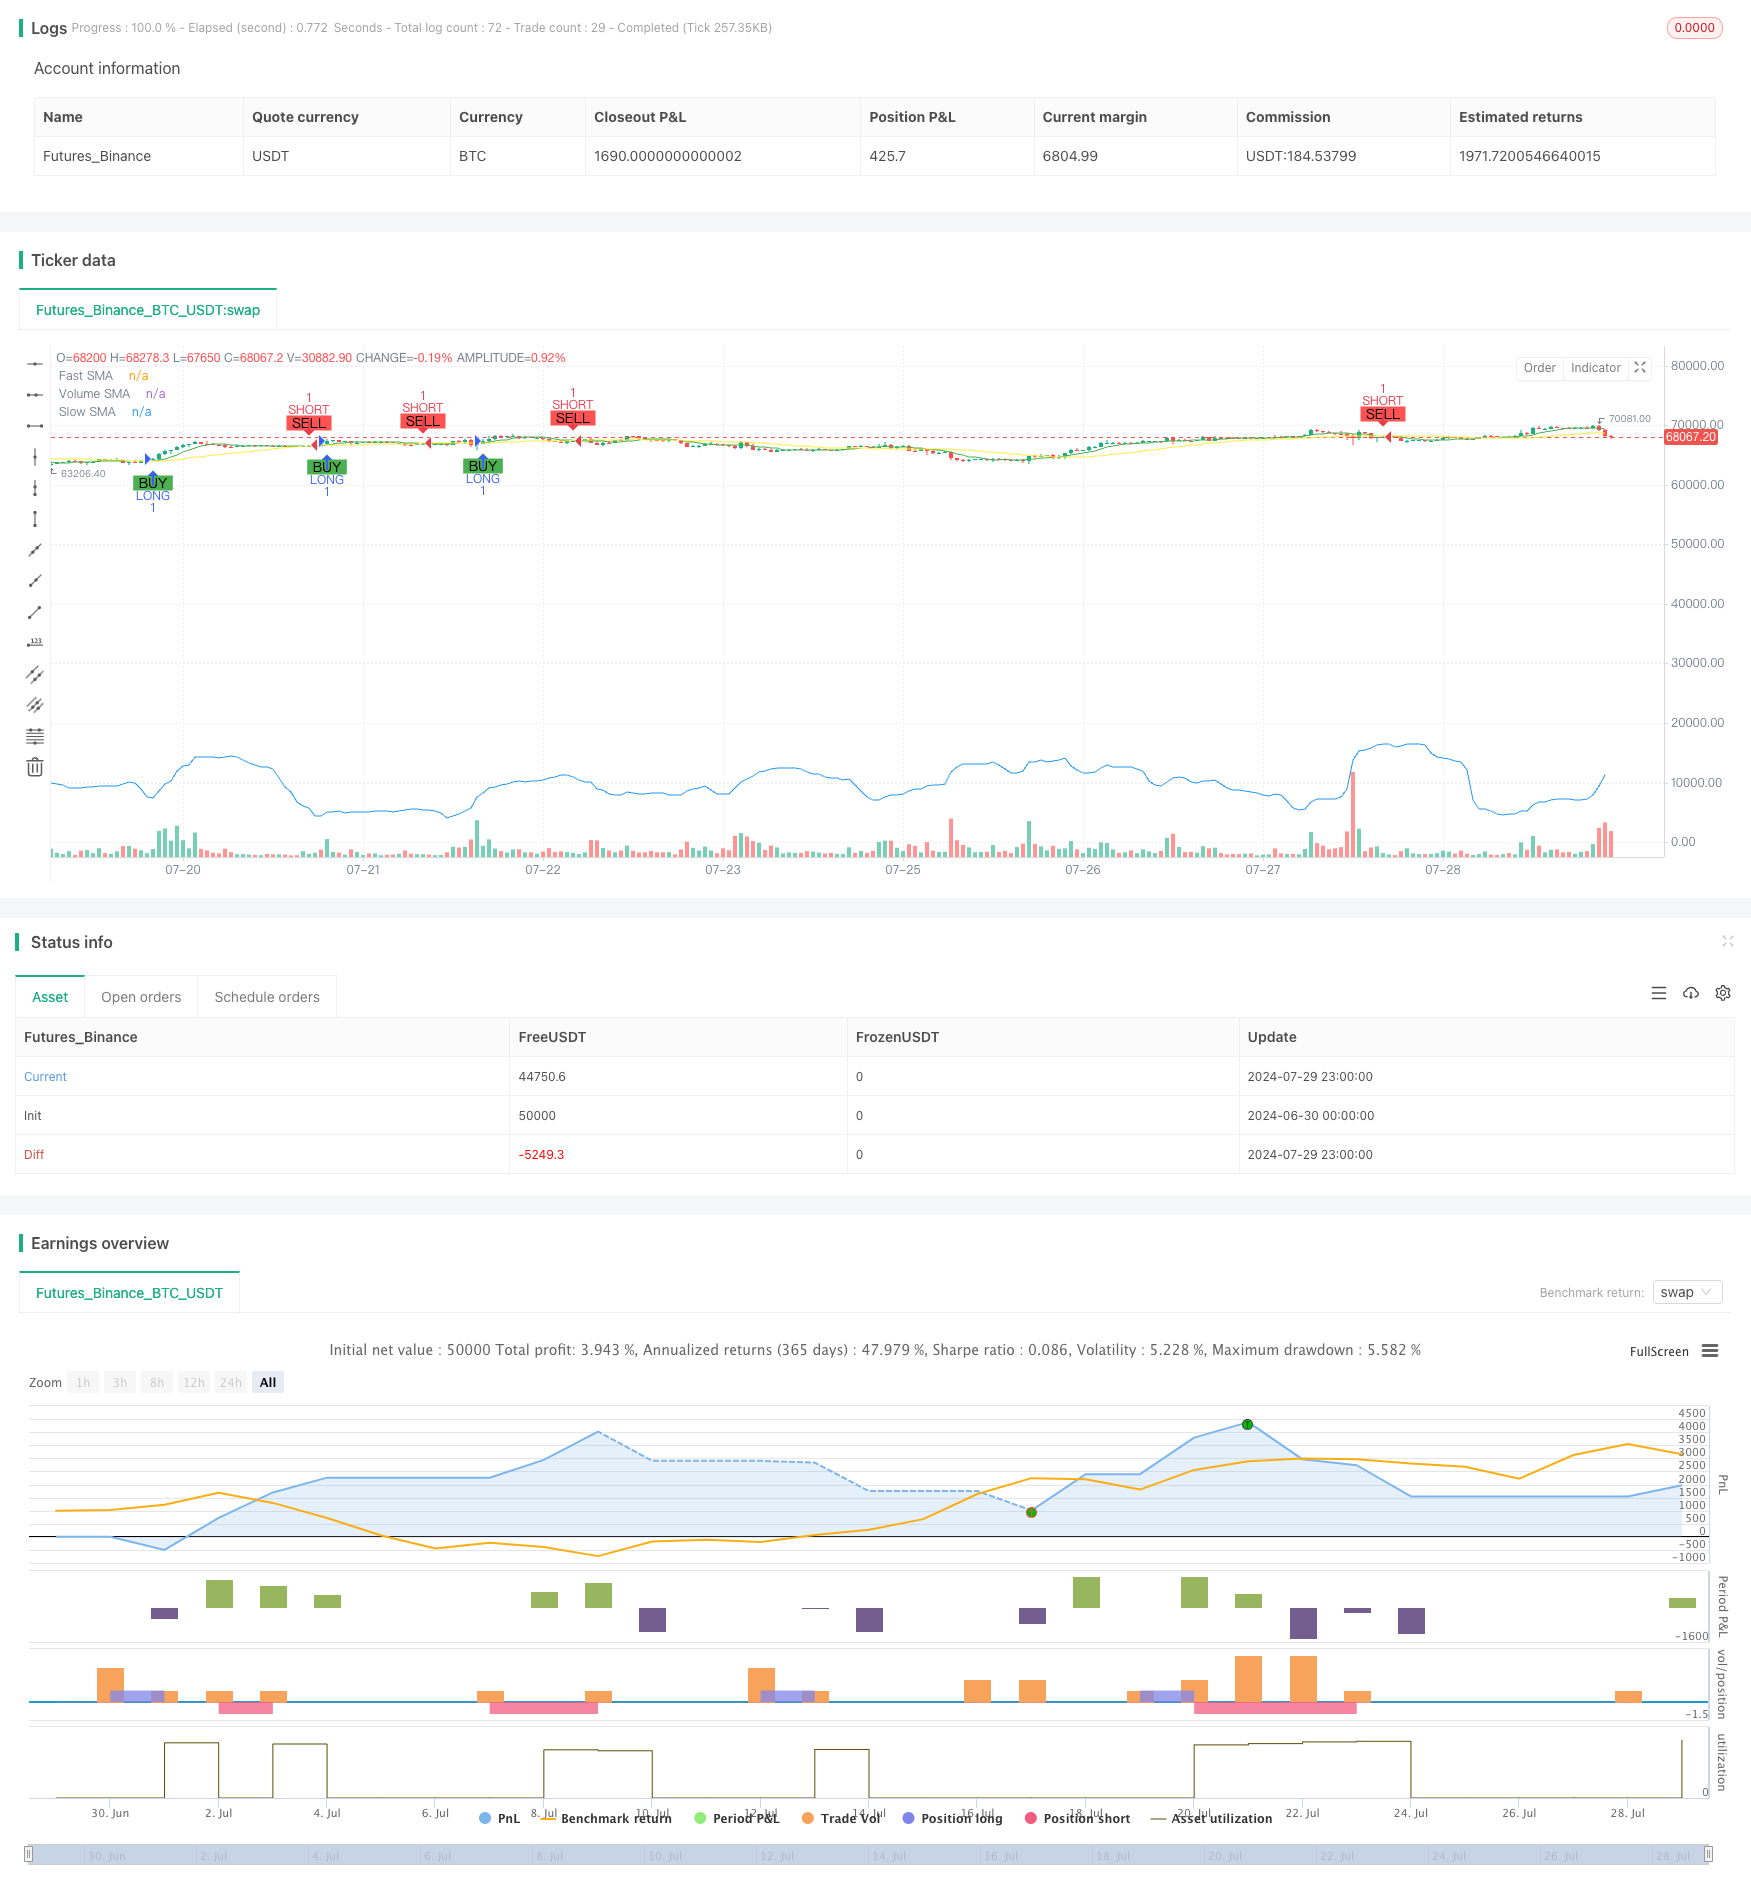
[trans]
概述
本策略是一个基于简单移动平均线(SMA)交叉和成交量过滤的自动化交易系统。它利用快速和慢速SMA的交叉来生成进场信号,同时结合成交量指标来确认趋势强度。策略还包含了动态的止损和止盈机制,以及基于时间的退出条件,旨在优化风险管理和提高盈利能力。
策略原理
该策略的核心原理基于以下几个关键组件:
-
SMA交叉信号:
- 使用两条不同周期的简单移动平均线(快速SMA和慢速SMA)
- 当快速SMA从下方穿越慢速SMA时,产生做多信号
- 当快速SMA从上方穿越慢速SMA时,产生做空信号
-
成交量过滤:
- 计算成交量的简单移动平均线
- 做多信号要求当前成交量高于成交量SMA
- 做空信号要求当前成交量低于成交量SMA
-
动态止损和止盈:
- 基于入场价格的百分比设置止损和止盈水平
- 止损和止盈水平可通过输入参数进行调整
-
时间基础退出:
- 设置最大持仓时间(以K线数量计)
- 超过最大持仓时间自动平仓,防止长期持有不利头寸
-
回测期间设置:
- 允许用户定义特定的回测时间范围
- 确保策略仅在指定的历史期间内运行
策略优势
-
趋势跟踪与动量结合: 通过结合SMA交叉和成交量过滤,策略能够捕捉到强劲的趋势行情,同时避免在弱势市场中频繁交易。
-
灵活的风险管理: 动态止损和止盈机制允许策略根据市场波动性自动调整风险暴露,有助于保护盈利并限制潜在损失。
-
防止过度持仓: 最大持仓时间限制有助于防止策略在不利市场条件下长期持有亏损头寸,促进资金的有效利用。
-
可定制性强: 多个可调参数(如SMA周期、止损止盈百分比、最大持仓时间等)使策略可以根据不同市场和交易风格进行优化。
-
视觉化支持: 策略在图表上绘制了SMA线和交易信号,便于直观理解和分析策略表现。
策略风险
-
滞后性: SMA指标本质上是滞后的,可能导致在快速反转市场中出现延迟进场或错过机会。
-
假突破风险: 在横盘市场中,SMA交叉可能产生频繁的假突破信号,导致过度交易和增加交易成本。
-
成交量依赖: 过度依赖成交量指标可能在某些市场条件下误导策略,特别是在低流动性或异常交易量期间。
-
固定百分比止损/止盈: 使用固定百分比的止损和止盈可能不适合所有市场条件,特别是在波动性剧烈变化的时期。
-
时间基础退出的局限性: 固定的最大持仓时间可能导致在有利趋势尚未结束时过早平仓,影响潜在收益。
策略优化方向
-
动态参数调整: 实现SMA周期、止损止盈百分比和最大持仓时间的动态调整,以适应不同的市场周期和波动性。
-
incorporate额外的过滤器: 引入其他技术指标(如RSI、MACD等)作为额外的过滤条件,提高交易信号的准确性。
-
自适应成交量阈值: 开发动态调整的成交量阈值机制,以更好地适应不同市场阶段的成交量特征。
-
改进退出机制: 探索基于市场结构或动量指标的智能退出机制,取代固定时间退出,提高策略的适应性。
-
波动性调整: 实现基于市场波动性的动态止损和止盈水平调整,以更好地管理风险和捕捉利润。
-
多时间框架分析: 整合多个时间框架的数据分析,提高策略对市场趋势和反转的识别能力。
-
机器学习优化: 利用机器学习算法动态优化策略参数,提高策略在不同市场环境下的表现。
总结
"SMA交叉与成交量过滤的自适应动态止盈止损策略"是一个结合了趋势跟踪、成交量分析和风险管理的综合交易系统。通过利用SMA交叉和成交量过滤,策略旨在捕捉强劲的市场趋势,同时其动态止损止盈机制和时间基础退出功能提供了灵活的风险控制。尽管存在一些固有的局限性,如信号滞后和对固定参数的依赖,但策略提供了多个可优化的方向,包括参数动态调整、引入额外的技术指标和利用机器学习技术等。通过持续的优化和改进,该策略有潜力成为一个强大而灵活的自动化交易工具,适用于各种市场条件和交易风格。
||
Overview
This strategy is an automated trading system based on Simple Moving Average (SMA) crossovers and volume filtering. It utilizes the crossover of fast and slow SMAs to generate entry signals, while incorporating volume indicators to confirm trend strength. The strategy also includes dynamic stop-loss and take-profit mechanisms, as well as time-based exit conditions, aimed at optimizing risk management and enhancing profitability.
Strategy Principles
The core principles of this strategy are based on the following key components:
-
SMA Crossover Signals:
- Uses two Simple Moving Averages of different periods (fast SMA and slow SMA)
- Generates a long signal when the fast SMA crosses above the slow SMA
- Generates a short signal when the fast SMA crosses below the slow SMA
-
Volume Filtering:
- Calculates a Simple Moving Average of volume
- Long signals require current volume to be above the volume SMA
- Short signals require current volume to be below the volume SMA
-
Dynamic Stop-Loss and Take-Profit:
- Sets stop-loss and take-profit levels based on a percentage of the entry price
- Stop-loss and take-profit levels can be adjusted through input parameters
-
Time-Based Exits:
- Sets a maximum holding time (in number of bars)
- Automatically closes positions after the maximum holding time to prevent long-term adverse positions
-
Backtest Period Setting:
- Allows users to define a specific backtest time range
- Ensures the strategy runs only within the specified historical period
Strategy Advantages
-
Trend Following and Momentum Combination: By combining SMA crossovers and volume filtering, the strategy can capture strong trend movements while avoiding frequent trades in weak markets.
-
Flexible Risk Management: The dynamic stop-loss and take-profit mechanisms allow the strategy to automatically adjust risk exposure based on market volatility, helping to protect profits and limit potential losses.
-
Prevention of Overholding: The maximum holding time limit helps prevent the strategy from holding losing positions for extended periods in adverse market conditions, promoting effective use of capital.
-
High Customizability: Multiple adjustable parameters (such as SMA periods, stop-loss and take-profit percentages, maximum holding time, etc.) allow the strategy to be optimized for different markets and trading styles.
-
Visual Support: The strategy plots SMA lines and trade signals on the chart, facilitating intuitive understanding and analysis of strategy performance.
Strategy Risks
-
Lagging Nature: SMA indicators are inherently lagging, which may lead to delayed entries or missed opportunities in rapidly reversing markets.
-
False Breakout Risk: In ranging markets, SMA crossovers may produce frequent false breakout signals, leading to overtrading and increased transaction costs.
-
Volume Dependency: Over-reliance on volume indicators may mislead the strategy under certain market conditions, especially during periods of low liquidity or abnormal trading volumes.
-
Fixed Percentage Stop-Loss/Take-Profit: Using fixed percentage stop-loss and take-profit may not be suitable for all market conditions, especially during periods of dramatic volatility changes.
-
Limitations of Time-Based Exits: Fixed maximum holding times may lead to premature exits when favorable trends have not yet concluded, impacting potential returns.
Strategy Optimization Directions
-
Dynamic Parameter Adjustment: Implement dynamic adjustment of SMA periods, stop-loss and take-profit percentages, and maximum holding times to adapt to different market cycles and volatility.
-
Incorporate Additional Filters: Introduce other technical indicators (such as RSI, MACD, etc.) as additional filtering conditions to improve the accuracy of trade signals.
-
Adaptive Volume Thresholds: Develop dynamically adjusting volume threshold mechanisms to better adapt to volume characteristics in different market phases.
-
Improved Exit Mechanisms: Explore intelligent exit mechanisms based on market structure or momentum indicators to replace fixed-time exits, enhancing strategy adaptability.
-
Volatility Adjustment: Implement dynamic stop-loss and take-profit level adjustments based on market volatility to better manage risk and capture profits.
-
Multi-Timeframe Analysis: Integrate data analysis from multiple timeframes to improve the strategy's ability to identify market trends and reversals.
-
Machine Learning Optimization: Utilize machine learning algorithms to dynamically optimize strategy parameters, improving performance across different market environments.
Conclusion
The "Adaptive Dynamic Stop-Loss and Take-Profit Strategy with SMA Crossover and Volume Filter" is a comprehensive trading system that combines trend following, volume analysis, and risk management. By leveraging SMA crossovers and volume filtering, the strategy aims to capture strong market trends, while its dynamic stop-loss and take-profit mechanisms and time-based exit features provide flexible risk control. Although there are some inherent limitations, such as signal lag and dependence on fixed parameters, the strategy offers multiple optimization directions, including dynamic parameter adjustment, introduction of additional technical indicators, and the use of machine learning techniques. Through continuous optimization and improvement, this strategy has the potential to become a powerful and flexible automated trading tool suitable for various market conditions and trading styles.
[/trans]
Source (PineScript)
/*backtest
start: 2024-06-30 00:00:00
end: 2024-07-30 00:00:00
period: 1h
basePeriod: 15m
exchanges: [{"eid":"Futures_Binance","currency":"BTC_USDT"}]
*/

//@version=5
strategy("Simple_CrossOver_Bot_V1_EBO", overlay=true)

// INPUTS
dateStart_Year = input.int(2018, title="Start Year", minval=2000)
dateStart_Month = input.int(1, title="Start Month", minval=1, maxval=12)
dateStart_Day = input.int(1, title="Start Day", minval=1, maxval=31)
dateEnd_Year = input.int(2019, title="End Year", minval=2000)
dateEnd_Month = input.int(1, title="End Month", minval=1, maxval=12)
dateEnd_Day = input.int(1, title="End Day", minval=1, maxval=31)

fast_SMA_input = input.int(7, title="SMA Fast")
slow_SMA_input = input.int(25, title="SMA Slow")
volume_SMA_input = input.int(20, title="Volume SMA")
stop_loss_percent = input.float(1.0, title="Stop Loss (%)", step=0.1) / 100
take_profit_percent = input.float(2.0, title="Take Profit (%)", step=0.1) / 100
max_bars_in_trade = input.int(50, title="Max Bars in Trade", minval=1)

// INDICATORS
fast_SMA = ta.sma(close, fast_SMA_input)
slow_SMA = ta.sma(close, slow_SMA_input)
volume_SMA = ta.sma(volume, volume_SMA_input)

// STRATEGY
LONG = ta.crossover(fast_SMA, slow_SMA) and fast_SMA > slow_SMA and volume > volume_SMA
SHORT = ta.crossunder(fast_SMA, slow_SMA) and fast_SMA < slow_SMA and volume < volume_SMA

// TRIGGERS
testPeriodStart = timestamp(dateStart_Year, dateStart_Month, dateStart_Day)
testPeriodEnd = timestamp(dateEnd_Year, dateEnd_Month, dateEnd_Day)
timecondition = true

// Track bar index for entries
var int long_entry_bar_index = na
var int short_entry_bar_index = na

if timecondition
    if LONG
        strategy.entry(id="LONG", direction=strategy.long)
        long_entry_bar_index := bar_index
    if SHORT
        strategy.entry(id="SHORT", direction=strategy.short)
        short_entry_bar_index := bar_index

    // Exit conditions for LONG
    if not na(long_entry_bar_index) and bar_index - long_entry_bar_index >= max_bars_in_trade
        strategy.close("LONG")
        long_entry_bar_index := na

    // Exit conditions for SHORT
    if not na(short_entry_bar_index) and bar_index - short_entry_bar_index >= max_bars_in_trade
        strategy.close("SHORT")
        short_entry_bar_index := na

    // Standard exits
    if LONG
        strategy.exit("Exit LONG", from_entry="LONG", stop=close * (1 - stop_loss_percent), limit=close * (1 + take_profit_percent))
    if SHORT
        strategy.exit("Exit SHORT", from_entry="SHORT", stop=close * (1 + stop_loss_percent), limit=close * (1 - take_profit_percent))

// PLOTS
plot(fast_SMA, color=color.green, linewidth=1, title="Fast SMA")
plot(slow_SMA, color=color.yellow, linewidth=1, title="Slow SMA")
plot(volume_SMA, color=color.blue, linewidth=1, title="Volume SMA")
plotshape(series=LONG, location=location.belowbar, color=color.green, style=shape.labelup, text="BUY", size=size.small)
plotshape(series=SHORT, location=location.abovebar, color=color.red, style=shape.labeldown, text="SELL", size=size.small)

// Uncomment the following lines for alerts
// alertcondition(LONG, title="LONG")
// alertcondition(SHORT, title="SHORT")
Detail
https://www.fmz.com/strategy/458238
Last Modified
2024-07-31 11:20:39