
8.4 KiB
Name
RSI-MACD交叉双均线跟踪策略RSI-MACD-Crossover-Double-MA-Tracking-Strategy
Author
ChaoZhang
Strategy Description
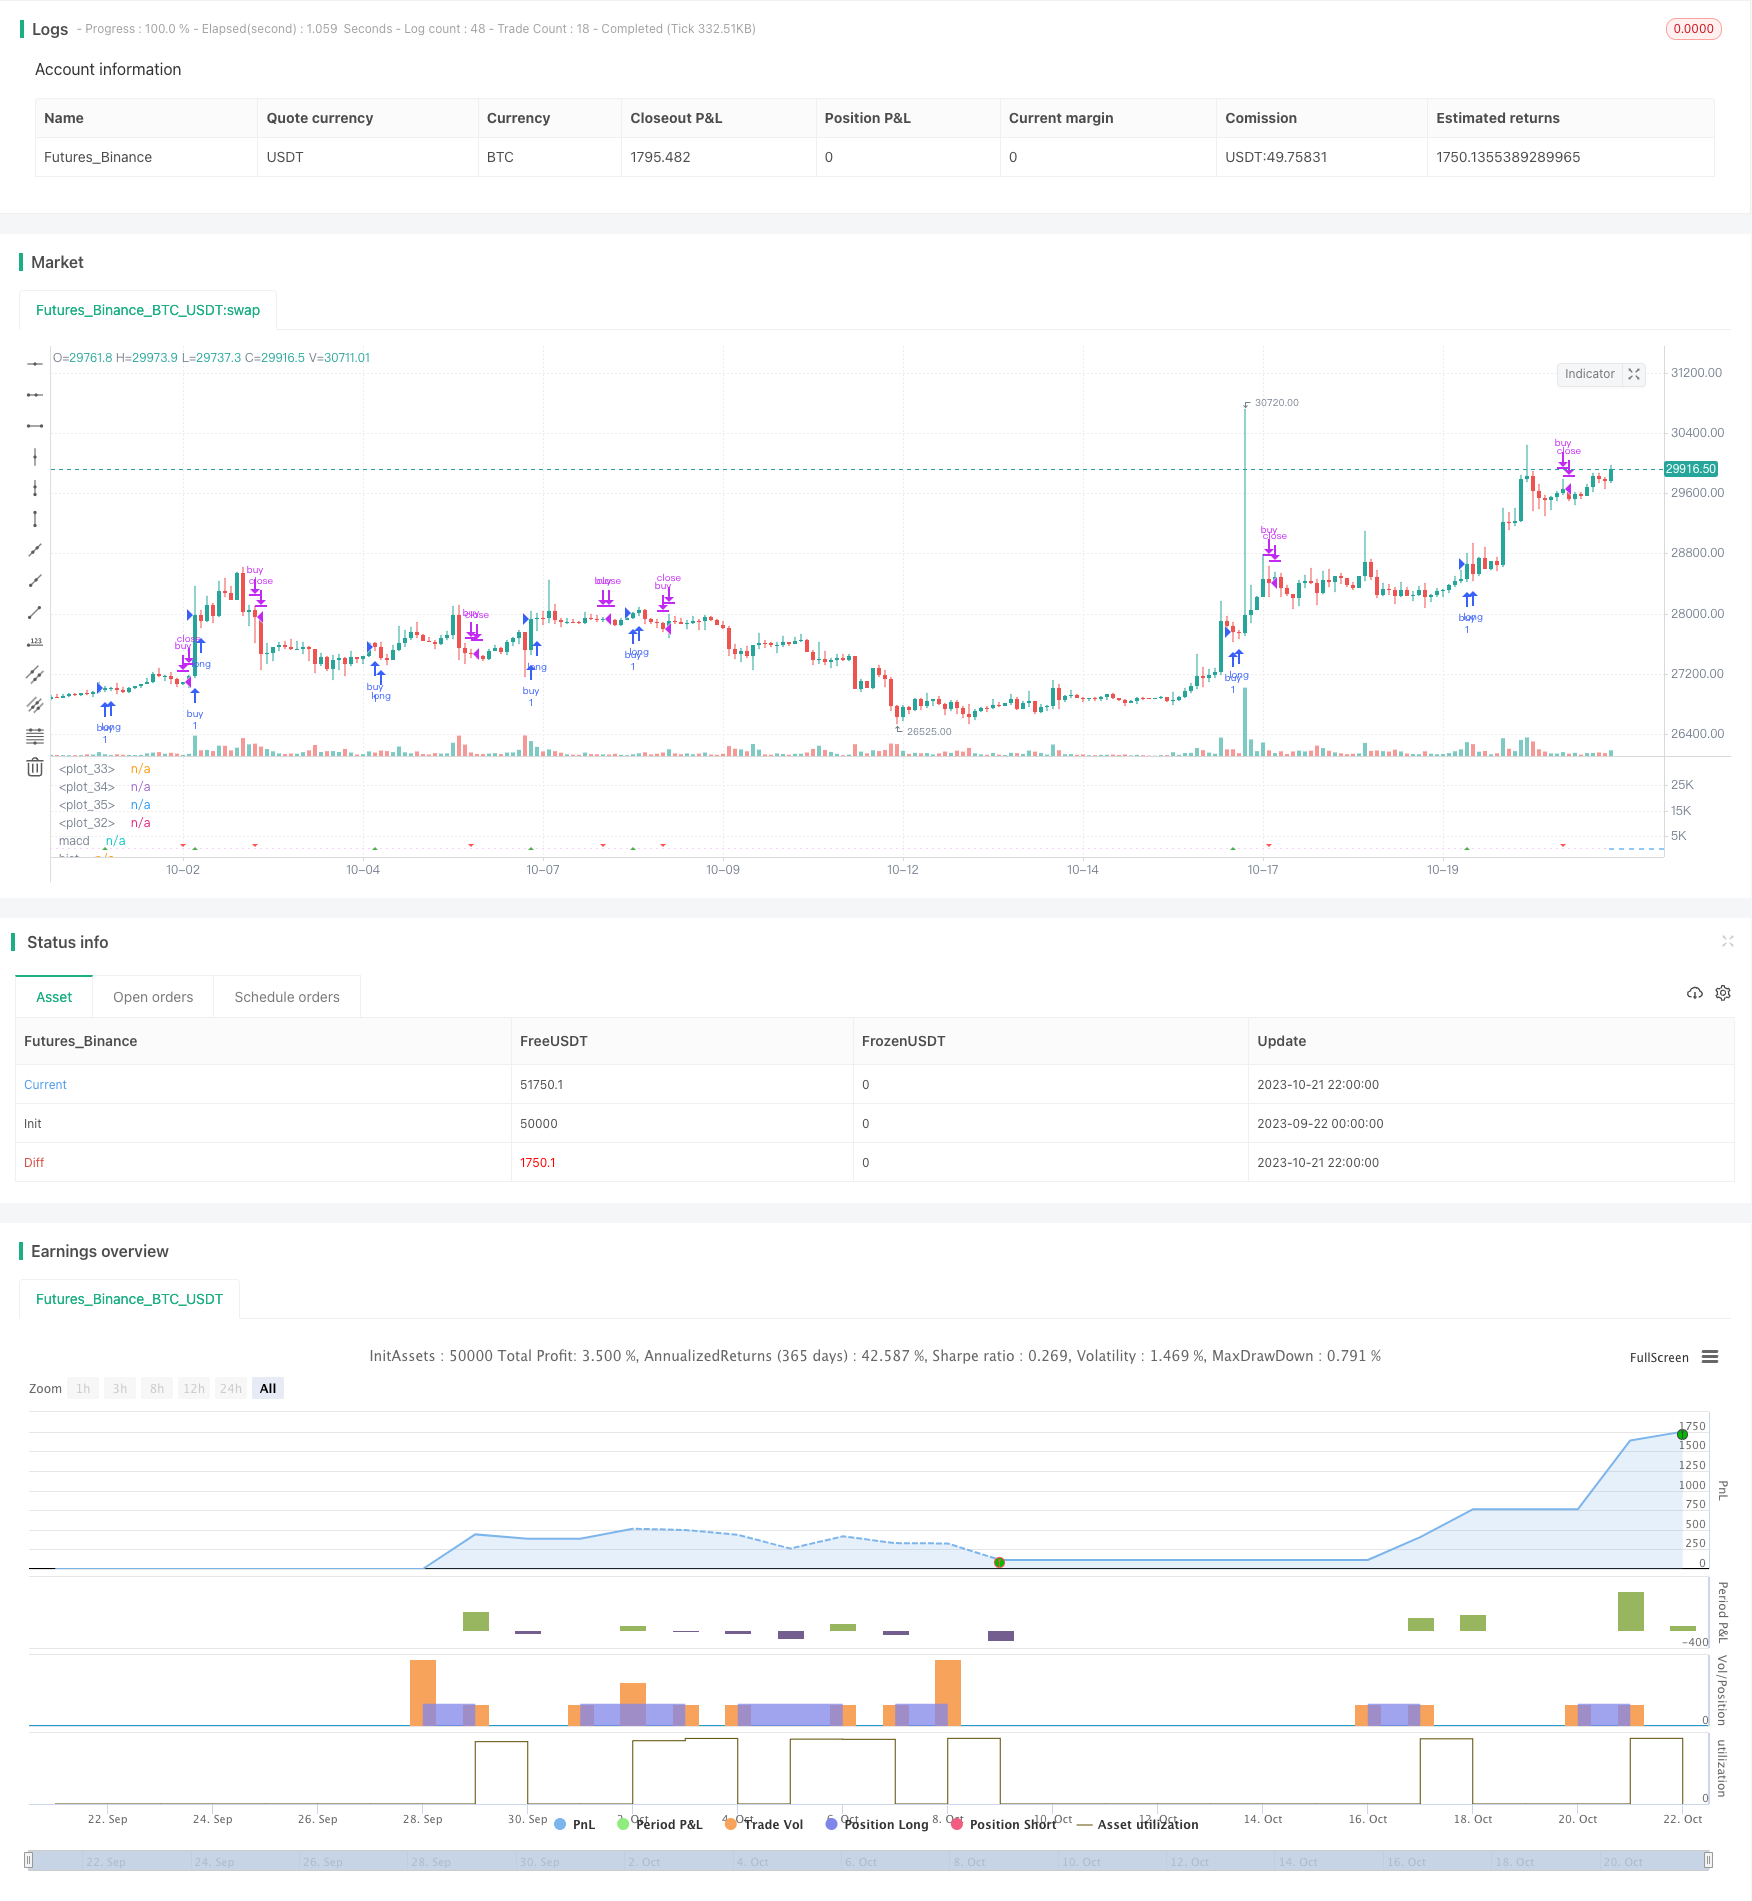
[trans]
概述
本策略综合运用RSI指标、MACD指标以及双均线,实现趋势跟踪和定位标准差行情的效果。策略通过RSI指标判断超买超卖现象,MACD实现快慢均线交叉判断买入卖出时机,双均线过滤掉部分噪音交易机会,在趋势中获利。
策略原理
- 计算RSI指标判断超买超卖
-
计算一定周期内的涨跌变化
-
根据涨跌变化计算RSI
-
给出超买超卖判断
- 计算MACD指标判断交叉
-
计算快线、慢线、信号线
-
实现快慢线交叉买入和卖出
-
显示交叉情况
- 实现双均线过滤
-
计算快线、慢线
-
只在快线上穿慢线时考虑交易
-
实现趋势跟踪过滤噪音
- 组合多个指标判断入场
-
综合RSI、MACD、双均线多重条件过滤
-
提高策略的稳定性
优势分析
-
多指标组合,提高策略准确性
-
趋势跟踪,过滤噪音,提高稳定性
-
RSI指标判断超买超卖,助于抓住转折点
-
MACD交叉判断,简单有效地判断买入卖出
-
双均线过滤,去除大部分非主流方向交易机会
-
容易理解参数少,适合新手改进学习
风险分析
-
多重指标组合,容易产生策略过度优化
-
双均线过于牺牲灵活性,错过部分机会
-
需要谨慎选择RSI和MACD的参数
-
需关注交易品种的止损点,控制风险
-
长期使用需要反复调整参数适应市场
优化方向
-
调整RSI参数,适应不同品种特性
-
调整双均线周期,优化趋势跟踪效果
-
加入止损策略,控制单笔损失
-
结合更多指标,丰富条件组合
-
开发参数自适应模式,自动调整参数
总结
本策略综合运用RSI、MACD和双均线等多个指标,实现了对趋势的判断和跟踪,对机会进行多层过滤,是一个非常适合新手学习和改进的多指标策略。该策略优势在于简单高效,容易理解适应,通过调整参数可以获得不错的稳定收益。下一步可通过加入更多指标,开发自适应参数模式等进一步优化策略,使其能够自动调整适应更多不同市场环境。
||
Overview
This strategy combines RSI indicator, MACD indicator and double moving averages to achieve trend tracking and positioning effects in volatility market. It uses RSI indicator to judge overbought and oversold conditions, MACD to determine entry and exit points with fast and slow MA crossover, and double MAs to filter out some noisy trading opportunities during the trend.
Strategy Logic
- Calculate RSI indicator for overbought and oversold
-
Calculate price change uptrend and downtrend
-
Compute RSI based on the price change
-
Determine overbought and oversold levels
- Calculate MACD for crossover
-
Compute fast MA, slow MA and signal line
-
Enter long on golden cross and exit on death cross
-
Plot the crossover situations
- Implement double MA filter
-
Compute fast and slow moving averages
-
Only consider trading when fast MA crosses above slow MA
-
Filter noise and follow the trend
- Combine indicators for entry
-
Filter entry signal with RSI, MACD and double MA
-
Improve accuracy and stability of strategy
Advantage Analysis
-
Combination of multiple indicators improves accuracy
-
Trend following filters noise and enhances stability
-
RSI spots potential reversal points
-
MACD crossover provides simple entry and exit signals
-
Double MA removes most countertrend trades
-
Easy to understand with few parameters, good for learning
Risk Analysis
-
Risk of overfitting with multiple indicators
-
Double MA sacrifices flexibility and may miss chances
-
RSI and MACD parameters need careful selection
-
Pay attention to stop loss based on symbol
-
Requires periodic re-tuning of parameters
Optimization Directions
-
Adjust RSI parameters for different symbols
-
Optimize double MA periods for better tracking
-
Add stop loss to control single trade loss
-
Incorporate more indicators to enrich combo
-
Develop adaptive parameter model for auto-tuning
Summary
This strategy combines RSI, MACD and double MA to identify and track trends, and filters signals through multiple layers. It is very suitable for beginners to learn and improve. The advantage lies in its simplicity and adaptiveness. Fine tuning of parameters can generate decent steady returns. Next steps may include adding more indicators, developing adaptive parameter model to auto optimize for different market environments.
[/trans]
Strategy Arguments
| Argument | Default | Description |
|---|---|---|
| v_input_1 | 2017 | Backtest Start Year |
| v_input_2 | true | Backtest Start Month |
| v_input_3 | 2 | Backtest Start Day |
| v_input_4 | 2019 | Backtest Stop Year |
| v_input_5 | 7 | Backtest Stop Month |
| v_input_6 | 30 | Backtest Stop Day |
| v_input_7 | true | Color Background? |
| v_input_8 | 14 | Length |
| v_input_9 | 9 | Fast Length |
| v_input_10 | 72 | Slow Length |
| v_input_11 | 9 | Signal Length |
| v_input_12 | 234 | Control MA |
| v_input_13 | true | Buy on crossover control MA? |
Source (PineScript)
/*backtest
start: 2023-09-22 00:00:00
end: 2023-10-22 00:00:00
period: 2h
basePeriod: 15m
exchanges: [{"eid":"Futures_Binance","currency":"BTC_USDT"}]
*/

//@version=3

// strategy(title="RSI MACD", precision = 6, pyramiding = 1, default_qty_type = strategy.percent_of_equity, default_qty_value = 99, commission_type = strategy.commission.percent, commission_value = 0.25, initial_capital = 1000)

// Component Code Start
// Example usage:
// if testPeriod()
//   strategy.entry("LE", strategy.long)
testStartYear = input(2017, "Backtest Start Year")
testStartMonth = input(01, "Backtest Start Month")
testStartDay = input(2, "Backtest Start Day")
testPeriodStart = timestamp(testStartYear,testStartMonth,testStartDay,0,0)

testStopYear = input(2019, "Backtest Stop Year")
testStopMonth = input(7, "Backtest Stop Month")
testStopDay = input(30, "Backtest Stop Day")
testPeriodStop = timestamp(testStopYear,testStopMonth,testStopDay,0,0)

// A switch to control background coloring of the test period
testPeriodBackground = input(title="Color Background?", type=bool, defval=true)
testPeriodBackgroundColor = testPeriodBackground and (time >= testPeriodStart) and (time <= testPeriodStop) ? #00FF00 : na
bgcolor(testPeriodBackgroundColor, transp=97)

testPeriod() => true
// Component Code Stop

//standard rsi template
src = ohlc4, len = input(14, minval=1, title="Length")
up = rma(max(change(src), 0), len)
down = rma(-min(change(src), 0), len)
rsi = down == 0 ? 100 : up == 0 ? 0 : 100 - (100 / (1 + up / down))
plot(rsi, color=#87ff1a)
band1 = hline(80)
band = hline(50)
band0 = hline(20)
fill(band1, band0, color=purple, transp=90)

//macd

fast_length = input(title="Fast Length",  defval=9)
slow_length = input(title="Slow Length",  defval=72)
signal_length = input(title="Signal Length",  defval=9)

fast_ma = sma(rsi, fast_length)
slow_ma = sma(rsi, slow_length)
shortma = sma(ohlc4, fast_length)
longma = sma(ohlc4, slow_length)
controlmainput = input(title = "Control MA", defval = 234)
controlma = sma(ohlc4, controlmainput)
macdx = fast_ma - slow_ma
signalx = sma(macdx, signal_length)
hist = macdx - signalx
ma_hist = shortma - controlma
macd = macdx + 50
signal = signalx + 50

plot(macd,"macd", color = fuchsia)
plot(hist,"hist", style = histogram, color = fuchsia)
//plot(ma_hist,"ma hist", style = histogram, color = orange)
plot(signal,"signal", color = white)

//input
control_buy_toggle = input(true, "Buy on crossover control MA?", type = bool)
buy_on_control = control_buy_toggle == true? true : false

//conditions
buy = buy_on_control == true? ma_hist > 0 and shortma > longma and crossover(macd,signal) or crossover(shortma, controlma) : ma_hist > 0 and shortma > longma and crossover(macd,signal)
sell = ma_hist > 0 and shortma > longma and crossunder(macd,signal)
stop = crossunder(shortma, longma) or crossunder(shortma, controlma)

plotshape(buy,"buy", shape.triangleup, location.bottom, green, size = size.tiny)
plotshape(sell,"sell", shape.triangledown, location.bottom, red, size = size.tiny)
plotshape(stop,"stop",shape.circle,location.bottom, white, size = size.tiny)

if testPeriod()
    strategy.entry("buy", true, when = buy, limit = close)
    strategy.close("buy", when = sell)
    strategy.close("buy", when = stop)
Detail
https://www.fmz.com/strategy/429962
Last Modified
2023-10-23 17:00:44