
8.7 KiB
Name
RSI-BB动量突破策略RSI-BB-Momentum-Breakout-Strategy
Author
ChaoZhang
Strategy Description
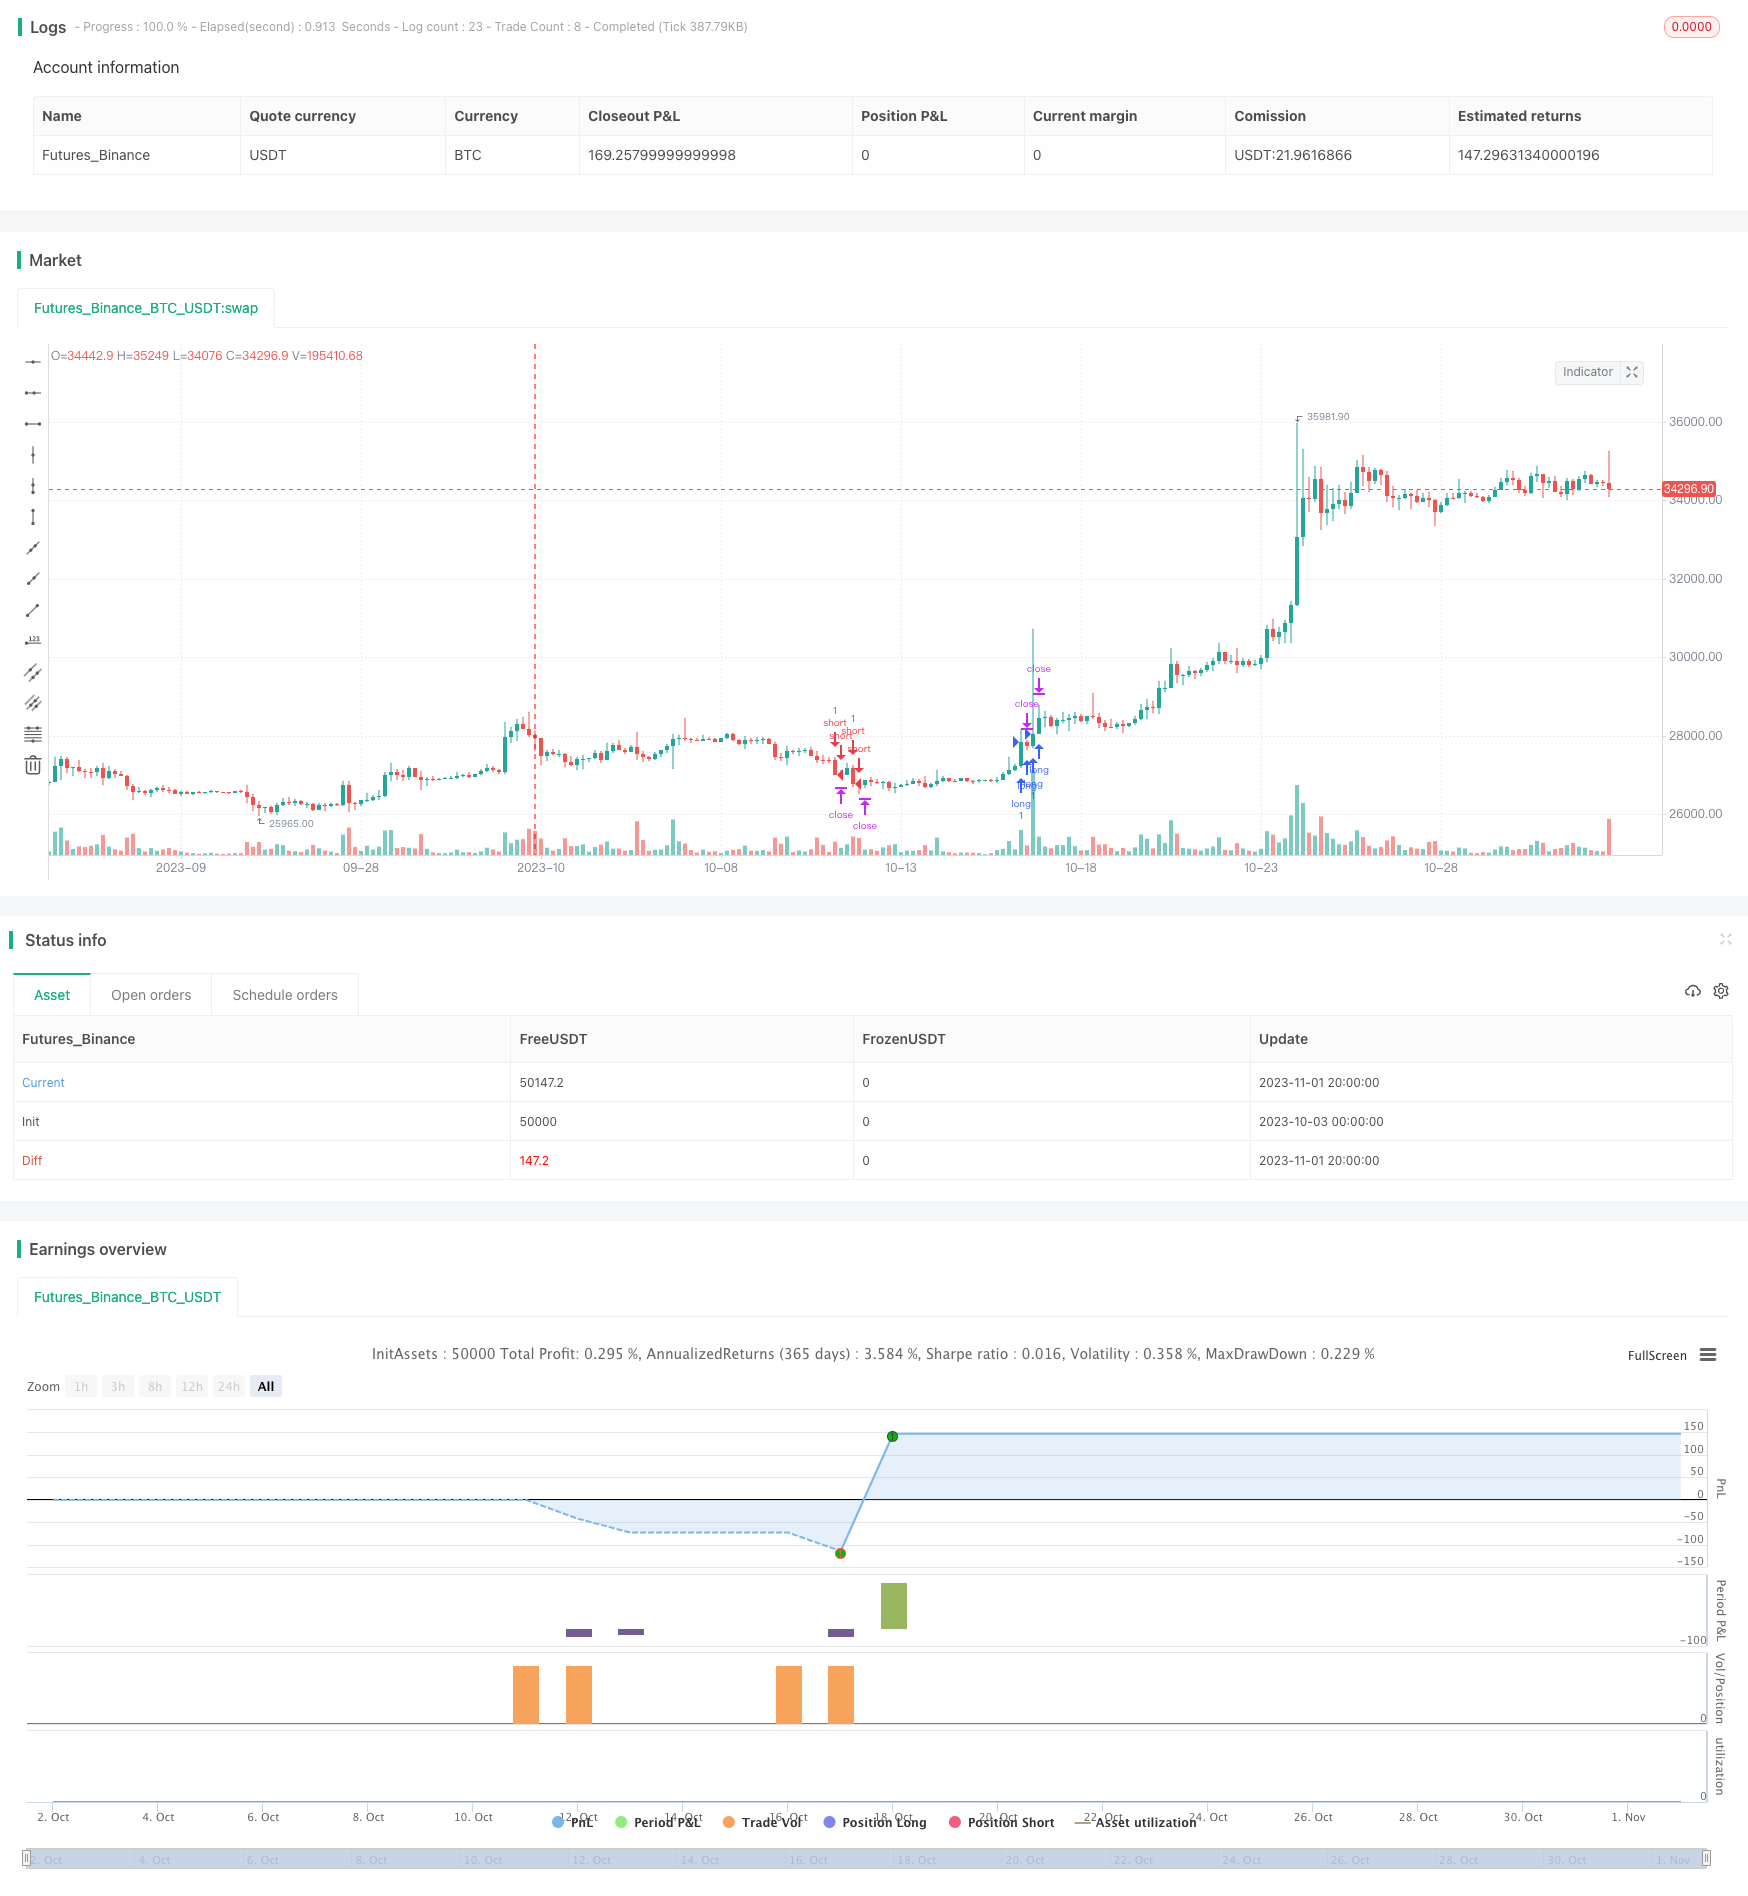 [trans]
概述
RSI-BB动量突破策略是一个结合相对强弱指标(RSI)和布林带指标(BB)的突破策略。该策略利用RSI判断市场趋势和超买超卖现象,利用BB判断突破口,在RSI和BB指标同时发出买入或卖出信号时,进行相应的买入或卖出操作。
策略原理
代码中首先计算RSI和BB两个指标。
RSI的计算方法是:
up = rma(max(change(close), 0), 30)
down = rma(-min(change(close), 0), 30)
rsi = down == 0 ? 100 : up == 0 ? 0 : 100 - (100 / (1 + up / down))
其中up统计近30天收盘价上涨的幅度,down统计近30天收盘价下跌的幅度,rsi根据上涨幅度和下跌幅度的比值计算出来。
BB的计算方法是:
basis = sma(close, 50)
dev = 0.2 * stdev(close, 50)
upper = basis + dev
lower = basis - dev
其中basis是50日均线,dev是标准差的0.2倍,upper和lower分别是带中线上下轨。
bbi是布林带宽度指数,计算方法是:
bbr = close>upper? 1 : close<lower? -1 : 0
bbi = bbr - bbr[1]
bbr判断当前close是否突破上下轨,突破为1,跌破为-1,否则为0。bbi就是当前bbr减去前一周期bbr,大于0表示向上突破,小于0表示向下突破。
在计算出RSI和BBI后,策略的交易信号判断逻辑是:
long = rsi>52 and rsi<65 and bbi>0.11 and bbi<0.7
short = rsi<48 and rsi>35 and bbi<-0.11 and bbi>-0.7
也就是当RSI在52-65区间,且BBI大于0.11小于0.7时做多;当RSI在35-48区间,且BBI小于-0.11大于-0.7时做空。
策略优势
-
结合RSI和BB两个指标,能更准确判断买卖点。RSI判断超买超卖,BB判断突破口,两者结合更可靠。
-
RSI参数设置为30日线,可以过滤市场中的部分噪音,识别主要趋势。
-
BB参数设置为50日线以及0.2倍标准差,可以起到过滤震荡的效果。
-
BBI增加0.11和0.7的过滤条件,可以过滤假突破。
-
RSI的做多做空区间设置为52-65和35-48,增加buffer避免错失买卖点。
策略风险
-
突破交易策略容易被套,需要设置止损来控制风险。
-
回测数据可能存在过拟合,实盘效果可能会有差异。
-
市场可能出现剧烈变动,导致止损被击穿产生较大亏损。
-
需要优化RSI和BB的参数,包括周期参数及买卖区间参数。
-
订单的价格设置也会对实盘效果产生较大影响。
策略优化方向
-
测试不同的RSI和BB的参数组合,找到最佳参数。
-
添加其他指标判断过滤信号,如MACD、KD等。
-
优化和调整买卖的RSI区间参数,减小区间范围以过滤更多噪音。
-
优化BBI的过滤参数,设置动态区间过滤假突破。
-
添加趋势判断指标,避免逆势操作。
-
测试不同的止损方式,寻找最大回撤可接受的止损方案。
-
测试不同的订单方式,寻找滑点影响最小的下单方案。
总结
RSI-BB动量突破策略结合趋势判断和突破口判断的优点,在回测中表现不俗。但实盘效果可能会受滑点和止损的影响。需要针对回测结果优化参数,并测试不同的止损和下单方案,找到更适合实盘的设置。此外,参数和过滤条件都需要动态调整,才能应对市场的变化。总体来说,该策略有一定的实战价值,但需要持续优化和验证,才能产生稳定的效果。
||
Overview
The RSI-BB momentum breakout strategy combines the Relative Strength Index (RSI) and Bollinger Bands (BB) indicators for breakout trading. It uses RSI to determine market trends and overbought/oversold levels, and BB to identify breakout points. When both RSI and BB signals align, the strategy will enter long or short trades accordingly.
Strategy Logic
The code first computes the RSI and BB indicators.
The RSI is calculated as:
up = rma(max(change(close), 0), 30)
down = rma(-min(change(close), 0), 30)
rsi = down == 0 ? 100 : up == 0 ? 0 : 100 - (100 / (1 + up / down))
Where up measures the upward price movement over 30 periods, down measures the downward price movement, and rsi is computed based on the ratio of up to down.
The BB is calculated as:
basis = sma(close, 50)
dev = 0.2 * stdev(close, 50)
upper = basis + dev
lower = basis - dev
Where basis is the 50-period moving average, dev is 0.2 times the standard deviation, upper and lower are the bands.
bbi is the bollinger bandwidth index, computed as:
bbr = close>upper? 1 : close<lower? -1 : 0
bbi = bbr - bbr[1]
bbr checks if close breaks upper or lower band. Breakout is 1, breakdown is -1, otherwise 0. bbi is the difference between current and previous bbr. Positive bbi indicates upward breakout, negative indicates downward.
The strategy signals are determined as:
long = rsi>52 and rsi<65 and bbi>0.11 and bbi<0.7
short = rsi<48 and rsi>35 and bbi<-0.11 and bbi>-0.7
Go long when RSI is between 52-65 and BBI is between 0.11 and 0.7. Go short when RSI is between 35-48 and BBI is between -0.11 and -0.7.
Advantages
-
Combining RSI and BB provides more reliable signals. RSI gauges trend and overbought/oversold levels, BB identifies breakout.
-
30-period RSI filters out some market noise and focuses on major trends.
-
50-period BB with 0.2 standard deviation helps filter out whipsaws.
-
BBI thresholds filter fake breakouts.
-
RSI long/short zones of 52-65 and 35-48 provide some buffer to avoid missed trades.
Risks
-
Breakout strategies are prone to being caught in whipsaws, need to manage risk with stop loss.
-
Backtest results may be overfitted, live performance may vary.
-
Extreme market moves may hit stop loss resulting in large losses.
-
RSI and BB parameters including periods and thresholds need to be optimized.
-
Order price can significantly impact live performance.
Enhancement Opportunities
-
Test different combinations of RSI and BB parameters to find optimal settings.
-
Add other indicators like MACD, KD for signal filtration.
-
Optimize RSI long/short zones to filter out more noise.
-
Optimize dynamic BBI thresholds to better filter fakeouts.
-
Add trend filter to avoid trading against major trend.
-
Test different stop loss techniques to find optimal risk control.
-
Test different order types to minimize slippage impact.
Conclusion
The RSI-BB strategy combines the advantages of using trend and momentum indicators. Backtest results are promising but live performance may vary due to real-world factors like slippage and stop loss. Parameters and filters need to be optimized based on backtest results. Stop loss and order placement should also be evaluated for real-world effectiveness. The strategy has merit but requires ongoing enhancements and robustness testing to generate consistent results.
[/trans]
Strategy Arguments
| Argument | Default | Description |
|---|---|---|
| v_input_1 | 50 | length |
| v_input_2 | 0.2 | Mult Factor |
| v_input_3 | 0.1 | alertLevel |
| v_input_4 | 0.75 | impulseLevel |
| v_input_5 | false | showRange |
| v_input_6 | 250 | TP |
| v_input_7 | 20 | SL |
| v_input_8 | false | TS |
Source (PineScript)
/*backtest
start: 2023-10-03 00:00:00
end: 2023-11-02 00:00:00
period: 4h
basePeriod: 15m
exchanges: [{"eid":"Futures_Binance","currency":"BTC_USDT"}]
*/

//@version=4
//Based on Larry Connors RSI-2 Strategy - Lower RSI
strategy(title="Spyfrat Strat", shorttitle="SpyfratStrat", overlay=true)
src = close,
// BB Init
source = close
length = input(50, minval=1)
mult = input(0.2, title="Mult Factor", minval=0.001, maxval=50)
alertLevel=input(0.1)
impulseLevel=input(0.75)
showRange = input(false, type=bool)
//RSI CODE
up = rma(max(change(src), 0), 30)
down = rma(-min(change(src), 0), 30)
rsi = down == 0 ? 100 : up == 0 ? 0 : 100 - (100 / (1 + up / down))
//BB CODE
basis = sma(source, length)
dev = mult * stdev(source, length)
upper = basis + dev
lower = basis - dev
bbr = source>upper?(((source-upper)/(upper-lower))/10): source<lower?(((source-lower)/(upper-lower))/10) : 0.1
bbi = bbr - nz(bbr[1])
//Rule
long = rsi>52 and rsi<65 and  bbi>0.11 and bbi<0.7
short = rsi<48 and rsi>35 and  bbi<-0.11 and bbi>-0.7
//Trade Entry
strategy.entry("long", strategy.long, when=long)
strategy.entry("short", strategy.short, when=short)
//Trade Exit
TP = input(250) * 10
SL = input(20) * 10
TS = input(0) * 10
CQ = 100

TPP = (TP > 0) ? TP : na
SLP = (SL > 0) ? SL : na
TSP = (TS > 0) ? TS : na

strategy.exit("Close Long", "long", qty_percent=CQ, profit=TPP, loss=SLP, trail_points=TSP)
strategy.exit("Close Short", "short", qty_percent=CQ, profit=TPP, loss=SLP, trail_points=TSP)
Detail
https://www.fmz.com/strategy/430977
Last Modified
2023-11-03 15:02:19