
12 KiB
Name
RSI通道价差跟踪策略RSI-Channel-Price-Difference-Tracking-Strategy
Author
ChaoZhang
Strategy Description
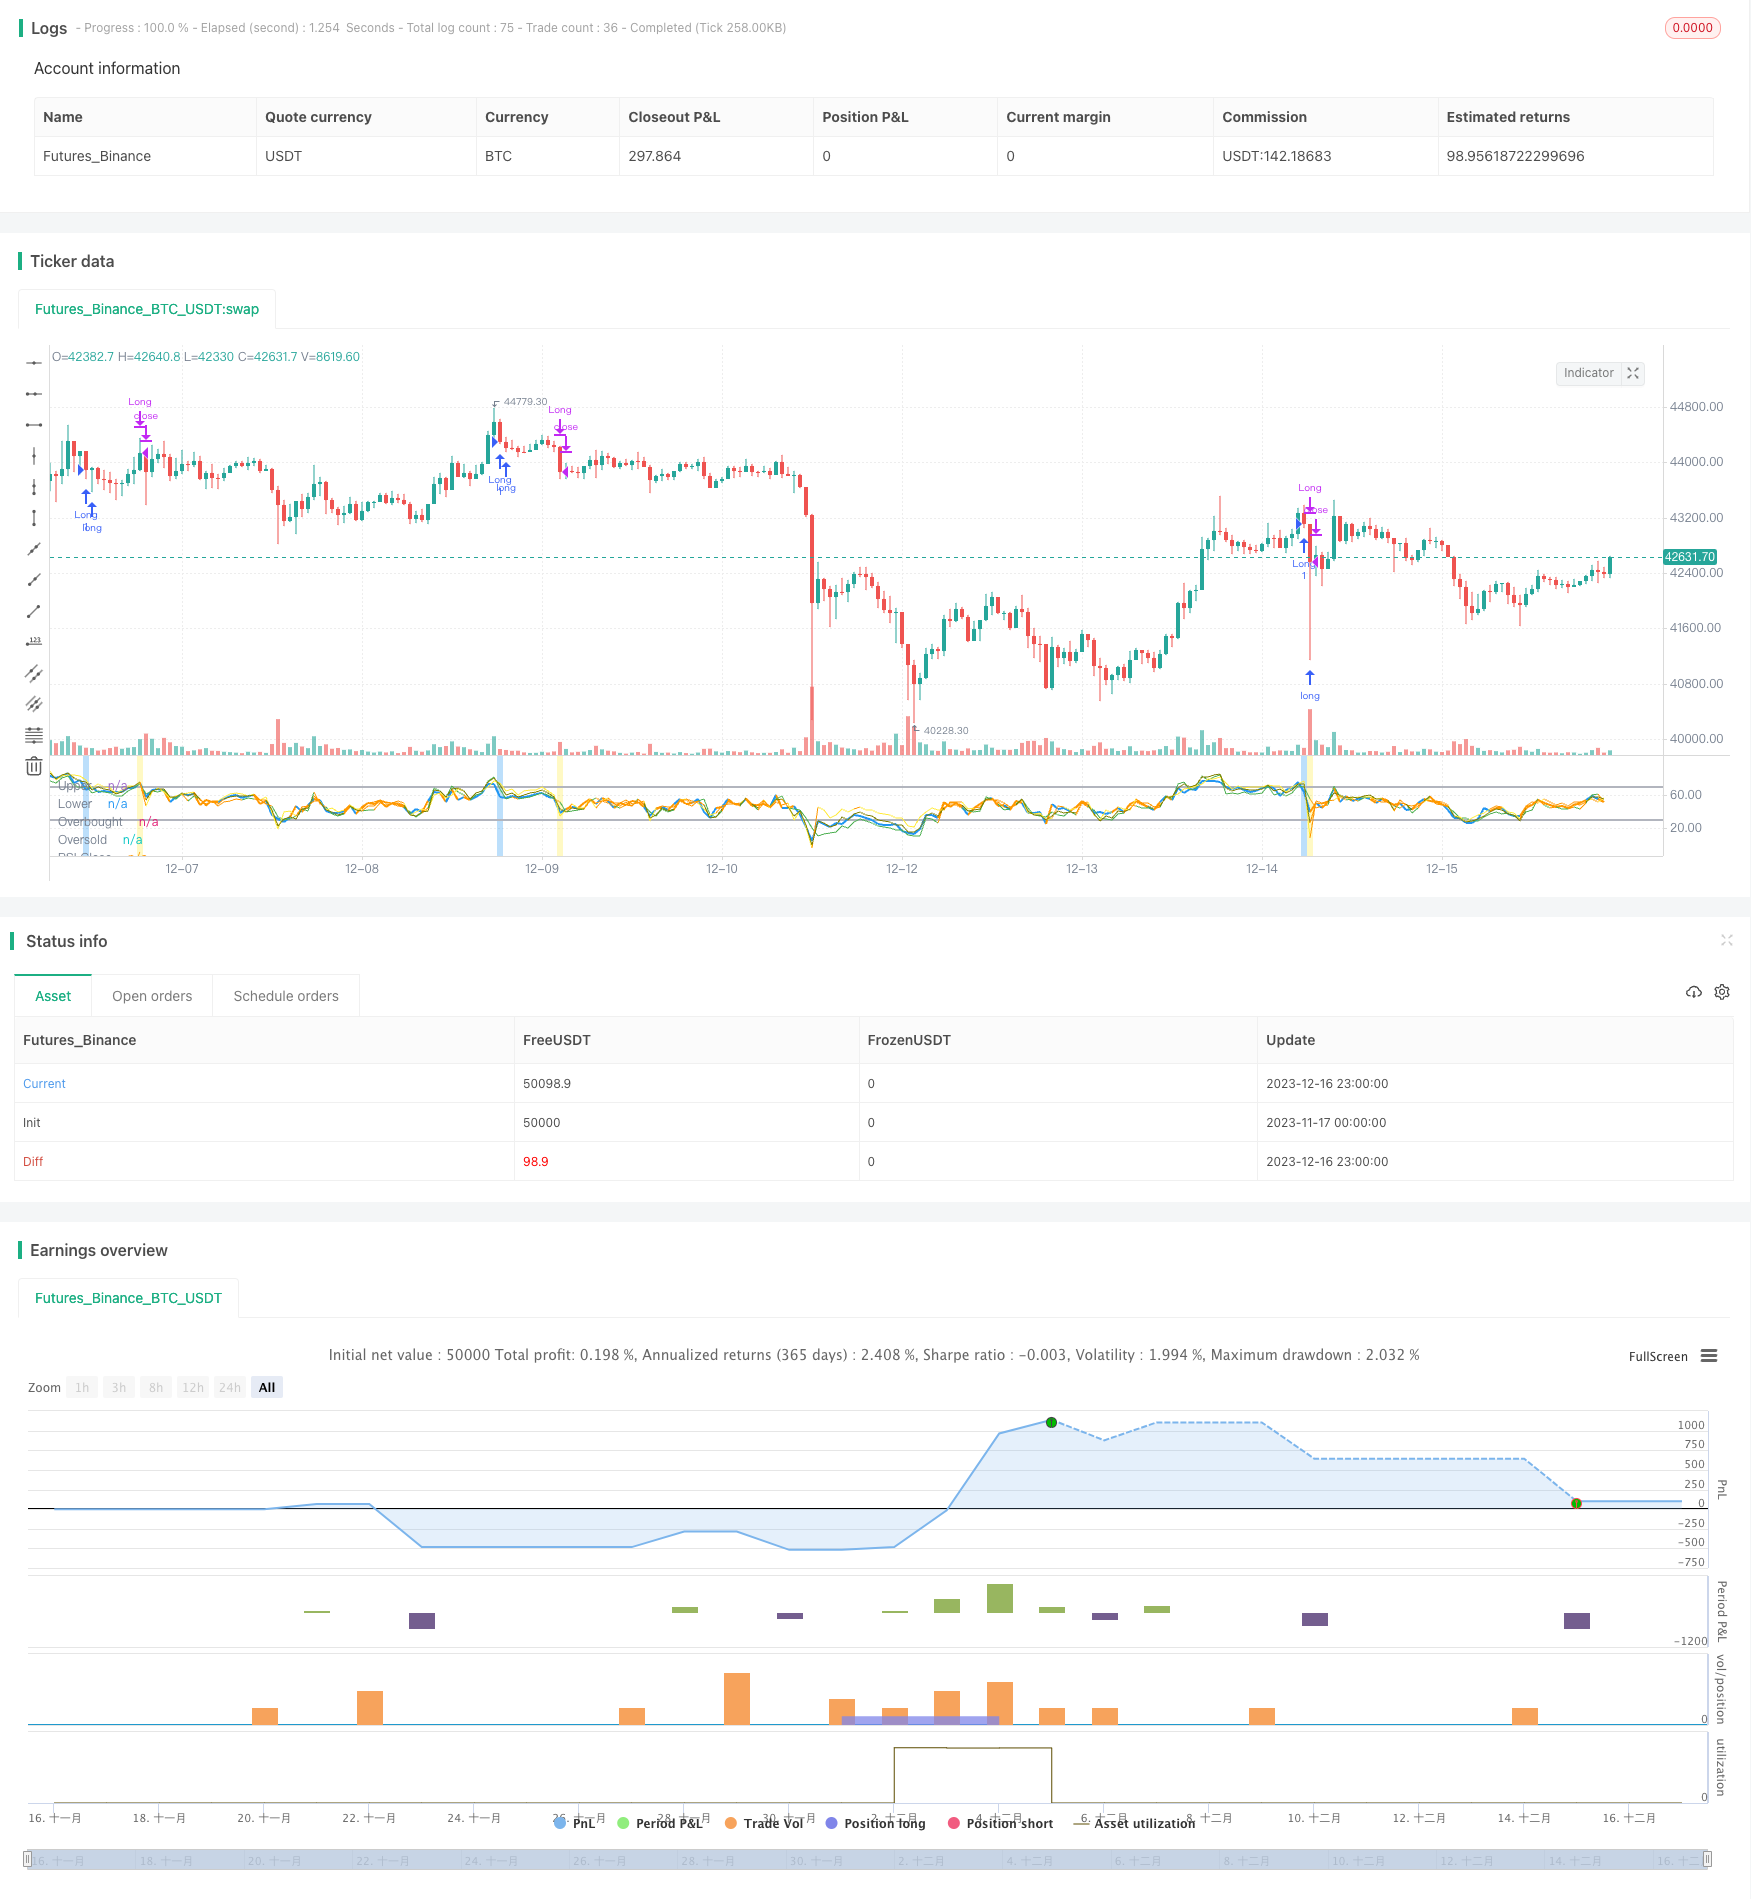 [trans]
概述
RSI通道价差跟踪策略通过跟踪RSI指标在阈值通道内的波动,结合价格的突破来产生交易信号。该策略致力于捕捉加密货币市场中的快速买卖爆发。
策略原理
-
使用Hull移动平均线平滑RSI,生成平滑后的RSI指标。包括收盘价RSI、最高价RSI、最低价RSI和中位数价RSI。
-
设置RSI通道范围为55-45。当RSI指标进入55-45通道,表示进入震荡区间。
-
当收盘价RSI指标从通道上线回落时,并且收盘价低于中位数价,表明价格承压;而此时中位数价RSI指标仍高于通道上限,表明中位数价仍有买入动力,符合追踪中位数价突破的逻辑,因此产生买入信号。
-
当收盘价RSI从通道下限反弹时,并且收盘价高于中位数价,表明价格有支撑;而此时中位数价RSI指标低于通道下限,表明中位数价承压较大,符合追踪中位数价突破的逻辑,因此产生卖出信号。
-
最高价RSI和最低价RSI指标用于及时识别交易信号失效,快速止损。
策略优势
-
使用中位数价突破追踪中位数价的强势方向,符合趋势跟踪的理念。
-
RSI震荡在阈值通道内,提示进入盘整,这时使用中位数价追踪中位数价的强势方向,避免被困在区间震荡中。
-
最高价RSI和最低价RSI指标用于快速识别交易信号失效,进行快速止损,可有效控制亏损。
策略风险
-
RSI指标设定不当可能导致过于灵敏或迟钝。
-
中位数价突破的意义并不总是可靠的,中位数价自身也可能处于震荡。
-
加密货币市场波动较大,止损位置设定过于宽松可能导致亏损扩大。
解决方法:
- 优化RSI参数,使其对价格变化响应适度
- 结合更多指标判断中位数价突破的可靠性
- 适当缩紧止损位置,防止亏损过大
策略优化方向
- 结合更多指标判断中位数价的突破方向
可以引入像布林带等指标,判断中位数价是否接近上下轨,从而提高对中位数价突破方向的判断的准确性。
- 引入机器学习模型辅助判断
使用LSTM等深度学习模型对中位数价的未来走势进行预测,辅助确定中位数价能否成功突破某一方向。
- 使用适应性止损
根据市场波动程度,实时调整止损位置。例如波动加大时,适当收紧止损位置;波动减小时,可以适当放宽止损位置。
总结
RSI通道价差跟踪策略通过跟踪RSI指标在通道内的波动并结合价格的突破来产生交易信号,致力于捕捉加密货币市场的快速买卖爆发。该策略有效结合了趋势追踪和区间识别的方法,在价差缩小时仍可获得较好的交易信号。同时设置的快速止损机制也使得策略风险可控。下一步,可以通过结合更多指标判断和机器学习预测的方法进一步提升策略的可靠性和收益率。
||
Overview
The RSI Channel Price Difference Tracking strategy generates trading signals by tracking fluctuations of RSI indicators within threshold channels combined with price breakouts. The strategy aims to capture fast buy and sell bursts in the crypto market.
Strategy Logic
-
Use Hull Moving Average to smooth the RSI and generate smoothed RSI indicators, including RSI for closing price, highest price, lowest price and median price.
-
Set the RSI channel range to 55-45. When RSI enters into the 55-45 channel, it indicates entering into a shock zone.
-
When closing price RSI drops back from the upper limit of channel, and the closing price is lower than the median price, it indicates that the price is under pressure; however, at this time, the median price RSI is still above the upper limit of channel, indicating that the median price still has buying power that meets the logic of tracking median price breakouts. Therefore, a buy signal is generated.
-
When closing price RSI bounces back from the lower limit of channel, and the closing price is higher than the median price. It indicates that the price has support; but at this time, the median price RSI falls below the lower limit of channel, indicating that the median price has greater pressure, which meets the logic of tracking median price breakouts. Therefore, a sell signal is generated.
-
The highest price RSI and lowest price RSI indicators are used to promptly identify invalid trading signals and realize quick stop losses.
Advantages of the Strategy
-
Using median price breakouts to track the strong direction of median price meets the idea of trend tracking.
-
When RSI fluctuates within the threshold channel, it indicates entering into a shock zone. At this time, using median price to track the strong direction of median price avoids being trapped in range-bound shocks.
-
The highest price RSI and lowest price RSI indicators are used to quickly identify invalid trading signals and realize fast stop losses, which can effectively control losses.
Risks of the Strategy
-
Improper RSI parameter settings may cause too sensitive or slow responses.
-
The significance of median price breakouts is not always reliable, and the median price itself may also fluctuate.
-
High volatility in crypto markets, over-loose stop loss settings may lead to magnified losses.
Solutions:
- Optimize RSI parameters to make proper responses to price changes
- Combine more indicators to judge the reliability of median price breakouts
- Tighten stop loss settings appropriately to prevent huge losses
Directions for Strategy Optimization
- Combine more indicators to judge the breakout direction of the median price
Introduce indicators like Bollinger Bands to judge whether the median price is close to the upper or lower bands, thus improving the accuracy of judging the breakout direction of the median price.
- Introduce machine learning models to assist in judgment
Use LSTM and other deep learning models to predict future trends of the median price and assist in determining whether the median price can successfully break out in a certain direction.
- Use adaptive stop loss
Dynamically adjust stop loss positions based on market volatility. For example, tighten stop loss positions appropriately when volatility rises; loosen stop loss positions appropriately when volatility declines.
Summary
The RSI Channel Price Difference Tracking Strategy generates trading signals by tracking RSI fluctuations within channels combined with price breakouts, aiming to capture fast buy/sell bursts in crypto markets. The strategy effectively combines trend tracking and range identification methods and can still obtain good trading signals when price differences narrow. Meanwhile, the fast stop loss mechanism also makes the risks of the strategy controllable. The next step is to further improve the reliability and profitability of the strategy by combining more indicator judgments and machine learning predictions.
[/trans]
Strategy Arguments
| Argument | Default | Description |
|---|---|---|
| v_input_1 | 13 | (?=== RSI ===)Period |
| v_input_2 | 55 | (?=== Mid Channel ===)Upper |
| v_input_3 | 45 | Lower |
| v_input_4 | 70 | (?=== Over ===)Overbought |
| v_input_5 | 30 | Oversold |
| v_input_6 | 3 | (?=== Hull MA ===)Period |
Source (PineScript)
/*backtest
start: 2023-11-17 00:00:00
end: 2023-12-17 00:00:00
period: 1h
basePeriod: 15m
exchanges: [{"eid":"Futures_Binance","currency":"BTC_USDT"}]
*/

//@version=4
strategy("Hull MA of RSI Strategy",overlay=false)
//+++++++++++++++++++++++++++++++
//++++++++++++ Setup ++++++++++++
//+++++++++++++++++++++++++++++++
// RSI
rsi1_tt="=== RSI ==="
rsi1_len=input(13,title="Period",inline="set",group=rsi1_tt)
//Mid
mid_tt="=== Mid Channel ==="
upper=input(55.0,title="Upper",inline="set",group=mid_tt)
lower=input(45.0,title="Lower",inline="set",group=mid_tt)
//Over
over_tt="=== Over ==="
ovb=input(70.0,title="Overbought",inline="set",group=over_tt)
ovs=input(30.0,title="Oversold",inline="set",group=over_tt)
//++++++++++++++++++++++++++++++++++++++++
//++++++++++++ Hull MA of RSI ++++++++++++
//++++++++++++++++++++++++++++++++++++++++
hma_tt="=== Hull MA ==="
hma_len=input(3,title="Period",inline="set",group=hma_tt)
rsi_c=hma(rsi(close,rsi1_len),hma_len)
rsi_h=hma(rsi(high,rsi1_len),hma_len)
rsi_l=hma(rsi(low,rsi1_len),hma_len)
rsi_hl2=hma(rsi(hl2,rsi1_len),hma_len)
//++++++++++++++++++++++++++++++++
//++++++++++++ Signal ++++++++++++
//++++++++++++++++++++++++++++++++
var order_status="None"
BuySignal=
       crossunder(rsi_c,ovb)
       and
       close<hl2
       and
       rsi_hl2>ovb
       and
       order_status=="None"
CloseBuy=
       order_status[1]=="Long"
       and
       (crossover(rsi_c,ovb)
       or
       crossunder(rsi_l,upper))
SellSignal=
       crossover(rsi_c,ovs)
       and
       close>hl2
       and
       rsi_hl2<ovs
       and
       order_status=="None"
CloseSell=
       order_status[1]=="Short"
       and
       (crossunder(rsi_c,ovs)
       or
       crossover(rsi_h,lower))
ExitSignal=
       CloseBuy
       or
       CloseSell
if BuySignal
    order_status:="Long"
if SellSignal
    order_status:="Short"
if ExitSignal
    order_status:="None"

//+++++++++++++++++++++++++++++++++++
//++++++++++++ Plot Line ++++++++++++
//+++++++++++++++++++++++++++++++++++
rsi_c_col=
       rsi_c>upper?color.new(color.blue,0):
       rsi_c<lower?color.new(color.blue,0):
       color.new(color.orange,0)
rsi_h_col=
       rsi_h>upper?color.new(color.green,0):
       rsi_h<lower?color.new(color.green,0):
       color.new(color.orange,0)
rsi_l_col=
       rsi_l>upper?color.new(color.yellow,0):
       rsi_l<lower?color.new(color.yellow,0):
       color.new(color.orange,0)
rsi_hl2_col=
       rsi_hl2>upper?color.new(color.olive,0):
       rsi_hl2<lower?color.new(color.olive,0):
       color.new(color.orange,0)
plot(rsi_c,title="RSI Close",color=rsi_c_col,linewidth=2)
plot(rsi_h,title="RSI High",color=rsi_h_col,linewidth=1)
plot(rsi_l,title="RSI Low",color=rsi_l_col,linewidth=1)
plot(rsi_hl2,title="RSI HL2",color=rsi_hl2_col,linewidth=1)
upper_line=hline(upper,title="Upper",color=color.new(color.black,100))
lower_line=hline(lower,title="Lower",color=color.new(color.black,100))
fill(upper_line,lower_line,title="Mid Channel",color=color.silver)
ovb_line=hline(ovb,title="Overbought",color=color.new(color.silver,0),linestyle=hline.style_solid,linewidth=2)
ovs_line=hline(ovs,title="Oversold",color=color.new(color.silver,0),linestyle=hline.style_solid,linewidth=2)

//++++++++++++++++++++++++++++++++++++++++++++++++
//++++++++++++ Plot Analyzing Signals ++++++++++++
//++++++++++++++++++++++++++++++++++++++++++++++++
//Color
buy_col=
       BuySignal?color.new(color.blue,70):na
sell_col=
       SellSignal?color.new(color.red,70):na
close_buy_col=
       CloseBuy and order_status[1]=="Long"?color.new(color.yellow,70):na
close_sell_col=
       CloseSell and order_status[1]=="Short"?color.new(color.yellow,70):na
//Background
bgcolor(close_buy_col, title='Close Buy', offset=0)
bgcolor(close_sell_col, title='Close Sell', offset=0)
bgcolor(sell_col, title='Sell', offset=0)
bgcolor(buy_col, title='Buy', offset=0)
//++++++++++++++++++++++++++++++++++
//++++++++++++ Backtest ++++++++++++
//++++++++++++++++++++++++++++++++++
strategy.entry("Long",strategy.long,when=BuySignal)
strategy.close("Long",when=CloseBuy)
strategy.entry("Short",strategy.short,when=SellSignal)
strategy.close("Short",when=CloseSell)
//EOF
Detail
https://www.fmz.com/strategy/435774
Last Modified
2023-12-18 17:48:24