
9.0 KiB
Name
RSI轴向均线交叉策略RSI-Axial-Moving-Average-Crossover-Strategy
Author
ChaoZhang
Strategy Description
[trans]
概述
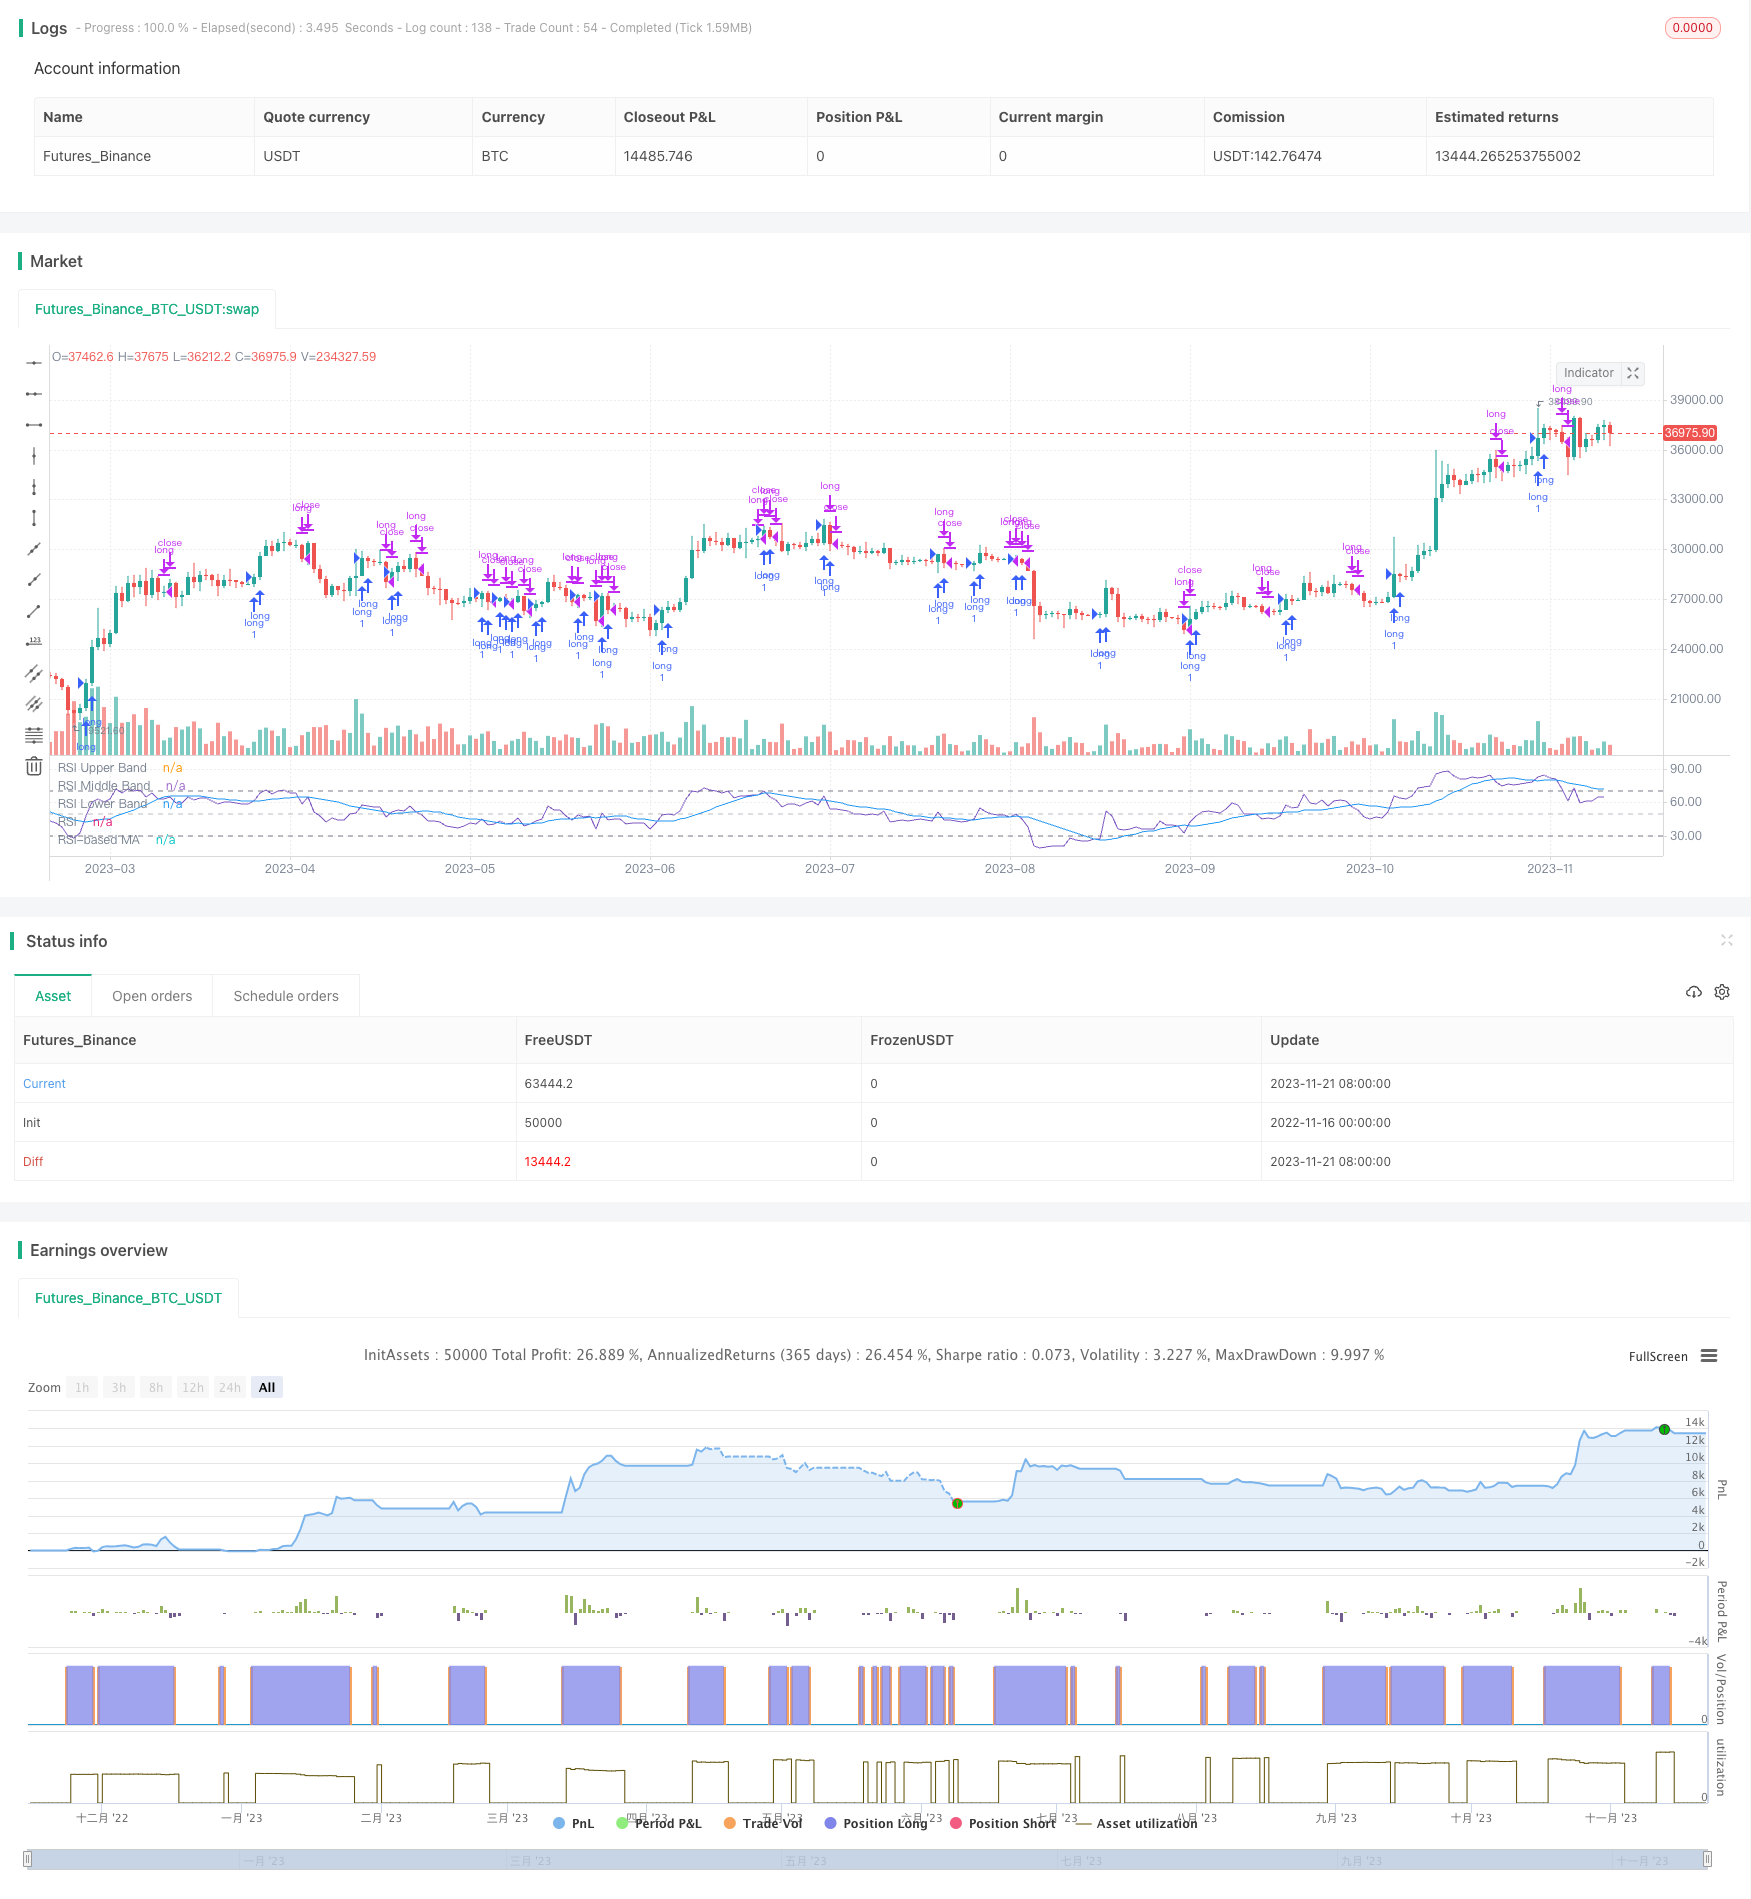
RSI轴向均线交叉策略通过计算RSI指标及其简单移动平均线,并观察二者的金叉死叉来判断入场出场。该策略同时结合布林带为RSI轴向均线增加支撑阻力判断。
策略原理
该策略首先计算14日RSI指标,然后计算RSI指标的8日简单移动平均线。当RSI指标从下向上突破其移动平均线时产生买入信号;当RSI从上向下跌破其移动平均线时产生卖出信号。
同时,该策略为RSI轴向均线增加布林带判定。布林带通过计算标准差来判断RSI轴向均线是否已经相对过于拥挤,从而避免买入高点,卖出低点。
优势分析
RSI轴向均线交叉策略结合了趋势性指标RSI和曲线顺势指标移动平均线,能够有效判断市场趋势和随机性。RSI指标的算术平均能较好地平滑价格波动对信号的影响。
该策略加入的布林带使用标准差原理,能够自动调整上下轨的宽度,有效防止交易信号的错乱。当布林带收窄时,表示变化渐趋平缓,适合寻找反转机会;而当布林带扩大时,表示行情剧烈波动的时期,适合跟踪趋势。
风险分析
RSI轴向均线交叉策略最大的风险在于RSI指标和移动平均线本身的滞后性。当快速行情来临时,指标的计算和趋势判定都会有一定的滞后。这会导致买点被抬高,卖点被压低。
另一个主要风险是趋势牛熊转换时指标的误导。当行情出现转折而RSI和均线指标还没有反应过来时,会产生错误的交易信号从而造成损失。
解决方法包括适当调整RSI参数,缩短均线周期;加入趋势型指标辅助判断;适当放宽止损范围。
优化方向
RSI轴向均线交叉策略可以从以下几个方向进行优化:
-
优化RSI参数:调整RSI的长度可以平衡灵敏度和稳定性
-
优化移动平均线参数:调整均线类型和周期参数,优化指标的顺势性
-
增加止损机制:设定移动止损或时间止损,控制单笔损失
-
结合趋势指标:加入MACD,KDJ等指标,避免反转误判
-
多时间框架验证:利用更高时间框架确定趋势,避免被套
总结
RSI轴向均线交叉策略整体来说是一个比较成熟的量化交易策略。它融合了多种技术指标的优势,通过参数调整和多维度优化,可以进入市场的主流行情。该策略最大的风险在于指标的滞后性,需要搭配止损来控制损失。如果运用得当,RSI轴向均线交叉策略可以获得较为稳定的投资回报。 ||
Overview
The RSI Axial Moving Average Crossover Strategy generates trading signals by calculating the RSI indicator and its simple moving average line and observing golden crosses and dead crosses between the two. The strategy also incorporates Bollinger Bands to add support/resistance judgment for the RSI axial moving average line.
Strategy Logic
The strategy first calculates the 14-day RSI indicator, followed by the 8-day simple moving average line of the RSI indicator. A buy signal is generated when the RSI indicator crosses above its moving average line, while a sell signal is generated when the RSI crosses below its moving average line.
At the same time, the strategy adds Bollinger Bands to determine if the RSI axial moving average line is relatively overcrowded by calculating the standard deviation, thus avoiding buying peaks and selling bottoms.
Advantage Analysis
The RSI Axial Moving Average Crossover Strategy combines the trending indicator RSI and the curve-following indicator moving average line, which can effectively determine market trends and randomness. The arithmetic average of the RSI indicator can smooth out the impact of price fluctuations on signals.
The Bollinger Bands added in this strategy use the principle of standard deviation to automatically adjust the width of the upper and lower tracks, effectively preventing erroneous trading signals. When the Bollinger Bands narrow, it indicates that the change is gradually slowing down, which is suitable for looking for reversal opportunities. When the Bollinger Bands expand, it indicates a period of violent market fluctuation, which is suitable for tracking trends.
Risk Analysis
The biggest risk of the RSI Axial Moving Average Crossover Strategy is the lagging of the RSI indicator and moving average lines themselves. When rapid market movements occur, the indicator calculation and trend judgment will lag to some extent. This will lead to raised buy points and lowered sell points.
Another major risk is the misguidance of indicators when market trend turns from bull to bear or vice versa, while RSI and MA indicators fail to react in time, resulting in losing trades.
Solutions include appropriately adjusting RSI parameters, shortening MA periods, adding trend indicators to assist in judgment, and appropriately widening stop loss range.
Optimization Directions
The RSI Axial Moving Average Crossover Strategy can be optimized in the following aspects:
-
Optimize RSI parameters: Adjust RSI length to balance sensitivity and stability
-
Optimize MA parameters: Adjust MA type and period parameters to optimize trend-following
-
Add stop loss mechanisms: Set moving or time stop loss to control single loss
-
Incorporate trend indicators: Add MACD, KDJ etc. to avoid reversal misjudgements
-
Multi-timeframe verification: Use higher timeframes to determine trends to avoid being trapped
Conclusion
The RSI Axial Moving Average Crossover Strategy is an overall mature quantitative trading strategy. It combines the advantages of multiple technical indicators and can catch mainstream market moves through parameter tuning and multi-dimensional optimization. The biggest risk is the lagging of indicators, which needs to be addressed by stop losses to control losses. When properly implemented, this strategy can yield relatively stable investment returns.
[/trans]
Strategy Arguments
| Argument | Default | Description |
|---|---|---|
| v_input_int_1 | 14 | (?RSI Settings)RSI Length |
| v_input_source_1_close | 0 | Source: close |
| v_input_string_1 | 0 | (?MA Settings)MA Type: SMA |
| v_input_int_2 | 14 | MA Length |
| v_input_float_1 | 2 | BB StdDev |
Source (PineScript)
/*backtest
start: 2022-11-16 00:00:00
end: 2023-11-22 00:00:00
period: 1d
basePeriod: 1h
exchanges: [{"eid":"Futures_Binance","currency":"BTC_USDT"}]
*/

//@version=5
// Copyright (c) 2020-present, Alex Orekhov (everget)
// Corrected Moving Average script may be freely distributed under the terms of the GPL-3.0 license.
strategy('rsisma', shorttitle='rsisma')

ma(source, length, type) =>
    switch type
        "SMA" => ta.sma(source, length)
        "Bollinger Bands" => ta.sma(source, length)
        "EMA" => ta.ema(source, length)
        "SMMA (RMA)" => ta.rma(source, length)
        "WMA" => ta.wma(source, length)
        "VWMA" => ta.vwma(source, length)

rsiLengthInput = input.int(14, minval=1, title="RSI Length", group="RSI Settings")
rsiSourceInput = input.source(close, "Source", group="RSI Settings")
maTypeInput = input.string("SMA", title="MA Type", options=["SMA", "Bollinger Bands", "EMA", "SMMA (RMA)", "WMA", "VWMA"], group="MA Settings")
maLengthInput = input.int(14, title="MA Length", group="MA Settings")
bbMultInput = input.float(2.0, minval=0.001, maxval=50, title="BB StdDev", group="MA Settings")

up = ta.rma(math.max(ta.change(rsiSourceInput), 0), rsiLengthInput)
down = ta.rma(-math.min(ta.change(rsiSourceInput), 0), rsiLengthInput)
rsi = down == 0 ? 100 : up == 0 ? 0 : 100 - (100 / (1 + up / down))
rsiMA = ma(rsi, maLengthInput, maTypeInput)
isBB = maTypeInput == "Bollinger Bands"

plot(rsi, "RSI", color=#7E57C2)
plot(rsiMA, "RSI-based MA", color=color.blue)
rsiUpperBand = hline(70, "RSI Upper Band", color=#787B86)
hline(50, "RSI Middle Band", color=color.new(#787B86, 50))
rsiLowerBand = hline(30, "RSI Lower Band", color=#787B86)
fill(rsiUpperBand, rsiLowerBand, color=color.rgb(126, 87, 194, 90), title="RSI Background Fill")
bbUpperBand = plot(isBB ? rsiMA + ta.stdev(rsi, maLengthInput) * bbMultInput : na, title = "Upper Bollinger Band", color=color.green)
bbLowerBand = plot(isBB ? rsiMA - ta.stdev(rsi, maLengthInput) * bbMultInput : na, title = "Lower Bollinger Band", color=color.green)
fill(bbUpperBand, bbLowerBand, color= isBB ? color.new(color.green, 90) : na, title="Bollinger Bands Background Fill")


long = ta.crossover(rsi, rsiMA)
short = ta.crossunder(rsi, rsiMA)
if long
    strategy.entry("long", strategy.long)
if short
    strategy.close("long", comment = "long TP")


// long1 = close * 9
// long2 = long1 / 100
// long3 = long2 + close


//plot(long3,color=color.blue)
// if short
//     strategy.entry("short", strategy.short)
// if long
//     strategy.close("short", comment = "short TP")
Detail
https://www.fmz.com/strategy/433021
Last Modified
2023-11-23 16:45:55