
8.7 KiB
Name
RSI趋势策略-RSI-Trend-Strategy
Author
ChaoZhang
Strategy Description
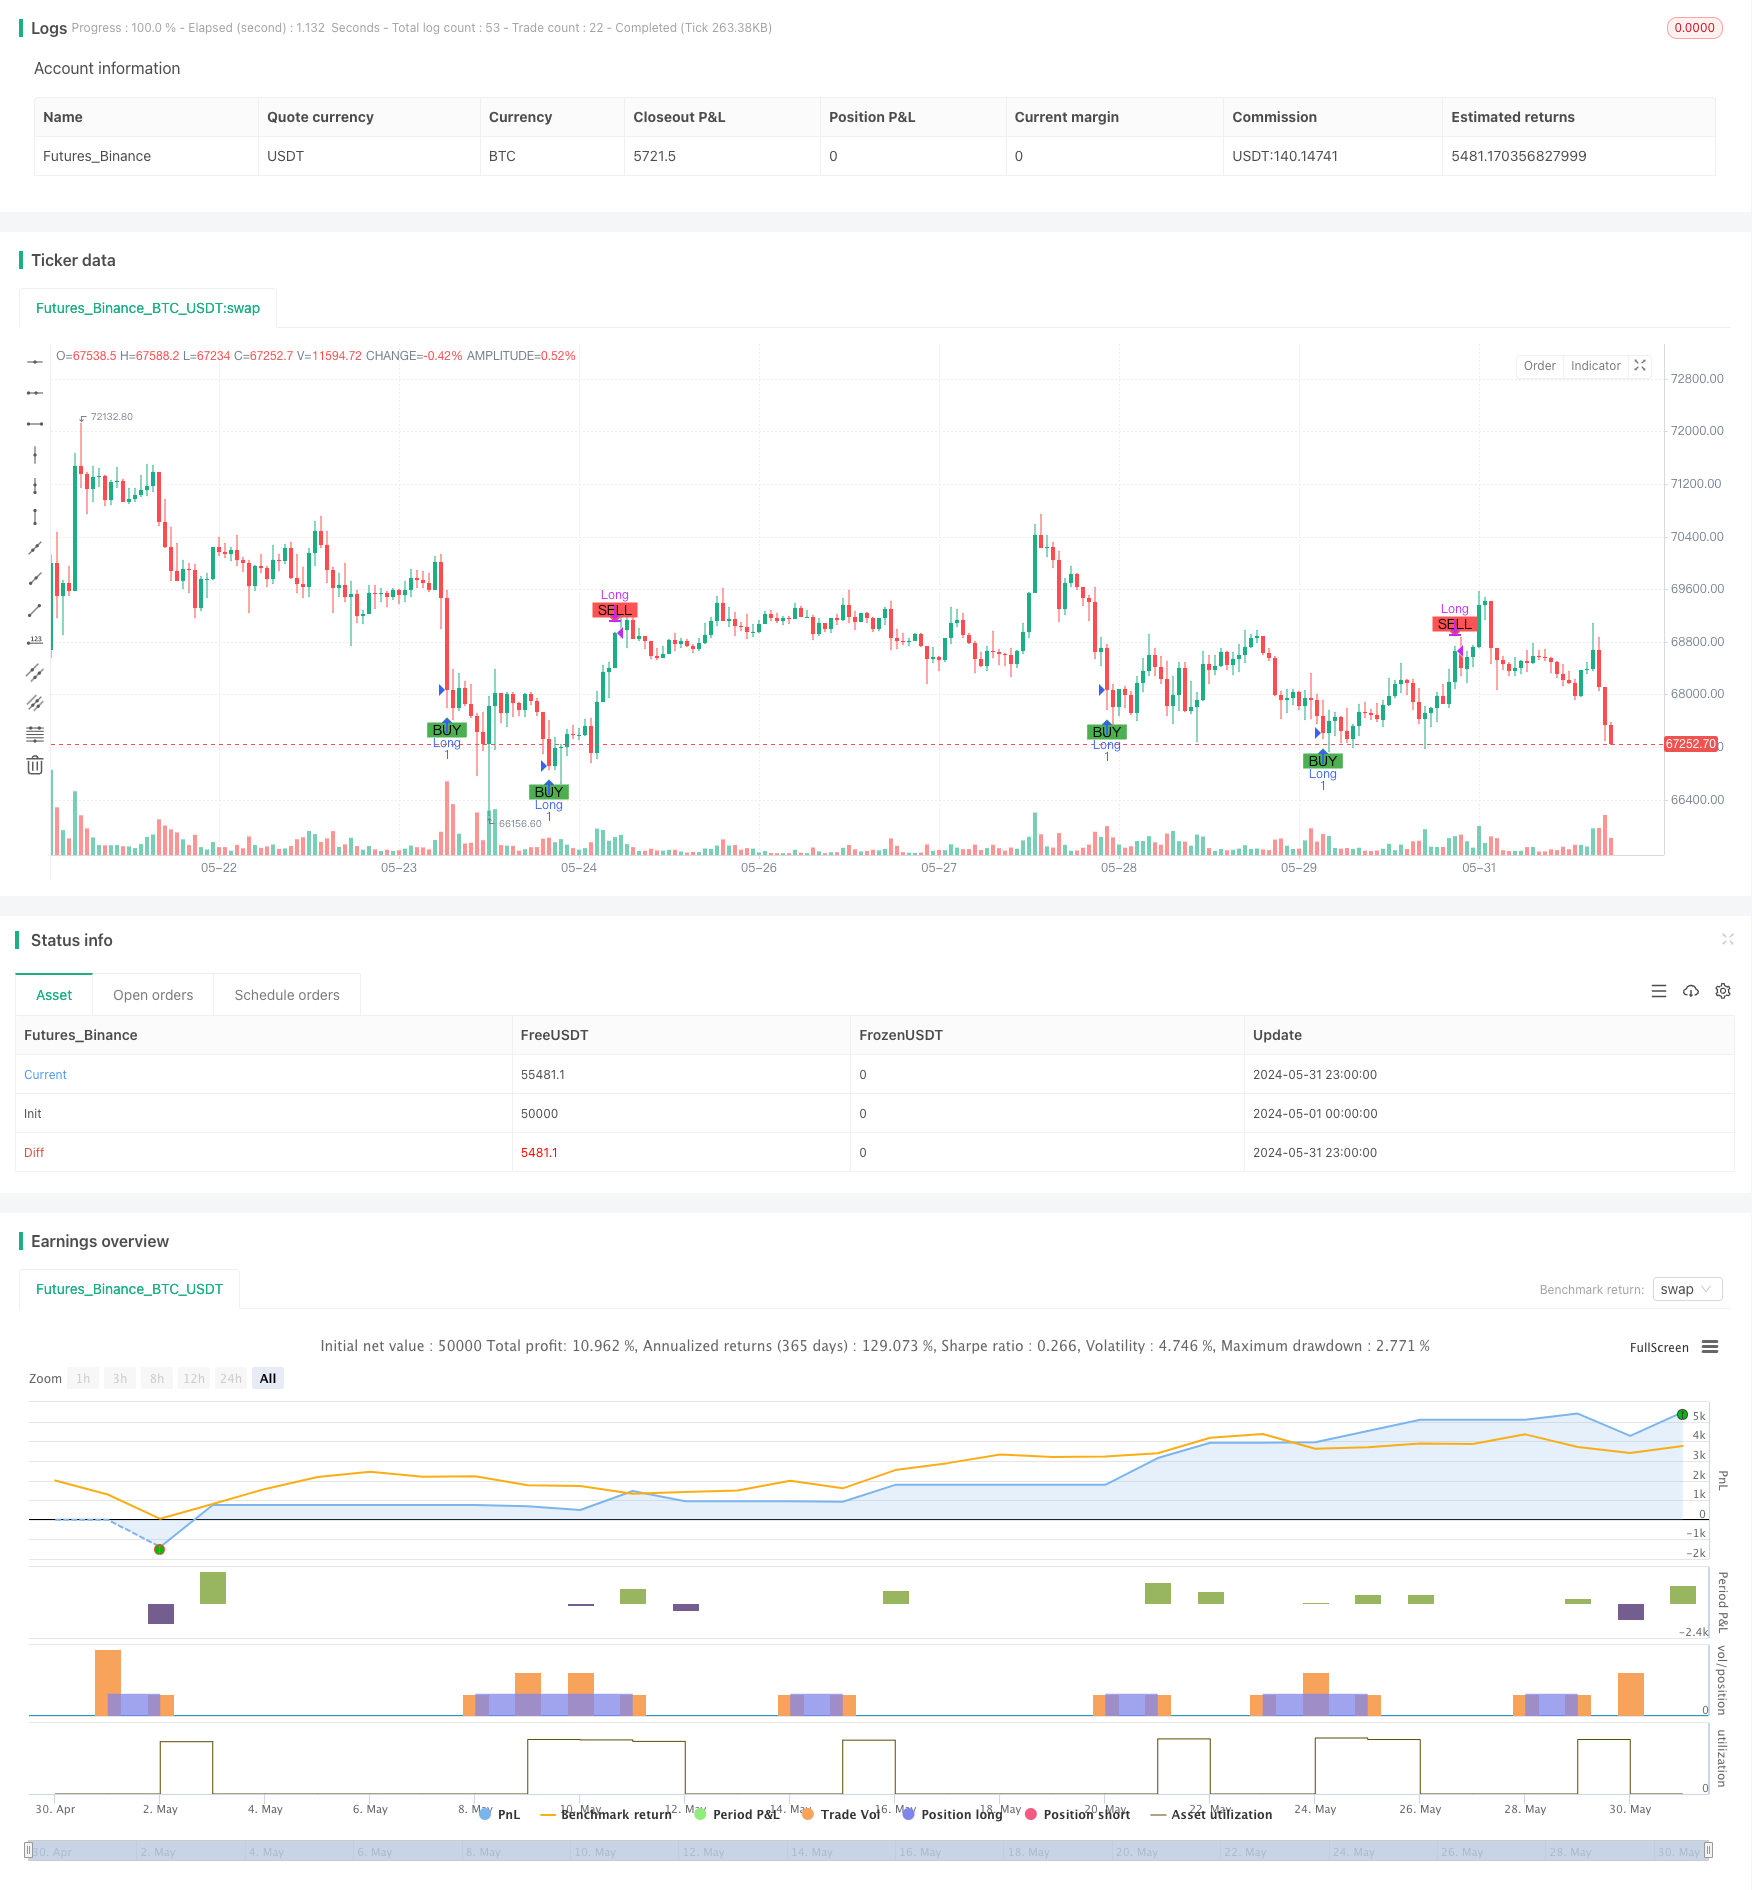
[trans]
概述
该策略基于相对强弱指数(RSI)指标,通过判断RSI指标的值是否超过预设的上下阈值来确定买入和卖出信号。同时,该策略还设置了止损和持仓时间限制,以控制风险。
策略原理
- 计算RSI指标的值。
- 当RSI值低于预设的买入阈值时,产生买入信号;当RSI值高于预设的卖出阈值时,产生卖出信号。
- 根据买入信号,以当前收盘价计算买入数量,并下单买入。
- 如果设置了止损比例,则计算止损价格,并下单止损。
- 根据卖出信号或止损条件,平仓所有持仓。
- 如果设置了最大持仓时间,则在持仓时间超过最大持仓时间后,无论盈亏,都平仓所有持仓。
策略优势
- RSI指标是一个广泛使用的技术分析指标,能够有效地捕捉市场的超买和超卖信号。
- 该策略引入了止损和持仓时间限制,有助于控制风险。
- 策略逻辑清晰,易于理解和实现。
- 通过调整RSI的参数和阈值,可以适应不同的市场环境。
策略风险
- RSI指标在某些情况下可能会发出错误信号,导致策略出现亏损。
- 该策略没有考虑交易品种的基本面因素,仅依赖技术指标,可能面临市场突发事件的风险。
- 固定的止损比例可能无法适应市场的波动性变化。
- 策略的表现可能受到参数设置的影响,不恰当的参数可能导致策略表现不佳。
策略优化方向
- 引入其他技术指标,如移动平均线,以提高策略的可靠性。
- 优化止损策略,如采用移动止损或基于波动率的动态止损。
- 根据市场情况动态调整RSI的参数和阈值。
- 结合对交易品种基本面的分析,以改善策略的风险控制能力。
- 对策略进行回测和参数优化,以找到最佳的参数组合。
总结
该策略利用RSI指标捕捉市场的超买和超卖信号,同时引入止损和持仓时间限制以控制风险。策略逻辑简单明了,易于实现和优化。然而,策略的表现可能受到市场波动和参数设置的影响,因此需要结合其他分析方法和风险管理手段,以提高策略的稳健性和盈利能力。
||
Overview
This strategy is based on the Relative Strength Index (RSI) indicator. It determines buy and sell signals by judging whether the RSI value exceeds preset upper and lower thresholds. Additionally, the strategy sets stop-loss and position duration limits to control risk.
Strategy Principle
- Calculate the value of the RSI indicator.
- When the RSI value is below the preset buy threshold, generate a buy signal; when the RSI value is above the preset sell threshold, generate a sell signal.
- Based on the buy signal, calculate the buy quantity at the current closing price and place a buy order.
- If a stop-loss percentage is set, calculate the stop-loss price and place a stop-loss order.
- Close all positions based on the sell signal or stop-loss condition.
- If a maximum position duration is set, close all positions after the position duration exceeds the maximum, regardless of profit or loss.
Strategy Advantages
- The RSI indicator is a widely used technical analysis indicator that can effectively capture overbought and oversold signals in the market.
- The strategy incorporates stop-loss and position duration limits, which help control risk.
- The strategy logic is clear and easy to understand and implement.
- By adjusting the parameters and thresholds of the RSI, the strategy can adapt to different market environments.
Strategy Risks
- In some cases, the RSI indicator may generate false signals, leading to losses in the strategy.
- The strategy does not consider the fundamental factors of the trading instrument and relies solely on technical indicators, which may face risks from unexpected market events.
- Fixed stop-loss percentages may not adapt to changes in market volatility.
- The performance of the strategy may be affected by parameter settings, and inappropriate parameters may lead to poor strategy performance.
Strategy Optimization Directions
- Introduce other technical indicators, such as moving averages, to improve the reliability of the strategy.
- Optimize the stop-loss strategy, such as using trailing stop-loss or dynamic stop-loss based on volatility.
- Dynamically adjust the parameters and thresholds of the RSI according to market conditions.
- Combine the analysis of the fundamental aspects of the trading instrument to improve the risk control ability of the strategy.
- Perform backtesting and parameter optimization on the strategy to find the optimal parameter combination.
Summary
This strategy utilizes the RSI indicator to capture overbought and oversold signals in the market while introducing stop-loss and position duration limits to control risk. The strategy logic is simple and straightforward, easy to implement and optimize. However, the performance of the strategy may be affected by market volatility and parameter settings. Therefore, it is necessary to combine other analysis methods and risk management measures to improve the robustness and profitability of the strategy. [/trans]
Source (PineScript)
/*backtest
start: 2024-05-01 00:00:00
end: 2024-05-31 23:59:59
period: 1h
basePeriod: 15m
exchanges: [{"eid":"Futures_Binance","currency":"BTC_USDT"}]
*/

//@version=5
strategy("Simple RSI Strategy", overlay=true,  initial_capital=20, commission_value=0.1, commission_type=strategy.commission.percent)

// Define the hardcoded date (Year, Month, Day, Hour, Minute)
var hardcodedYear = 2024
var hardcodedMonth = 6
var hardcodedDay = 10

// Convert the hardcoded date to a timestamp
var start_date = timestamp(hardcodedYear, hardcodedMonth, hardcodedDay)

// settings
order_size_usdt = input.float(20, title="Order Size (USDT)")
rsiLength = input.int(9, title="RSI Length")
rsiBuyThreshold = input.int(30, title="RSI Buy Threshold")
rsiSellThreshold = input.int(70, title="RSI Sell Threshold")
rsibuystrat = input.int(1, title="buy strat 1=achieved,2=recross")
rsisellstrat = input.int(1, title="sell strat 1=achieved,2=recross")
stoploss = input.int(1, title="Stop loss percent")
max_duration = input(24, title="Max Position Duration (hours)")*60

// emaPeriod = input.int(50, title="EMA Period")
// smaPeriod = input.int(200, title="SMA Period")

rsi = ta.rsi(close, rsiLength)
// ma_rsi = ta.sma(rsi, rsiLength)
// ema = ta.ema(close,emaPeriod)
// sma = ta.sma(close,smaPeriod)
// plot(sma, color=color.red, title="exp Moving Average")
// plot(smal, color=color.blue, title="Simple Moving Average")

longCondition = ((ta.crossunder(rsi, rsiBuyThreshold) and rsibuystrat==1) or (ta.crossover(rsi, rsiBuyThreshold) and rsibuystrat==2) ) and strategy.position_size == 0
shortCondition = ( (ta.crossover(rsi, rsiSellThreshold) and rsisellstrat==1) or (ta.crossunder(rsi, rsiSellThreshold) and rsisellstrat==2) ) and strategy.position_size > 0

// Execute Buy and Sell orders
if (longCondition)
	positionSize = order_size_usdt / close
	strategy.entry("Long", strategy.long,qty=positionSize)
	if (stoploss>0)
		stopLossPrice = close * (1 - stoploss/100 )
		strategy.exit("Stop Loss", from_entry="Long", stop=stopLossPrice)

if (shortCondition )//or stopCondition)
	strategy.close("Long")

//add condition open time
if (strategy.position_size > 0 and max_duration >0)
	var float entry_time = na
	if (strategy.opentrades > 0)
		entry_time := nz(strategy.opentrades.entry_time(0), na)
	else
		entry_time := na

	current_time = time
	var float duration_minutes = -1
	if (not na(entry_time))
		duration_minutes := (current_time - entry_time) / 60000


	// Close positions after a certain duration (e.g., 60 minutes)
	// if ( duration_minutes > max_duration and close>=strategy.opentrades.entry_price(0))
	if ( duration_minutes > max_duration )
		label.new(bar_index, high, text="Duration: " + str.tostring(duration_minutes/60) + " hrs", color=color.blue, textcolor=color.white, style=label.style_label_down, size=size.small)
		strategy.close("Long")


// Plot Buy and Sell signals
plotshape(series=longCondition, title="Buy Signal", location=location.belowbar, color=color.green, style=shape.labelup, text="BUY")
plotshape(series=shortCondition, title="Sell Signal", location=location.abovebar, color=color.red, style=shape.labeldown, text="SELL")
//plotshape(series=stopCondition, title="stop Sell Signal", location=location.abovebar, color=color.red, style=shape.labeldown, text="SELL")

// Plot RSI
// hline(rsiBuyThreshold, "RSI Buy Threshold", color=color.green)
// hline(rsiSellThreshold, "RSI Sell Threshold", color=color.red)
Detail
https://www.fmz.com/strategy/454144
Last Modified
2024-06-14 15:28:38