
8.2 KiB
Name
RSI趋势动量交易策略结合双均线和成交量确认-RSI-Trend-Momentum-Trading-Strategy-with-Dual-MA-and-Volume-Confirmation
Author
ChaoZhang
Strategy Description
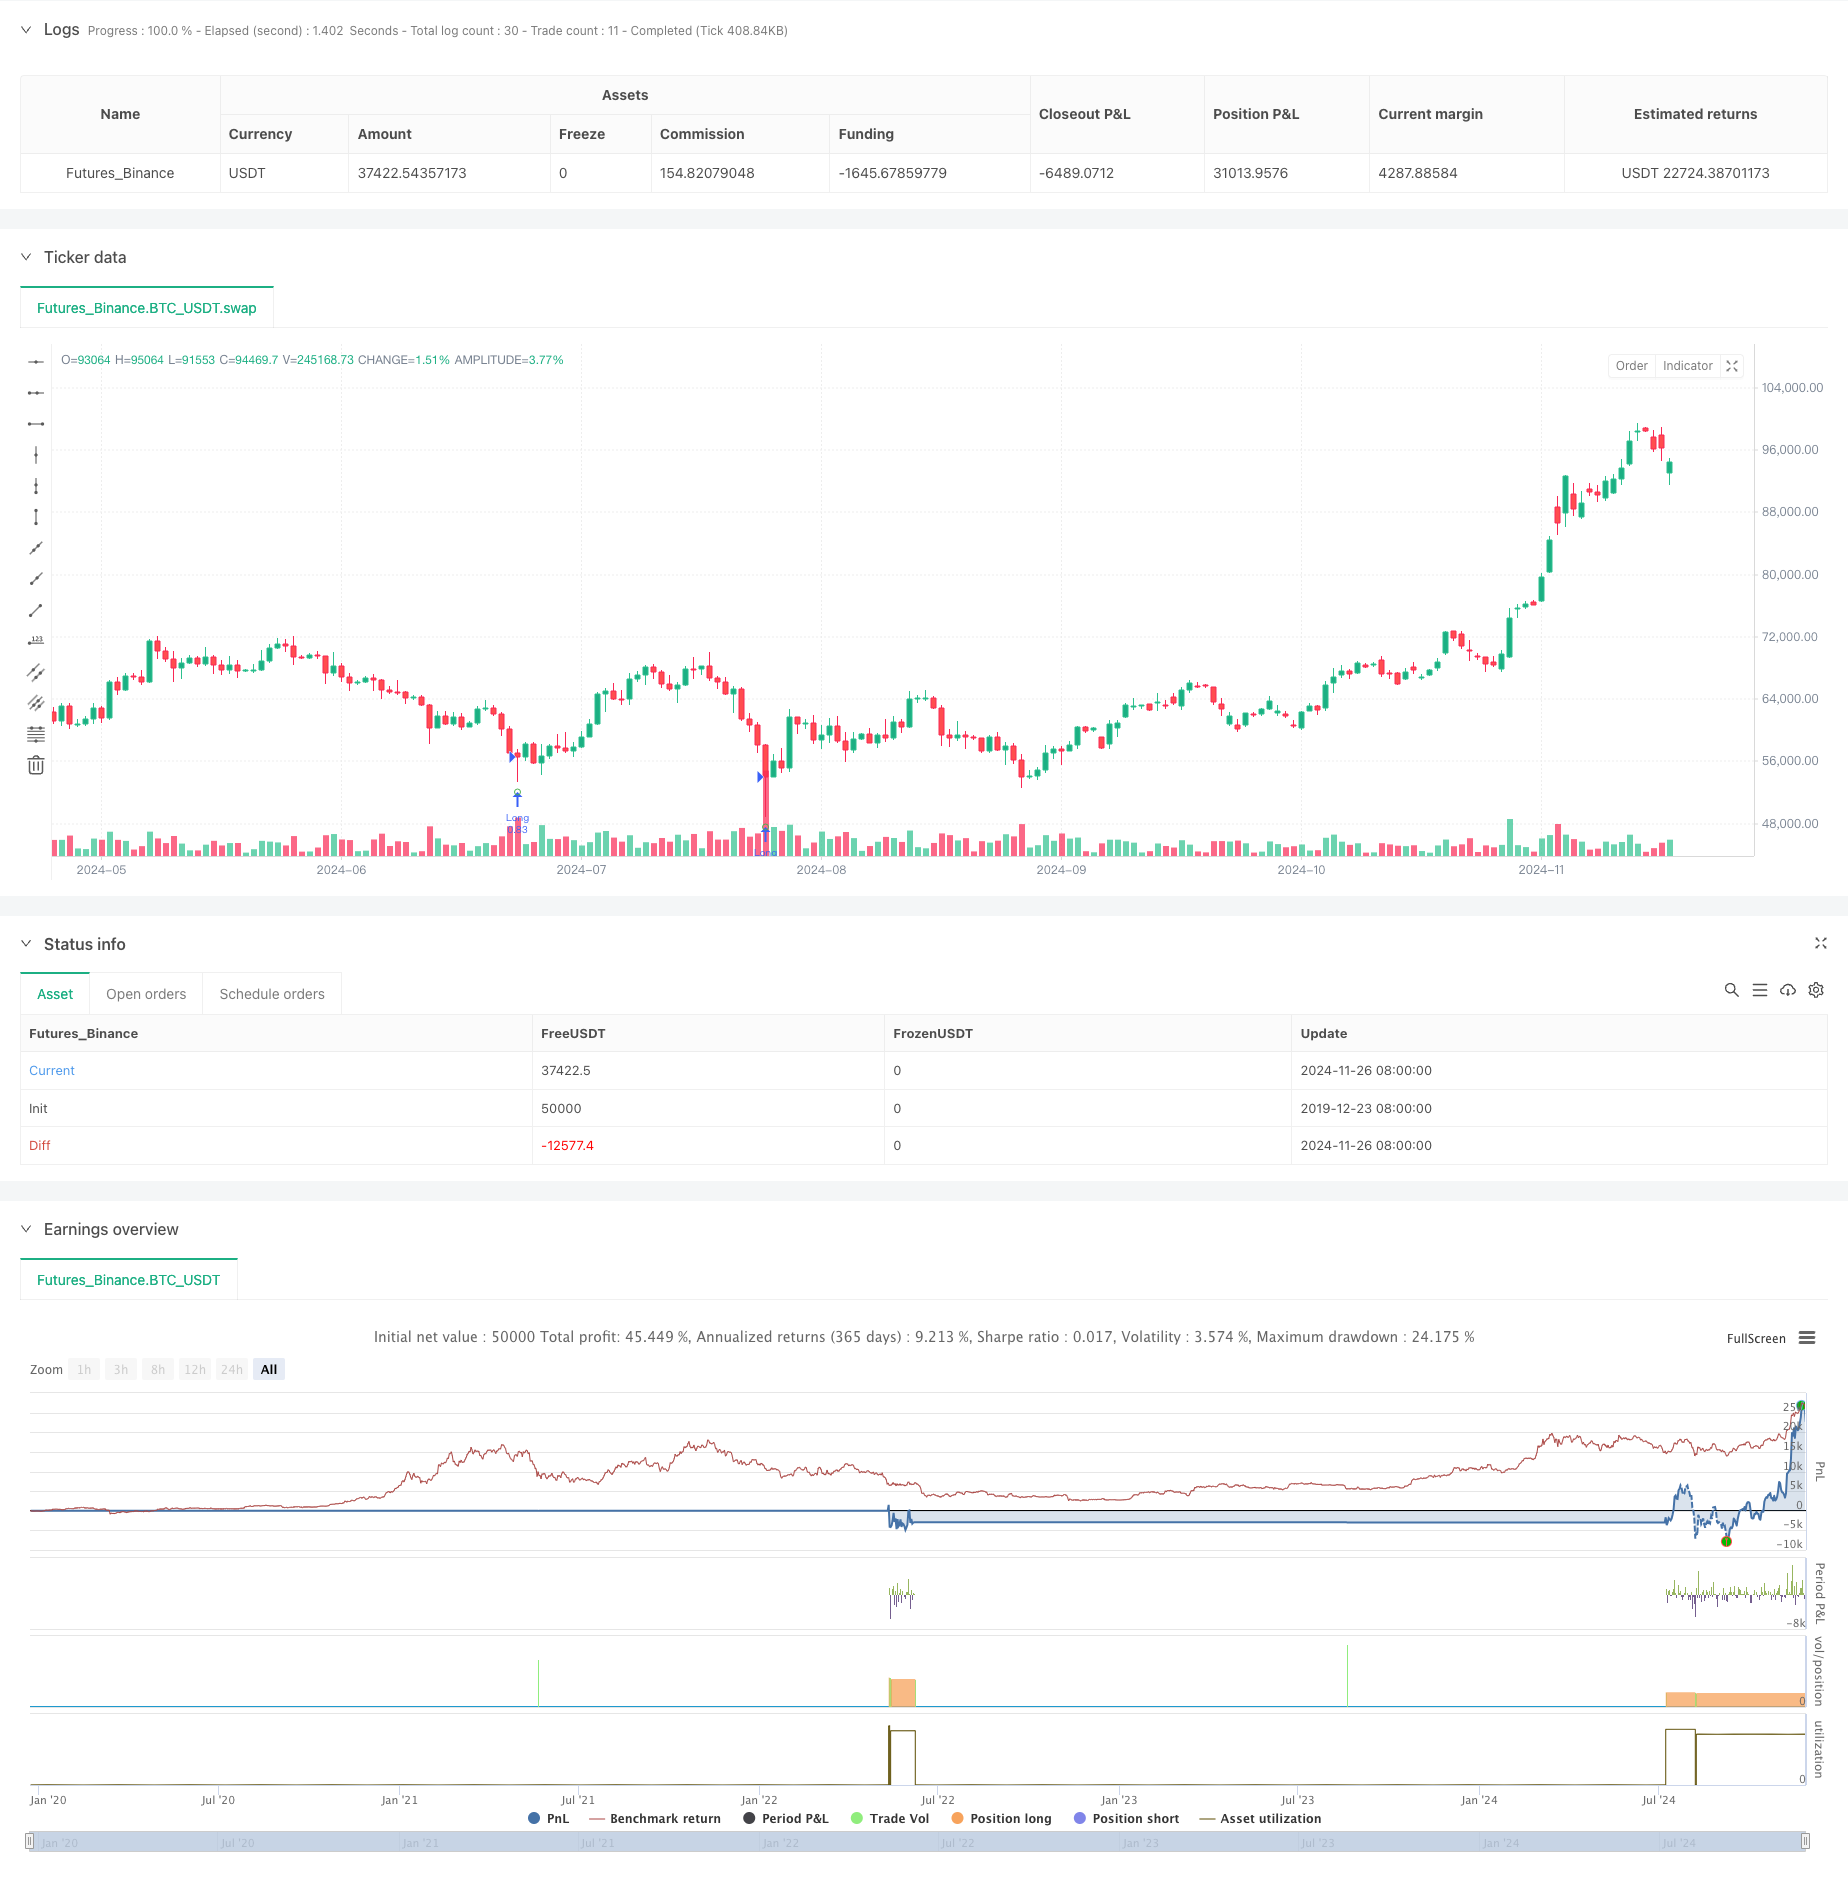
[trans]
概述
这个策略是一个基于RSI超卖信号、长短期均线趋势和成交量确认的趋势跟踪策略。它主要通过识别长期上升趋势中的短期超卖机会来建立多头仓位,同时利用成交量放大来确认交易信号的有效性。策略采用了10周期RSI指标、250和500周期的双均线系统,以及20周期成交量均线作为核心指标组合。
策略原理
策略的核心逻辑基于三个关键条件的协同:
- RSI超卖信号(RSI<=30):用于捕捉市场超卖反弹机会
- 双均线多头排列(SMA250>SMA500):确认长期上升趋势
- 成交量确认(当前成交量>20周期成交量均线*2.5):验证价格变动的有效性
当以上三个条件同时满足时,策略进入多头仓位。平仓信号则由短期均线下穿长期均线(死叉)触发。同时,策略设置了5%的止损来控制风险。
策略优势
- 多重确认机制降低虚假信号:结合RSI、均线和成交量三重过滤,显著提高了交易信号的可靠性
- 趋势跟随特性:通过长期均线判断大趋势,避免逆势交易
- 风险控制完善:设置固定止损位,有效控制单笔交易风险
- 适应性强:策略参数可根据不同市场特征灵活调整
- 交易机会筛选严格:多重条件过滤确保只在最佳时机入场
策略风险
- 滞后性风险:长周期均线存在显著滞后,可能错过早期趋势
- 过度过滤风险:严格的多重条件可能错过部分有效交易机会
- 震荡市场风险:在横盘震荡市场中可能频繁触发虚假信号
- 止损设置风险:固定比例止损可能不适合所有市场环境
- 参数优化风险:过度优化可能导致策略在实盘中表现不佳
策略优化方向
- 动态止损优化:可考虑基于ATR或波动率的动态止损机制
- 趋势强度量化:引入ADX等趋势强度指标,提高趋势判断准确性
- 仓位管理优化:根据信号强度和市场波动率动态调整持仓比例
- 出场机制完善:增加利润目标和移动止损等灵活出场机制
- 时间过滤:添加交易时间过滤,避开低效交易时段
总结
这是一个设计合理、逻辑严谨的趋势跟踪策略,通过多重技术指标的配合使用,有效平衡了收益和风险。策略的核心优势在于其完善的信号确认机制和风险控制体系,但同时也面临着过度过滤和滞后性等挑战。通过建议的优化方向,策略有望在实际应用中取得更好的表现。 ||
Overview
This strategy is a trend-following system that combines RSI oversold signals, long-term moving averages, and volume confirmation. It aims to capture long positions during oversold conditions within established uptrends, validated by volume expansion. The strategy utilizes a 10-period RSI, dual SMAs of 250 and 500 periods, and a 20-period volume moving average as core indicators.
Strategy Principles
The core logic is based on three key conditions working in harmony:
- RSI oversold signal (RSI<=30): Captures market rebound opportunities
- Dual MA bullish alignment (SMA250>SMA500): Confirms long-term uptrend
- Volume confirmation (Current volume>20-period volume MA*2.5): Validates price movements
A long position is initiated when all three conditions are met simultaneously. The exit signal is triggered by a death cross (shorter MA crossing below longer MA). Additionally, a 5% stop-loss is implemented for risk management.
Strategy Advantages
- Multiple confirmation reduces false signals: Integration of RSI, MAs, and volume provides robust signal filtering
- Trend-following characteristics: Long-term MAs prevent counter-trend trading
- Comprehensive risk control: Fixed stop-loss effectively manages per-trade risk
- High adaptability: Parameters can be adjusted for different market conditions
- Strict trade selection: Multiple conditions ensure optimal entry timing
Strategy Risks
- Lag risk: Long-period MAs introduce significant delay in trend identification
- Over-filtering risk: Strict multiple conditions might miss valid trading opportunities
- Ranging market risk: False signals may occur frequently in sideways markets
- Stop-loss configuration risk: Fixed percentage stops may not suit all market conditions
- Parameter optimization risk: Over-optimization may lead to poor live trading performance
Optimization Directions
- Dynamic stop-loss: Consider implementing ATR or volatility-based dynamic stops
- Trend strength quantification: Incorporate ADX or similar indicators for better trend assessment
- Position sizing optimization: Adjust position size based on signal strength and market volatility
- Exit mechanism enhancement: Add profit targets and trailing stops for flexible exits
- Time filtering: Implement trading time filters to avoid inefficient periods
Summary
This is a well-designed trend-following strategy with rigorous logic, effectively balancing returns and risks through multiple technical indicators. Its core strengths lie in comprehensive signal confirmation and risk management systems, though it faces challenges in over-filtering and latency. Through the suggested optimization directions, the strategy shows potential for improved performance in practical applications.[/trans]
Source (PineScript)
/*backtest
start: 2019-12-23 08:00:00
end: 2024-11-27 00:00:00
period: 1d
basePeriod: 1d
exchanges: [{"eid":"Futures_Binance","currency":"BTC_USDT"}]
*/


// This work is licensed under a Attribution-NonCommercial-ShareAlike 4.0 International (CC BY-NC-SA 4.0) https://creativecommons.org/licenses/by-nc-sa/4.0/
// © wielkieef

//@version=5
strategy(title=' Rsi Long-Term Strategy [15min]', overlay=true, pyramiding=1, initial_capital=10000, default_qty_type=strategy.percent_of_equity, default_qty_value=100, calc_on_order_fills=false, slippage=0, commission_type=strategy.commission.percent, commission_value=0.03)

// Rsi
rsi_lenght = input.int(10, title='RSI lenght', minval=0)
rsi_up = ta.rma(math.max(ta.change(close), 0), rsi_lenght)
rsi_down = ta.rma(-math.min(ta.change(close), 0), rsi_lenght)
rsi_value = rsi_down == 0 ? 100 : rsi_up == 0 ? 0 : 100 - 100 / (1 + rsi_up / rsi_down)
rsi_overs = rsi_value <= 30
rsi_overb = rsi_value >= 70

// Volume
vol_sma_length = input.int(20, title='Volume lenght  ', minval=1)
Volume_condt = volume > ta.sma(volume, vol_sma_length) * 2.5

//SMA1
lengthSMA1 = input(250, title="Lenght SMA 1")
SMA1 = ta.sma(close, lengthSMA1)
//plot(SMA1, color=color.rgb(245, 108, 3), linewidth=1, title="SMA250")

//SMA2
lengthSMA2 = input(500, title="Lenght SMA 2")
SMA2 = ta.sma(close, lengthSMA2)
//plot(SMA2, color=#9803f5, linewidth=1, title="SMA500")


//Entry Logic
Long_cond = (rsi_overs and SMA1 > SMA2 and Volume_condt )

if Long_cond
    strategy.entry('Long', strategy.long)

//Close Logic
Long_close = ta.crossunder(SMA1,SMA2)

if Long_close
    strategy.close("Long")

//Bar colors
Bar_color = Volume_condt ? #fc9802 : SMA1 > SMA2 ? color.rgb(84, 252, 0) : SMA1 < SMA2 ? color.maroon : color.gray
barcolor(color=Bar_color)

// Rsi value Plotshapes
plotshape(rsi_value < 30 and SMA1 > SMA2 and Volume_condt, title='Buy', color=color.new(color.green, 0), style=shape.circle, location=location.belowbar, size=size.tiny, textcolor=color.new(color.black, 0))
plotshape(rsi_value > 70 and SMA1 < SMA2 and Volume_condt, title='Sell', color=color.new(color.red, 0), style=shape.circle, location=location.abovebar, size=size.tiny, textcolor=color.new(color.black, 0))
plotshape(ta.crossunder(SMA1,SMA2) , title='DEATH CROSS', color=#000000, style=shape.xcross, location=location.abovebar, size=size.small, textcolor=color.new(color.black, 0))

//Stop-Loss// this code is from author RafaelZioni, modified by wielkieef
pera(pcnt) =>
    strategy.position_size != 0 ? math.round(pcnt / 100 * strategy.position_avg_price / syminfo.mintick) : float(na)
stoploss = input.float(title=' stop loss', defval=5.0, minval=0.5)
los = pera(stoploss)
strategy.exit('SL', loss=los)


// by wielkieef
Detail
https://www.fmz.com/strategy/473261
Last Modified
2024-11-28 17:02:32