
15 KiB
Name
RSI超卖定期投资策略与冷却期优化RSI-Oversold-Periodic-Investment-Strategy-with-Cooldown-Optimization
Author
ChaoZhang
Strategy Description
[trans]
概述
RSI超卖定期投资策略与冷却期优化是一种基于相对强弱指数(RSI)的量化交易策略。该策略主要利用RSI指标识别市场的超卖状态,并在满足特定条件时执行买入操作。策略的核心特点包括使用RSI超卖信号、固定投资金额、设定冷却期以及回溯测试功能。这种方法旨在捕捉市场低点,同时通过冷却期机制避免过度交易,为投资者提供一种系统化的入场策略。
策略原理
-
RSI指标计算:策略使用14周期的RSI指标作为主要的技术分析工具。RSI是一种动量指标,用于衡量价格变动的速度和变化。
-
超卖判断:当RSI值低于预设的阈值(默认为30)时,市场被认为处于超卖状态。这通常意味着资产可能被低估,存在反弹的潜力。
-
买入条件:策略在以下两个条件同时满足时触发买入信号:
- RSI处于超卖状态(低于设定阈值)
- 距离上次买入已经过去了至少30天(可自定义的冷却期)
-
固定投资金额:每次交易使用预设的固定美元金额(默认为1000美元)进行投资。这种方法类似于定投策略,有助于分散风险。
-
冷却期机制:每次买入后,策略强制执行30天的冷却期。在此期间,即使出现新的超卖信号,策略也不会执行买入操作。这有助于避免在短期内过度交易。
-
回溯测试:策略允许用户设定回溯测试的起始日期,默认为1000天前。这为评估策略在不同市场环境下的表现提供了灵活性。
-
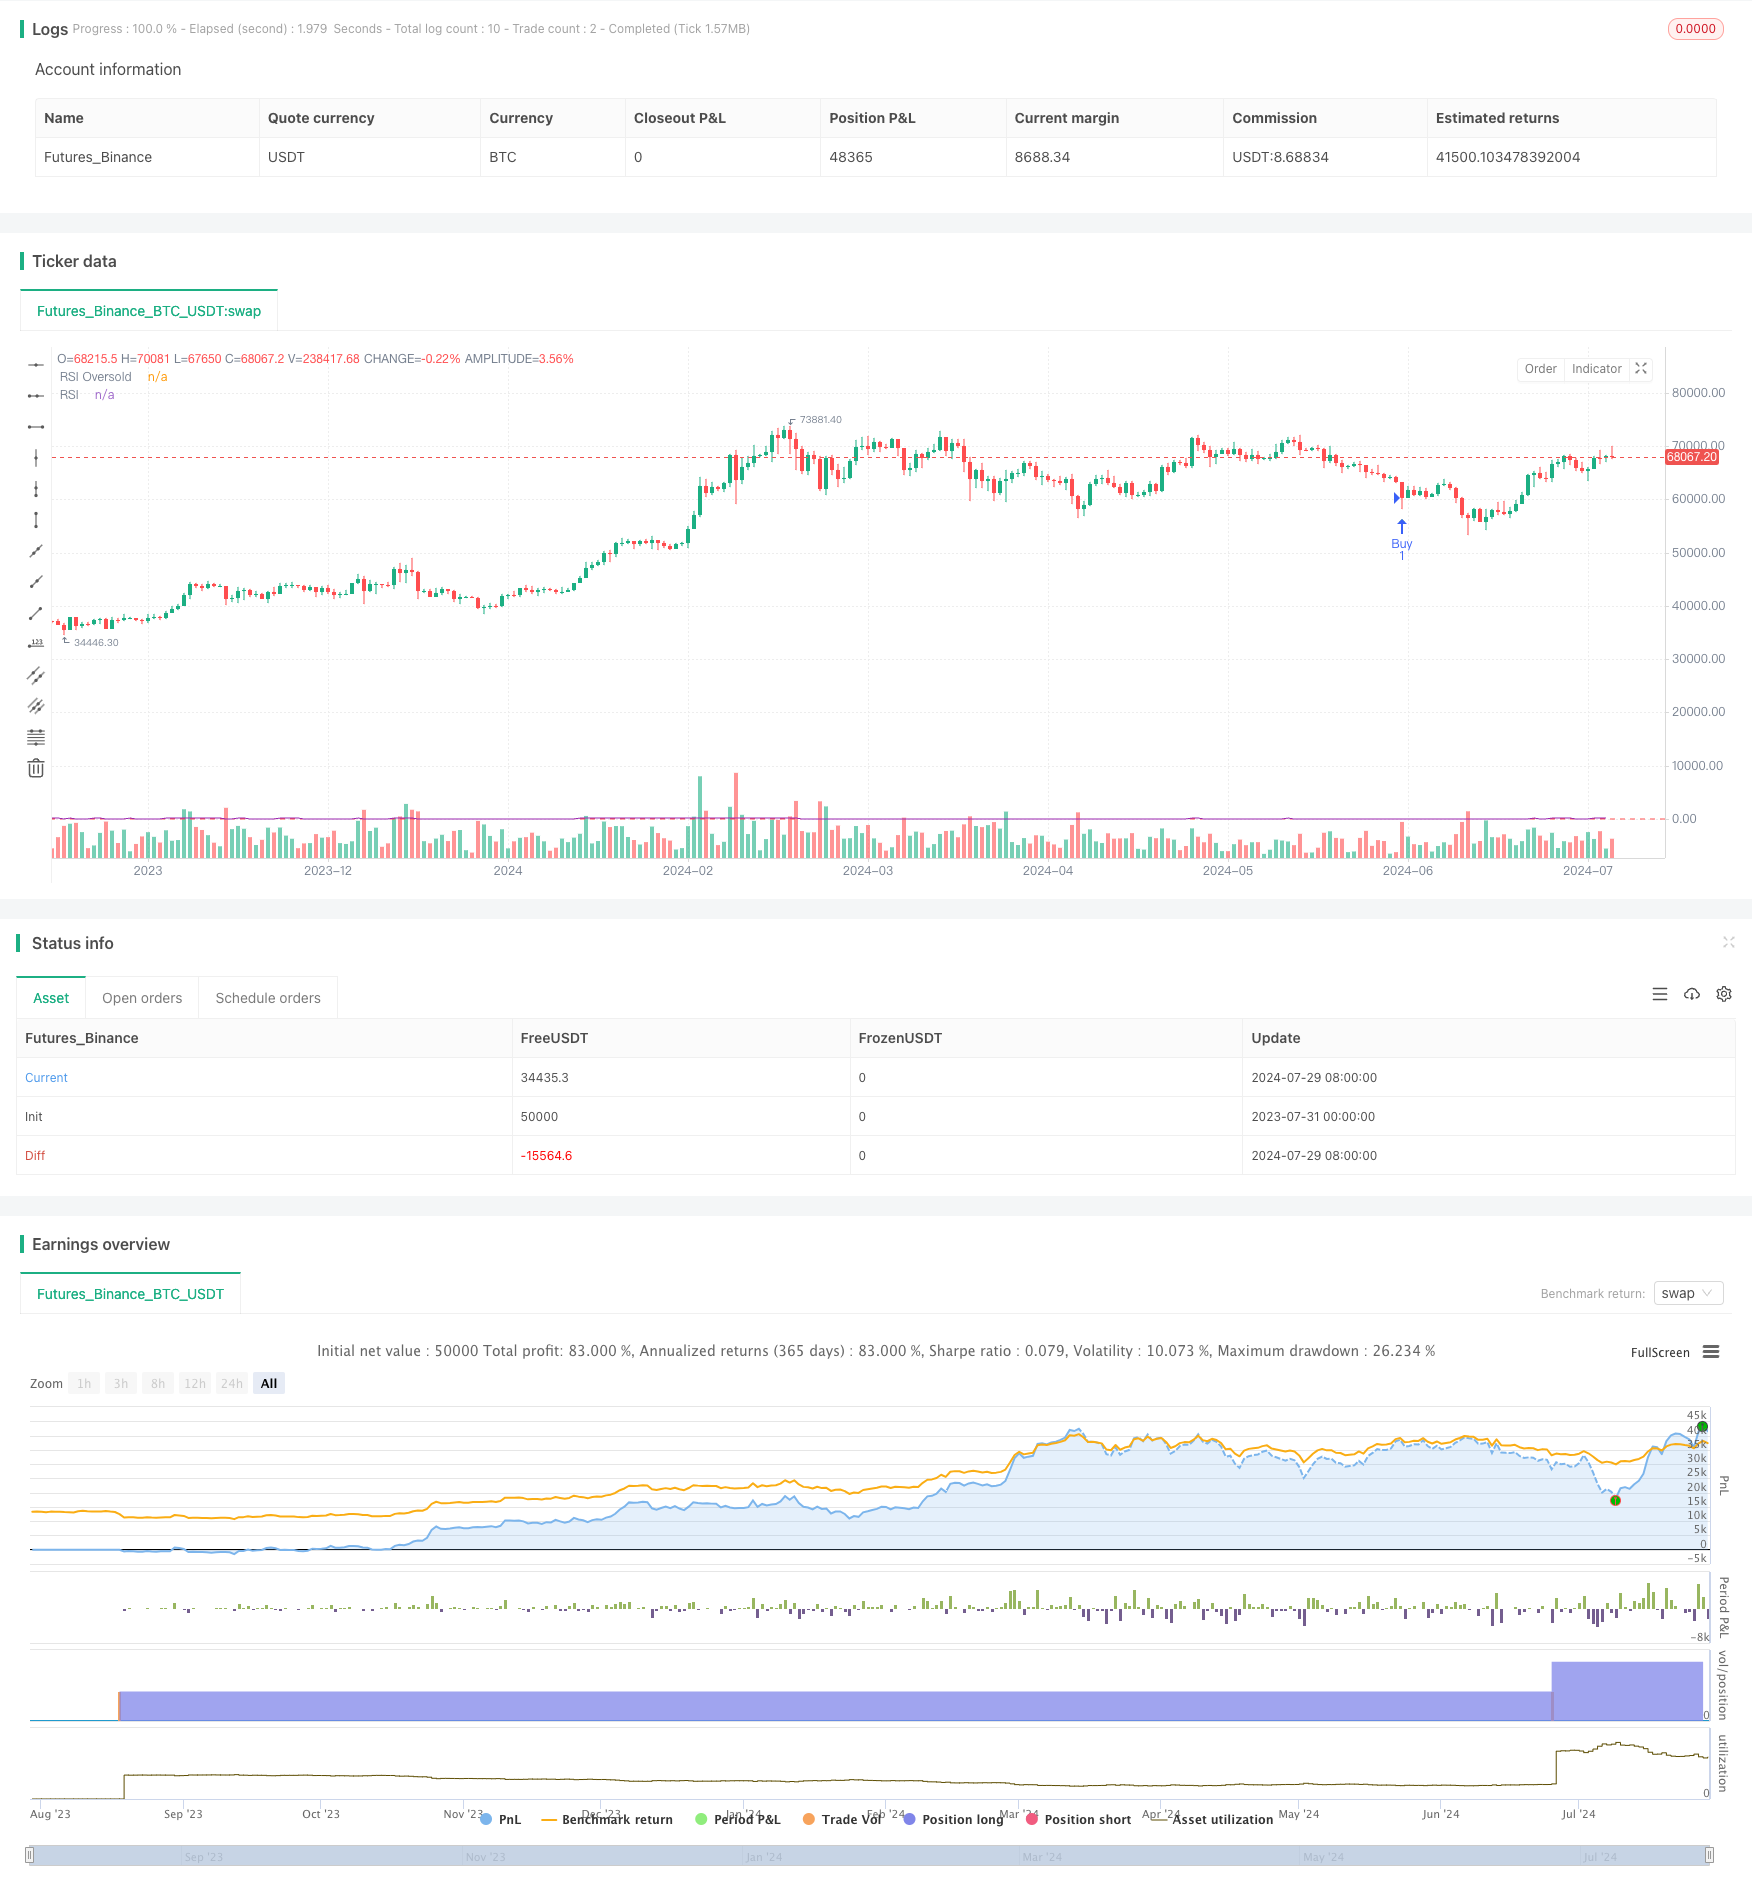
可视化展示:策略在图表上标记买入点,显示RSI曲线及超卖阈值线,并在图表最后展示策略执行的总结信息,包括总投资金额、获得的资产总量、平均买入成本和总交易次数。
策略优势
-
系统化决策:通过明确的规则和指标,策略消除了主观判断,提供了一种客观、可重复的交易方法。
-
捕捉市场低点:利用RSI超卖信号,策略旨在在资产价格被低估时入场,增加获利潜力。
-
风险管理:固定投资金额和冷却期机制有助于控制风险,防止过度交易和资金集中。
-
适应市场周期:30天的冷却期有助于策略适应较长期的市场周期,避免在短期波动中频繁交易。
-
简单易懂:策略逻辑直观,易于理解和实施,适合不同经验水平的投资者。
-
灵活性:多个可自定义参数允许投资者根据个人偏好和市场条件调整策略。
-
可视化反馈:通过图表标记和总结信息,投资者可以直观地评估策略表现。
策略风险
-
市场趋势忽视:策略主要基于RSI指标,可能忽视整体市场趋势,在强劲下跌趋势中可能导致频繁买入。
-
错过机会:30天的冷却期可能导致错过一些潜在的好机会,特别是在快速变化的市场中。
-
单一指标依赖:过度依赖RSI可能使策略在某些市场条件下表现不佳,忽视其他重要的市场信号。
-
缺乏卖出机制:策略仅聚焦于买入,缺乏明确的卖出或止损机制,可能导致亏损持续扩大。
-
固定投资金额限制:使用固定金额可能无法充分利用大额资金或适应不同规模的投资组合。
-
回测偏差:策略的回测结果可能受到生存偏差和过度拟合的影响,实际表现可能与回测结果有所差异。
-
交易成本忽视:策略没有考虑交易费用和滑点,这可能在频繁交易时显著影响实际收益。
策略优化方向
-
引入趋势过滤器:结合移动平均线或MACD等趋势指标,以避免在强势下跌趋势中频繁买入。
-
动态冷却期:根据市场波动性调整冷却期长度,在高波动期缩短冷却期,低波动期延长冷却期。
-
多指标综合:结合其他技术指标如布林带、成交量等,构建更全面的入场信号。
-
加入卖出策略:设计与买入策略匹配的卖出机制,如基于RSI超买信号或设置止盈止损。
-
资金管理优化:引入动态仓位管理,根据市场条件和账户规模调整每次投资金额。
-
参数优化:使用机器学习技术动态调整RSI周期和超卖阈值,以适应不同的市场环境。
-
加入基本面因素:考虑将宏观经济指标或情绪指标纳入决策过程,提高策略的全面性。
-
风险控制增强:引入最大回撤限制和总体风险敞口控制,提高策略的稳健性。
-
回测框架改进:考虑交易成本、滑点,并进行跨市场、跨周期的全面回测,提高策略可靠性。
总结
RSI超卖定期投资策略与冷却期优化为投资者提供了一种系统化、可量化的交易方法。通过结合RSI超卖信号、固定投资金额和冷却期机制,该策略旨在捕捉市场低点并控制风险。其简单直观的逻辑使其易于理解和实施,而可自定义的参数则提供了灵活性。
然而,该策略也存在一些限制和风险,如可能忽视整体市场趋势、过度依赖单一指标以及缺乏卖出机制等。为了增强策略的稳健性和适应性,建议考虑引入趋势过滤、多指标综合、动态参数调整等优化方向。
总的来说,这个策略为投资者提供了一个良好的起点,但在实际应用中,投资者应当根据个人风险偏好和市场条件进行适当的调整和优化。通过持续的监控和改进,结合更全面的风险管理措施,该策略有潜力成为一个有效的长期投资工具。
||
Overview
The RSI Oversold Periodic Investment Strategy with Cooldown Optimization is a quantitative trading strategy based on the Relative Strength Index (RSI). This strategy primarily uses the RSI indicator to identify oversold market conditions and executes buy orders when specific criteria are met. The core features of the strategy include using RSI oversold signals, fixed investment amounts, setting a cooldown period, and backtesting functionality. This approach aims to capture market lows while avoiding overtrading through a cooldown mechanism, providing investors with a systematic entry strategy.
Strategy Principles
-
RSI Calculation: The strategy uses a 14-period RSI as the main technical analysis tool. RSI is a momentum indicator used to measure the speed and change of price movements.
-
Oversold Determination: When the RSI value falls below a preset threshold (default 30), the market is considered oversold. This usually indicates that the asset may be undervalued and has potential for a rebound.
-
Buy Conditions: The strategy triggers a buy signal when two conditions are simultaneously met:
- RSI is in an oversold state (below the set threshold)
- At least 30 days (customizable cooldown period) have passed since the last purchase
-
Fixed Investment Amount: Each trade uses a preset fixed dollar amount (default $1,000) for investment. This method is similar to a dollar-cost averaging strategy, helping to diversify risk.
-
Cooldown Mechanism: After each purchase, the strategy enforces a 30-day cooldown period. During this time, no buy orders will be executed even if new oversold signals appear. This helps prevent excessive trading in the short term.
-
Backtesting: The strategy allows users to set a start date for backtesting, defaulting to 1000 days ago. This provides flexibility in evaluating the strategy's performance under different market conditions.
-
Visual Display: The strategy marks buy points on the chart, displays the RSI curve and oversold threshold line, and shows a summary of strategy execution at the end of the chart, including total investment amount, total assets acquired, average purchase cost, and total number of trades.
Strategy Advantages
-
Systematic Decision-Making: Through clear rules and indicators, the strategy eliminates subjective judgment, providing an objective and repeatable trading method.
-
Capturing Market Lows: By utilizing RSI oversold signals, the strategy aims to enter when asset prices are undervalued, increasing profit potential.
-
Risk Management: Fixed investment amounts and cooldown mechanisms help control risk, preventing overtrading and capital concentration.
-
Adapting to Market Cycles: The 30-day cooldown period helps the strategy adapt to longer market cycles, avoiding frequent trading during short-term fluctuations.
-
Simplicity: The strategy logic is intuitive, easy to understand and implement, suitable for investors of different experience levels.
-
Flexibility: Multiple customizable parameters allow investors to adjust the strategy according to personal preferences and market conditions.
-
Visual Feedback: Through chart markings and summary information, investors can visually assess strategy performance.
Strategy Risks
-
Market Trend Neglect: The strategy primarily based on the RSI indicator may ignore overall market trends, potentially leading to frequent buying in strong downward trends.
-
Missed Opportunities: The 30-day cooldown period may cause missing some potential good opportunities, especially in rapidly changing markets.
-
Single Indicator Dependence: Over-reliance on RSI may cause the strategy to perform poorly under certain market conditions, ignoring other important market signals.
-
Lack of Selling Mechanism: The strategy focuses only on buying, lacking clear selling or stop-loss mechanisms, which may lead to continued expansion of losses.
-
Fixed Investment Amount Limitation: Using a fixed amount may not fully utilize large funds or adapt to different portfolio sizes.
-
Backtest Bias: The strategy's backtest results may be affected by survivorship bias and overfitting, actual performance may differ from backtest results.
-
Trading Cost Neglect: The strategy does not consider transaction fees and slippage, which may significantly affect actual returns during frequent trading.
Strategy Optimization Directions
-
Introduce Trend Filters: Combine moving averages or MACD and other trend indicators to avoid frequent buying in strong downward trends.
-
Dynamic Cooldown Period: Adjust the length of the cooldown period based on market volatility, shortening it in high volatility periods and extending it in low volatility periods.
-
Multi-Indicator Integration: Combine other technical indicators such as Bollinger Bands, volume, etc., to build more comprehensive entry signals.
-
Add Selling Strategy: Design a selling mechanism that matches the buying strategy, such as based on RSI overbought signals or setting take-profit and stop-loss levels.
-
Capital Management Optimization: Introduce dynamic position management, adjusting investment amounts based on market conditions and account size.
-
Parameter Optimization: Use machine learning techniques to dynamically adjust RSI periods and oversold thresholds to adapt to different market environments.
-
Incorporate Fundamental Factors: Consider incorporating macroeconomic indicators or sentiment indicators into the decision-making process to enhance strategy comprehensiveness.
-
Risk Control Enhancement: Introduce maximum drawdown limits and overall risk exposure control to improve strategy robustness.
-
Backtest Framework Improvement: Consider trading costs, slippage, and conduct comprehensive backtests across markets and time periods to increase strategy reliability.
Conclusion
The RSI Oversold Periodic Investment Strategy with Cooldown Optimization provides investors with a systematic, quantifiable trading method. By combining RSI oversold signals, fixed investment amounts, and a cooldown mechanism, the strategy aims to capture market lows while controlling risk. Its simple and intuitive logic makes it easy to understand and implement, while customizable parameters provide flexibility.
However, the strategy also has some limitations and risks, such as potentially ignoring overall market trends, over-reliance on a single indicator, and lack of a selling mechanism. To enhance the strategy's robustness and adaptability, it is recommended to consider introducing trend filters, multi-indicator integration, dynamic parameter adjustment, and other optimization directions.
Overall, this strategy provides investors with a good starting point, but in practical application, investors should make appropriate adjustments and optimizations based on personal risk preferences and market conditions. Through continuous monitoring and improvement, combined with more comprehensive risk management measures, this strategy has the potential to become an effective long-term investment tool.
[/trans]
Source (PineScript)
/*backtest
start: 2023-07-31 00:00:00
end: 2024-07-30 00:00:00
period: 1d
basePeriod: 1h
exchanges: [{"eid":"Futures_Binance","currency":"BTC_USDT"}]
*/

//@version=5
strategy("RSI Buy Strategy with 30-day Cooldown", overlay=true)

// 参数设置
rsiLength = 14
rsiOversold = 30
usdAmount = 1000
cooldownPeriod = 30 * 24 * 60

// 计算RSI
rsi = ta.rsi(close, rsiLength)

// 跟踪上次买入时间
var int lastBuyTime = 0
var bool buySignal = false

daysBack = input.int(1000, title="策略开始天数(从今天往回)", minval=1)
startDate = timenow - daysBack * 24 * 60 * 60 * 1000
isInTradingPeriod = true

// 执行策略
if (isInTradingPeriod and rsi < rsiOversold and (time - lastBuyTime) >= cooldownPeriod * 60000)
    strategy.entry("Buy", strategy.long)
    lastBuyTime := time
    buySignal := true

    // 在交易列表中显示详细信息
    strategy.order("Buy", strategy.long, comment="USD: " + str.tostring(usdAmount))
else
    buySignal := false

// 在买入点显示一个小标记
plotshape(buySignal, title="Buy Signal", location=location.belowbar, color=color.green, style=shape.triangleup, size=size.small)

// 在图表上显示RSI
plot(rsi, "RSI", color=color.purple)
hline(rsiOversold, "RSI Oversold", color=color.red)

// 计算并显示总结
if (barstate.islastconfirmedhistory)
    tradeCount = strategy.opentrades
    totalUsd = usdAmount * tradeCount
    totalBtc = strategy.position_size

    // 计算正确的平均买入成本
    avgCost = totalBtc != 0 ? totalUsd / totalBtc : na

    label.new(bar_index, high, text="\nUSD总量: " + str.tostring(totalUsd) +
              "\nBTC总量: " + str.tostring(totalBtc) +
              "\n买入成本: " + str.tostring(avgCost,"#.##") +
              "\n交易次数: " + str.tostring(tradeCount),
              style=label.style_label_down,
              color=color.new(color.teal, 20),
              textalign="left")
Detail
https://www.fmz.com/strategy/458243
Last Modified
2024-07-31 11:31:45