
8.5 KiB
Name
RSI多空平衡交易策略RSI-Long-Short-Balance-Trading-Strategy
Author
ChaoZhang
Strategy Description
 [trans]
概述
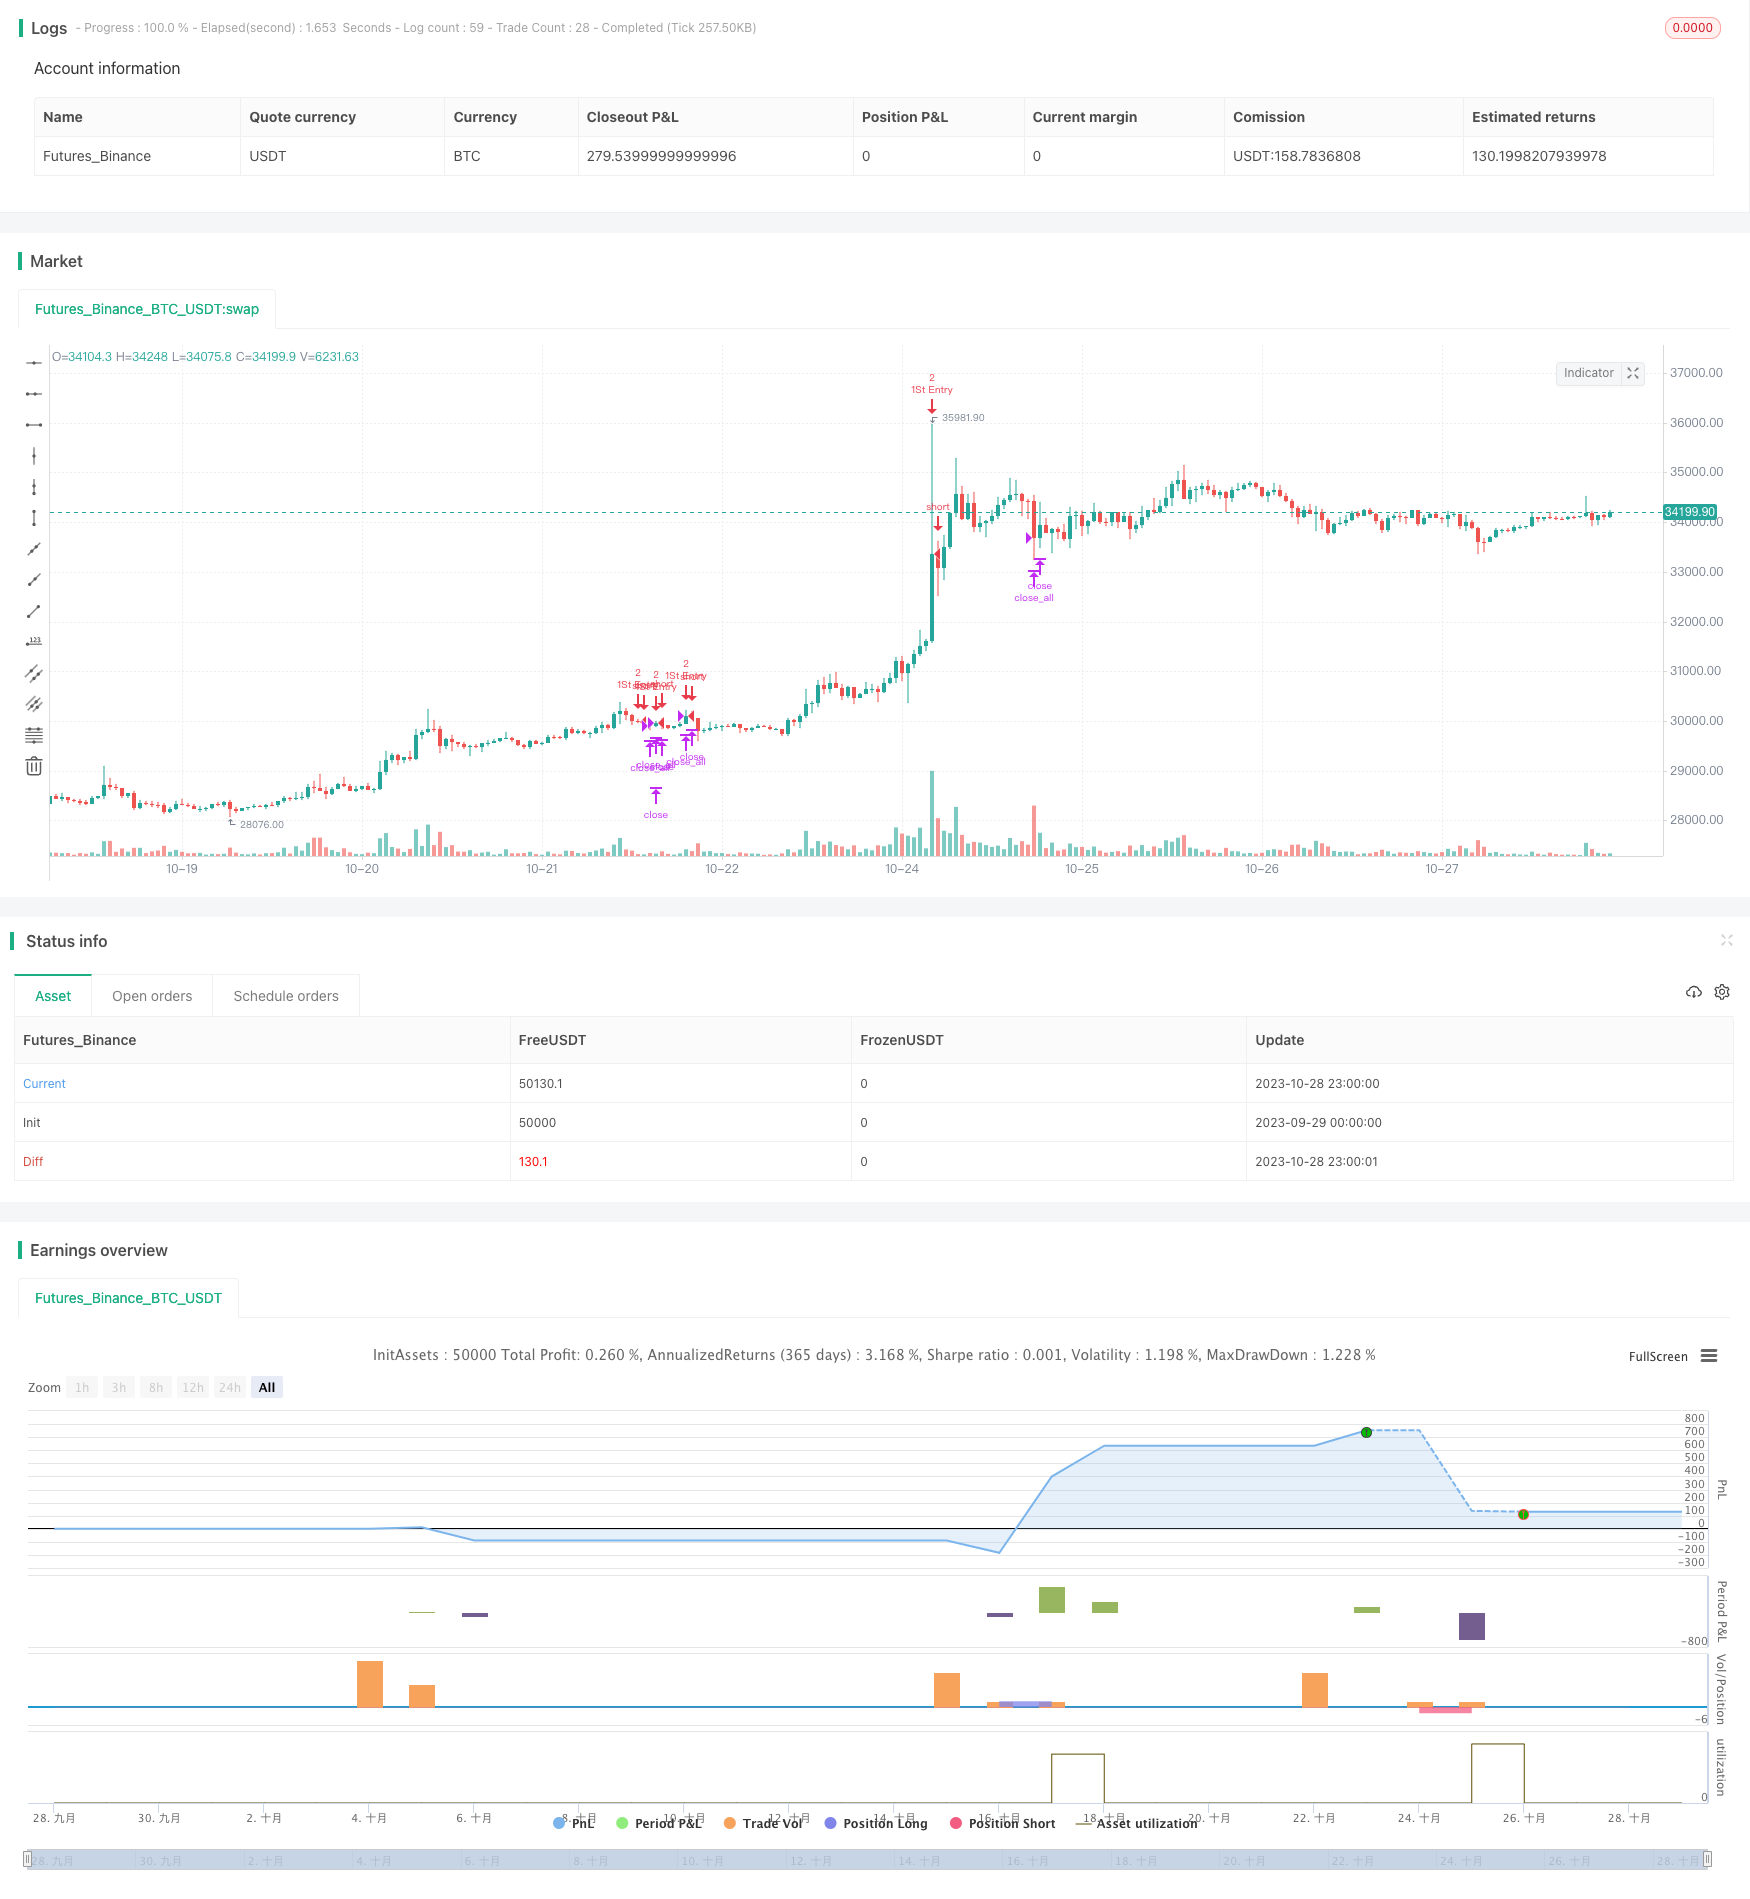
该策略利用RSI指标在不同时间周期上的组合,判断当前市场处于超买或超卖状态,并结合价格与移动均线的关系来发出买入和卖出信号。目标是在跌势中买入,在涨势中卖出,达到在盘整中获利。
策略原理
-
计算5分钟、15分钟、1小时的RSI值,当5分钟、15分钟和1小时的RSI同时低于25时,判断为超卖现象,产生买入信号;当5分钟、15分钟和1小时的RSI同时高于75时,判断为超买现象,产生卖出信号。
-
价格突破21日移动均线也作为交易信号,如果价格低于移动均线,则产生买入信号;如果价格高于移动均线,则产生卖出信号。
-
根据持仓情况,设定首次交易数量和加仓规则:首次开仓定为2手,之后每次加仓1手,直到持仓达到2手为止。
-
当亏损达到3%时止损。当获利达到1%时止盈。
策略优势
-
使用多时间框架RSI指标组合判断超买超卖,提高信号的可靠性。
-
结合移动均线产生额外交易信号,扩大交易机会。
-
设定头寸控制和盈亏比例止盈止损规则,控制风险。
-
采用定量加仓方式扩大获利空间。
策略风险
-
RSI指标存在回调风险,即RSI达到超买超卖临界点后,价格可能继续运行一段时间而未发生反转。此时如果盲目跟随RSI信号交易,可能导致亏损。
-
移动均线产生的交易信号可能出现误导。当价格出现剧烈波动时,移动均线无法及时跟踪价格变化。
-
错误设定头寸规模和盈亏比可能导致风险控制不当。
-
需要合理设定加仓条件。如果加仓过于放开,可能导致亏损扩大。
优化方向
-
调整RSI参数,测试不同的RSI周期参数组合,找到更可靠的超买超卖信号。
-
测试不同的参数移动均线作为辅助交易信号。也可以测试其他技术指标。
-
优化头寸控制和止损止盈规则,设定更科学的风险控制机制。
-
优化加仓条件,防止加仓导致亏损放大。也可以考虑替代加仓方式,改为指数加仓。
总结
本策略利用RSI的多时间框架组合判断趋势潜力,以获取较高的胜率。同时辅以移动均线产生交易信号,扩大交易机会。采用头寸控制、止损止盈、定量加仓等规则进行风险控制。总体来说,该策略整合了趋势、反转指标,兼顾追踪趋势和逢低吸纳的交易逻辑,在盘整行情中可获得不错的效果。但仍需进一步测试优化,使风险控制机制更加科学合理,从而获得更稳定的交易表现。
||
Overview
This strategy uses a combination of RSI indicators across different timeframes to determine if the current market is overbought or oversold, and combines the relationship between price and moving average to generate buy and sell signals. The goal is to buy on dips and sell on rallies to profit during consolidation.
Strategy Logic
-
Calculate the RSI values of the 5-minute, 15-minute, and 1-hour timeframes. When the 5-minute, 15-minute and 1-hour RSI are all below 25 at the same time, it is judged as an oversold condition and generates a buy signal. When the 5-minute, 15-minute and 1-hour RSI are all above 75 at the same time, it is judged as an overbought condition and generates a sell signal.
-
Breaking the 21-day moving average also acts as a trading signal. If the price is below the moving average, a buy signal is generated. If the price is above the moving average, a sell signal is generated.
-
Based on the current position, the initial trade size and pyramiding rules are set: 2 contracts for the first entry, and then adding 1 contract each time until the position reaches 2 contracts.
-
The stop loss is triggered when the loss reaches 3%. Take profit when the profit reaches 1%.
Advantages
-
Using RSI indicators across multiple timeframes to determine overbought and oversold conditions improves signal reliability.
-
Combining moving average generates additional trading signals and expands trading opportunities.
-
Setting position sizing control and profit/loss ratio for stop loss and take profit manages risks.
-
Scaling in with fixed quantity expands profit potential.
Risks
-
RSI divergence risk. Price may continue to trend for a period after RSI reaches overbought or oversold threshold before reversing. Blindly following RSI signal can lead to losses.
-
Moving average trading signal may be misleading. Moving average fails to track price change timely during huge price swings.
-
Incorrect position sizing and profit/loss ratio settings lead to improper risk control.
-
Pyramiding conditions need to be set reasonably to avoid magnifying losses.
Optimization Directions
-
Adjust RSI parameters and test different period combinations to find more reliable overbought/oversold signals.
-
Test different moving averages as auxiliary trading signals, or other technical indicators.
-
Optimize position sizing and stop loss/take profit rules to build more scientific risk control mechanisms.
-
Optimize pyramiding conditions to prevent magnifying losses. Consider exponential scaling instead of fixed quantity scaling.
Summary
This strategy uses RSI across multiple timeframes to determine trend potential and achieve higher win rate. Additional signals are generated with moving averages to expand trading opportunities. Risk is managed through position sizing, stop loss/take profit, and fixed quantity pyramiding. Overall, this strategy combines trend and mean reversion indicators, incorporates both trend following and bottom-picking logic, and is effective during consolidation. Further testing and optimization is needed to build more robust risk control for more consistent performance.
[/trans]
Source (PineScript)
/*backtest
start: 2023-09-29 00:00:00
end: 2023-10-29 00:00:00
period: 1h
basePeriod: 15m
exchanges: [{"eid":"Futures_Binance","currency":"BTC_USDT"}]
*/

//@version=3
strategy("5M_RSI_Strategy", overlay=true, pyramiding = 1)
len =14
Initial_Trade_Size = 2
up = rma(max(change(close), 0), len)
down = rma(-min(change(close), 0), len)
rsi = down == 0 ? 100 : up == 0 ? 0 : 100 - (100 / (1 + up / down))
RSI_1h = request.security(syminfo.tickerid, "60", rsi)
RSI_3h = request.security(syminfo.tickerid, "180", rsi)
RSI_15m = request.security(syminfo.tickerid, "15", rsi)
RSI_5m = request.security(syminfo.tickerid, "5", rsi)
RSI_1m = request.security(syminfo.tickerid, "1", rsi)
ema21_5 = ema(request.security(syminfo.tickerid, "5", close), 21)
ema21_15 = ema(request.security(syminfo.tickerid, "15", close), 21)
//(RSI_3h<=25) and  (RSI_1h<=25) and (RSI_15m<=25) and
Positive = ((RSI_5m<=25) and (RSI_15m<=25) and (RSI_1h<=25))?true:false
//alertcondition(Positive, title='POS', message='POS')
//plotshape(Positive, style=shape.triangleup,location=location.belowbar, color=green,size =size.tiny)
Negative = (( RSI_5m>=75) and ( RSI_15m>=75) and ( RSI_1h>=75))?true:false
//alertcondition(Negative, title='NEG', message='NEG')
//plotshape(Negative, style=shape.triangledown,location=location.abovebar, color=red,size=size.tiny)          Positive and   Negative and

lastordersize = abs(strategy.position_size)>=Initial_Trade_Size?abs(strategy.position_size):Initial_Trade_Size
//lastordersize =1
// and ((ema21_15-low)/ema21_15) > 0.077
//Adding to position rules
if (abs(strategy.position_size) >= Initial_Trade_Size and (abs(close - strategy.position_avg_price)/abs(strategy.position_avg_price)>0.03))
    if(strategy.position_avg_price > close and strategy.position_size > 0)
        strategy.entry("Add", strategy.long , qty = lastordersize , when = true)
    if(strategy.position_avg_price < close and strategy.position_size < 0)
        strategy.entry("Add", strategy.short, qty = lastordersize , when = true)
if (strategy.position_size == 0)
    if (Positive or ((ema21_5-low)/ema21_5) > 0.07)
        strategy.entry("1St Entry", strategy.long , qty = lastordersize , when = true)
    // and ((high-ema21_15)/ema21_15) > 0.077
    if (Negative or ((high-ema21_5)/ema21_5) > 0.07)
        strategy.entry("1St Entry", strategy.short, qty = lastordersize , when = true)
//lastordersize := lastordersize * 2
//or (strategy.openprofit / abs(strategy.position_size * close))>=0.01
if(cross(ema21_5, high) or cross(ema21_5, low))
    strategy.close_all()
Detail
https://www.fmz.com/strategy/430587
Last Modified
2023-10-30 15:49:35