
13 KiB
Name
RSI双周期均线反转策略与动态风险管理系统-RSI-Dual-Period-Moving-Average-Reversal-Strategy-with-Dynamic-Risk-Management-System
Author
ChaoZhang
Strategy Description
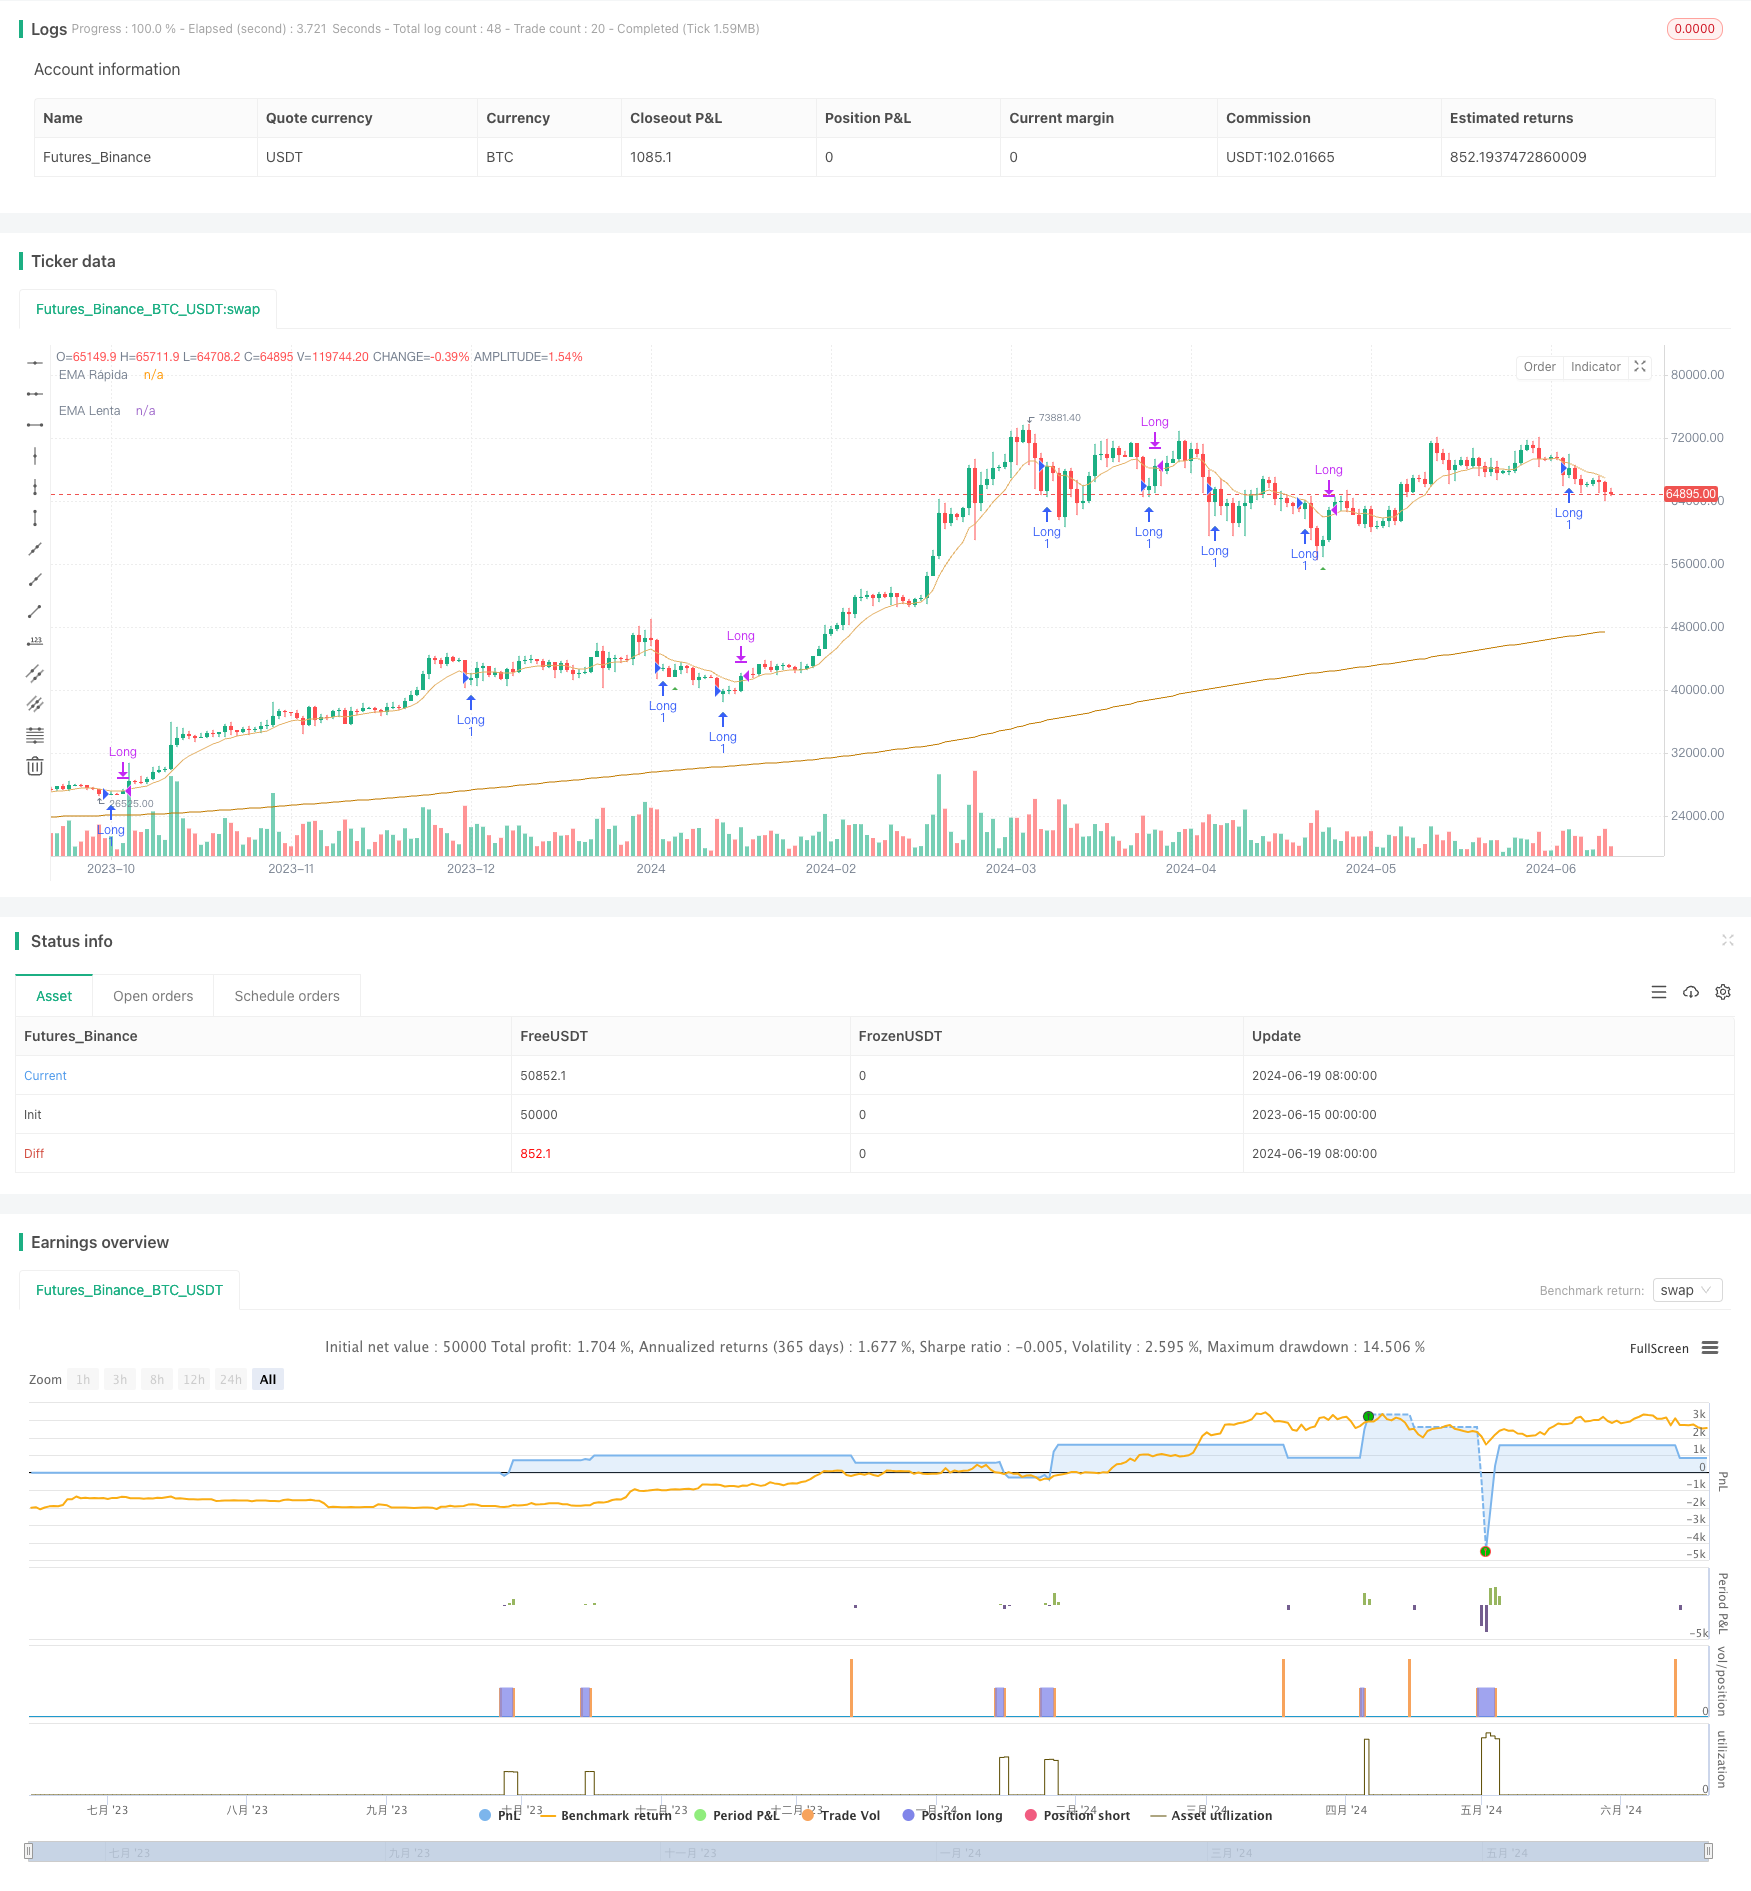 [trans]
概述
RSI双周期均线反转策略是一种结合了相对强弱指标(RSI)和指数移动平均线(EMA)的中期交易系统。该策略旨在捕捉市场的短期超买和超卖状态,同时通过双重均线过滤来确认整体趋势。策略的核心在于利用RSI的快速反应特性来识别潜在的反转点,而后通过均线的交叉来确认交易信号。此外,策略还融入了动态止损机制,以适应不同市场环境下的风险管理需求。
策略原理
- 使用2周期RSI作为主要指标,快速捕捉价格动量的变化。
- 设置两条EMA:快速EMA(短期)和慢速EMA(长期),用于确定总体趋势和潜在的交易区域。
- 多头入场条件:
- 价格位于慢速EMA之上(确认上升趋势)
- 价格位于快速EMA之下(表明短期回调)
- RSI从超卖区域向上穿越(表明动量开始转向)
- 空头入场条件:
- 价格位于慢速EMA之下(确认下降趋势)
- 价格位于快速EMA之上(表明短期反弹)
- RSI从超买区域向下穿越(表明动量开始转向)
- 出场策略:
- 当价格穿越快速EMA时平仓,实现利润或限制损失
- 设置基于入场价格的百分比止损,提供风险控制
策略优势
- 多重确认机制:通过结合RSI和双EMA,策略能够有效过滤假信号,提高交易的准确性。
- 适应性强:策略参数可根据不同市场和时间框架进行优化,展现了良好的适应性。
- 风险管理集成:内置的动态止损机制有助于控制每笔交易的风险。
- 趋势跟随与反转结合:策略既能捕捉大趋势中的回调机会,又能在趋势初期阶段及早入场。
- 清晰的交易逻辑:策略规则明确,易于理解和执行,有利于保持交易纪律。
- 可视化支持:在图表上标记入场点,有助于交易者直观理解和回顾交易决策。
策略风险
- 参数敏感性:策略效果高度依赖于RSI和EMA的参数设置,不当的参数可能导致过度交易或错过机会。
- 震荡市场风险:在横盘市场中,频繁的假突破可能导致连续止损。
- 滞后性:EMA作为滞后指标,在快速转向的市场中可能反应不及时。
- 过度依赖技术指标:忽视基本面和市场情绪可能导致在重大事件或新闻发布时遭受损失。
- 回撤风险:虽然设有止损,但在极端行情下仍可能面临较大回撤。
策略优化方向
- 动态参数调整:引入自适应算法,根据市场波动性自动调整RSI和EMA参数。
- 多时间框架分析:整合更长期的趋势判断,提高入场点的质量。
- 量化风险评估:根据市场波动率动态调整止损水平和仓位大小。
- 加入成交量指标:结合成交量分析,提高趋势判断和反转信号的可靠性。
- 机器学习优化:使用机器学习算法优化参数选择和信号生成过程。
- 情绪指标整合:引入市场情绪指标,如VIX或社交媒体情绪分析,增强市场洞察。
- 基本面过滤器:加入宏观经济指标或事件驱动的交易过滤机制。
总结
RSI双周期均线反转策略是一个融合了动量和趋势分析的综合交易系统。通过巧妙结合短期RSI的敏感性与长短期EMA的趋势确认功能,该策略能够在保持对市场反应灵敏度的同时,有效降低误差交易的风险。内置的动态风险管理机制进一步增强了策略的健壮性,使其能够适应不同的市场环境。
然而,与所有交易策略一样,这个系统也面临参数优化和市场适应性的挑战。为了提高策略的长期可持续性,建议交易者持续监控策略表现,定期进行参数优化,并考虑引入额外的分析维度,如多时间框架分析和量化风险评估。
最后,尽管该策略展现出令人鼓舞的潜力,但重要的是要认识到,没有任何交易策略是完美的。成功的交易不仅依赖于策略本身,还取决于交易者的纪律、风险管理能力和对市场的深入理解。因此,在实际应用中,应结合完善的资金管理策略,并保持对市场变化的持续学习和适应。
||
Overview
The RSI Dual-Period Moving Average Reversal Strategy is a mid-term trading system that combines the Relative Strength Index (RSI) with Exponential Moving Averages (EMA). This strategy aims to capture short-term overbought and oversold market conditions while using a dual moving average filter to confirm overall trends. The core of the strategy lies in utilizing the RSI's quick response characteristics to identify potential reversal points, followed by moving average crossovers to confirm trading signals. Additionally, the strategy incorporates a dynamic stop-loss mechanism to adapt to risk management needs in different market environments.
Strategy Principles
- Uses a 2-period RSI as the primary indicator to quickly capture changes in price momentum.
- Sets up two EMAs: a fast EMA (short-term) and a slow EMA (long-term) to determine overall trends and potential trading zones.
- Long entry conditions:
- Price above the slow EMA (confirming uptrend)
- Price below the fast EMA (indicating short-term pullback)
- RSI crossing upwards from the oversold zone (indicating momentum reversal)
- Short entry conditions:
- Price below the slow EMA (confirming downtrend)
- Price above the fast EMA (indicating short-term bounce)
- RSI crossing downwards from the overbought zone (indicating momentum reversal)
- Exit strategy:
- Close positions when price crosses the fast EMA, realizing profits or limiting losses
- Set a percentage-based stop-loss from the entry price for risk control
Strategy Advantages
- Multiple confirmation mechanism: By combining RSI and dual EMAs, the strategy effectively filters out false signals, improving trading accuracy.
- High adaptability: Strategy parameters can be optimized for different markets and timeframes, demonstrating good flexibility.
- Integrated risk management: The built-in dynamic stop-loss mechanism helps control risk for each trade.
- Combination of trend-following and reversal: The strategy can capture pullback opportunities within larger trends and enter early in trend initiation phases.
- Clear trading logic: Strategy rules are explicit, easy to understand and execute, conducive to maintaining trading discipline.
- Visual support: Entry points marked on the chart help traders intuitively understand and review trading decisions.
Strategy Risks
- Parameter sensitivity: Strategy effectiveness highly depends on RSI and EMA parameter settings; improper parameters may lead to overtrading or missed opportunities.
- Sideways market risk: In range-bound markets, frequent false breakouts may result in consecutive stop-losses.
- Lag: EMAs, being lagging indicators, may not react timely in rapidly reversing markets.
- Over-reliance on technical indicators: Ignoring fundamentals and market sentiment may lead to losses during major events or news releases.
- Drawdown risk: Despite stop-losses, significant drawdowns may still occur in extreme market conditions.
Strategy Optimization Directions
- Dynamic parameter adjustment: Introduce adaptive algorithms to automatically adjust RSI and EMA parameters based on market volatility.
- Multi-timeframe analysis: Integrate longer-term trend judgments to improve entry point quality.
- Quantitative risk assessment: Dynamically adjust stop-loss levels and position sizes based on market volatility.
- Incorporate volume indicators: Combine volume analysis to improve trend judgment and reversal signal reliability.
- Machine learning optimization: Use machine learning algorithms to optimize parameter selection and signal generation processes.
- Sentiment indicator integration: Introduce market sentiment indicators, such as VIX or social media sentiment analysis, to enhance market insights.
- Fundamental filters: Add macro-economic indicators or event-driven trading filters.
Summary
The RSI Dual-Period Moving Average Reversal Strategy is a comprehensive trading system that fuses momentum and trend analysis. By cleverly combining the sensitivity of short-term RSI with the trend confirmation function of long and short-term EMAs, this strategy can maintain responsiveness to market changes while effectively reducing the risk of false trades. The built-in dynamic risk management mechanism further enhances the strategy's robustness, allowing it to adapt to different market environments.
However, like all trading strategies, this system also faces challenges in parameter optimization and market adaptability. To improve the strategy's long-term sustainability, it is recommended that traders continuously monitor strategy performance, regularly optimize parameters, and consider introducing additional analytical dimensions such as multi-timeframe analysis and quantitative risk assessment.
Finally, while this strategy shows encouraging potential, it's important to recognize that no trading strategy is perfect. Successful trading depends not only on the strategy itself but also on the trader's discipline, risk management skills, and deep understanding of the market. Therefore, in practical application, it should be combined with a sound money management strategy and a commitment to continuous learning and adaptation to market changes.
[/trans]
Source (PineScript)
/*backtest
start: 2023-06-15 00:00:00
end: 2024-06-20 00:00:00
period: 1d
basePeriod: 1h
exchanges: [{"eid":"Futures_Binance","currency":"BTC_USDT"}]
*/

//Estrategia de reversión a la media elaborada por Javier Sanjuán basada en la estrategia del RSI de dos periodos creada por Larry Connors.
//Los parámetros de la misma deben ajustarse a cada activo y temporalidad previo estudio de backtesting.
//A continuación muestro algunas configuraciones con las que se ha aplicado con éxito:
//De izquierda a derecha: temporalidad, periodos de las correspondientes medias móviles, zonas de sobrecompra y sobreventa del RSI de 2 periodos, stop loss recomendado y apalancamiento máximo permitido para cada activo.
//US100/USDT: 4h. EMAs (15, 350), RSI2 (25, 80), SL 7%, APx10.
//DAX/USDT: 4h, EMAs (45, 400), RSI2 (25, 70), SL 10%, AP x8.
//BTCUSDT: 1h, EMAs (10,400), RSI2 (10, 90), SL 10%, AP x7.
//XRPUSDT: 1h, EMAs (17, 400), RSI2 (20, 80), SL 14%, AP x5.
//XMRUSDT: 1h, EMAs (50, 400), RSI2 (30, 70), SL 13%, AP X5.
//ZECUSDT: 1h, EMAs (77, 400), RSI2 (30, 70), SL 13%, AP x5.
//Los parámetros deben modificarse cada pocos años para ajustarse a las condiciones cambiantes del mercado.
//Actualmente, vengo aplicándola sólo al mercado de las criptomonedas arriba indicadas desde enero 2023 hasta mayo 2024 con solo un mes en negativo y una rentabilidad media mensual del 26.24%.

//@version=5
strategy("Estrategia JSV", overlay=true)

// Parámetros de la estrategia
rsiPeriod = input.int(2, title="Periodo del RSI")
rsiOverbought = input.int(90, title="Zona de Sobrecompra del RSI", minval=50, maxval=100)
rsiOversold = input.int(10, title="Zona de Sobreventa del RSI", minval=0, maxval=50)
fastLength = input.int(10, title="Periodo de la Media Móvil Exponencial Rápida")
slowLength = input.int(400, title="Periodo de la Media Móvil Exponencial Lenta")
stopLossPerc = input.float(1.0, title="Stop Loss (%)")

// Indicadores
rsi = ta.rsi(close, rsiPeriod)
emaFast = ta.ema(close, fastLength)
emaSlow = ta.ema(close, slowLength)

// Señales de entrada y salida
longCondition = (close > emaSlow) and (close < emaFast) and (ta.crossover(rsi, rsiOversold))
shortCondition = (close < emaSlow) and (close > emaFast) and (ta.crossunder(rsi, rsiOverbought))
exitLongCondition = ta.crossover(close, emaFast)
exitShortCondition = ta.crossunder(close, emaFast)

// Estrategia Long
if (longCondition)
    strategy.entry("Long", strategy.long)
    // Cálculo del Stop Loss
    strategy.exit("Exit Long", "Long", stop=close * (1 - stopLossPerc / 100))

// Estrategia Short
if (shortCondition)
    strategy.entry("Short", strategy.short)
    // Cálculo del Stop Loss
    strategy.exit("Exit Short", "Short", stop=close * (1 + stopLossPerc / 100))

// Salida de la posición cuando se cruza la media rápida
if (exitLongCondition)
    strategy.close("Long")

if (exitShortCondition)
    strategy.close("Short")

// Marcas de entrada en el gráfico
plotshape(series=longCondition, title="Long Entry", location=location.belowbar, color=color.green, style=shape.triangleup)
plotshape(series=shortCondition, title="Short Entry", location=location.abovebar, color=color.red, style=shape.triangledown)

// Plot de las medias móviles
plot(emaFast, title="EMA Rápida", color=color.rgb(228, 177, 102))
plot(emaSlow, title="EMA Lenta", color=color.rgb(193, 122, 0))
Detail
https://www.fmz.com/strategy/454727
Last Modified
2024-06-21 14:01:11