
20 KiB
Name
RSI动量背离突破策略-RSI-Momentum-Divergence-Breakout-Strategy
Author
ChaoZhang
Strategy Description
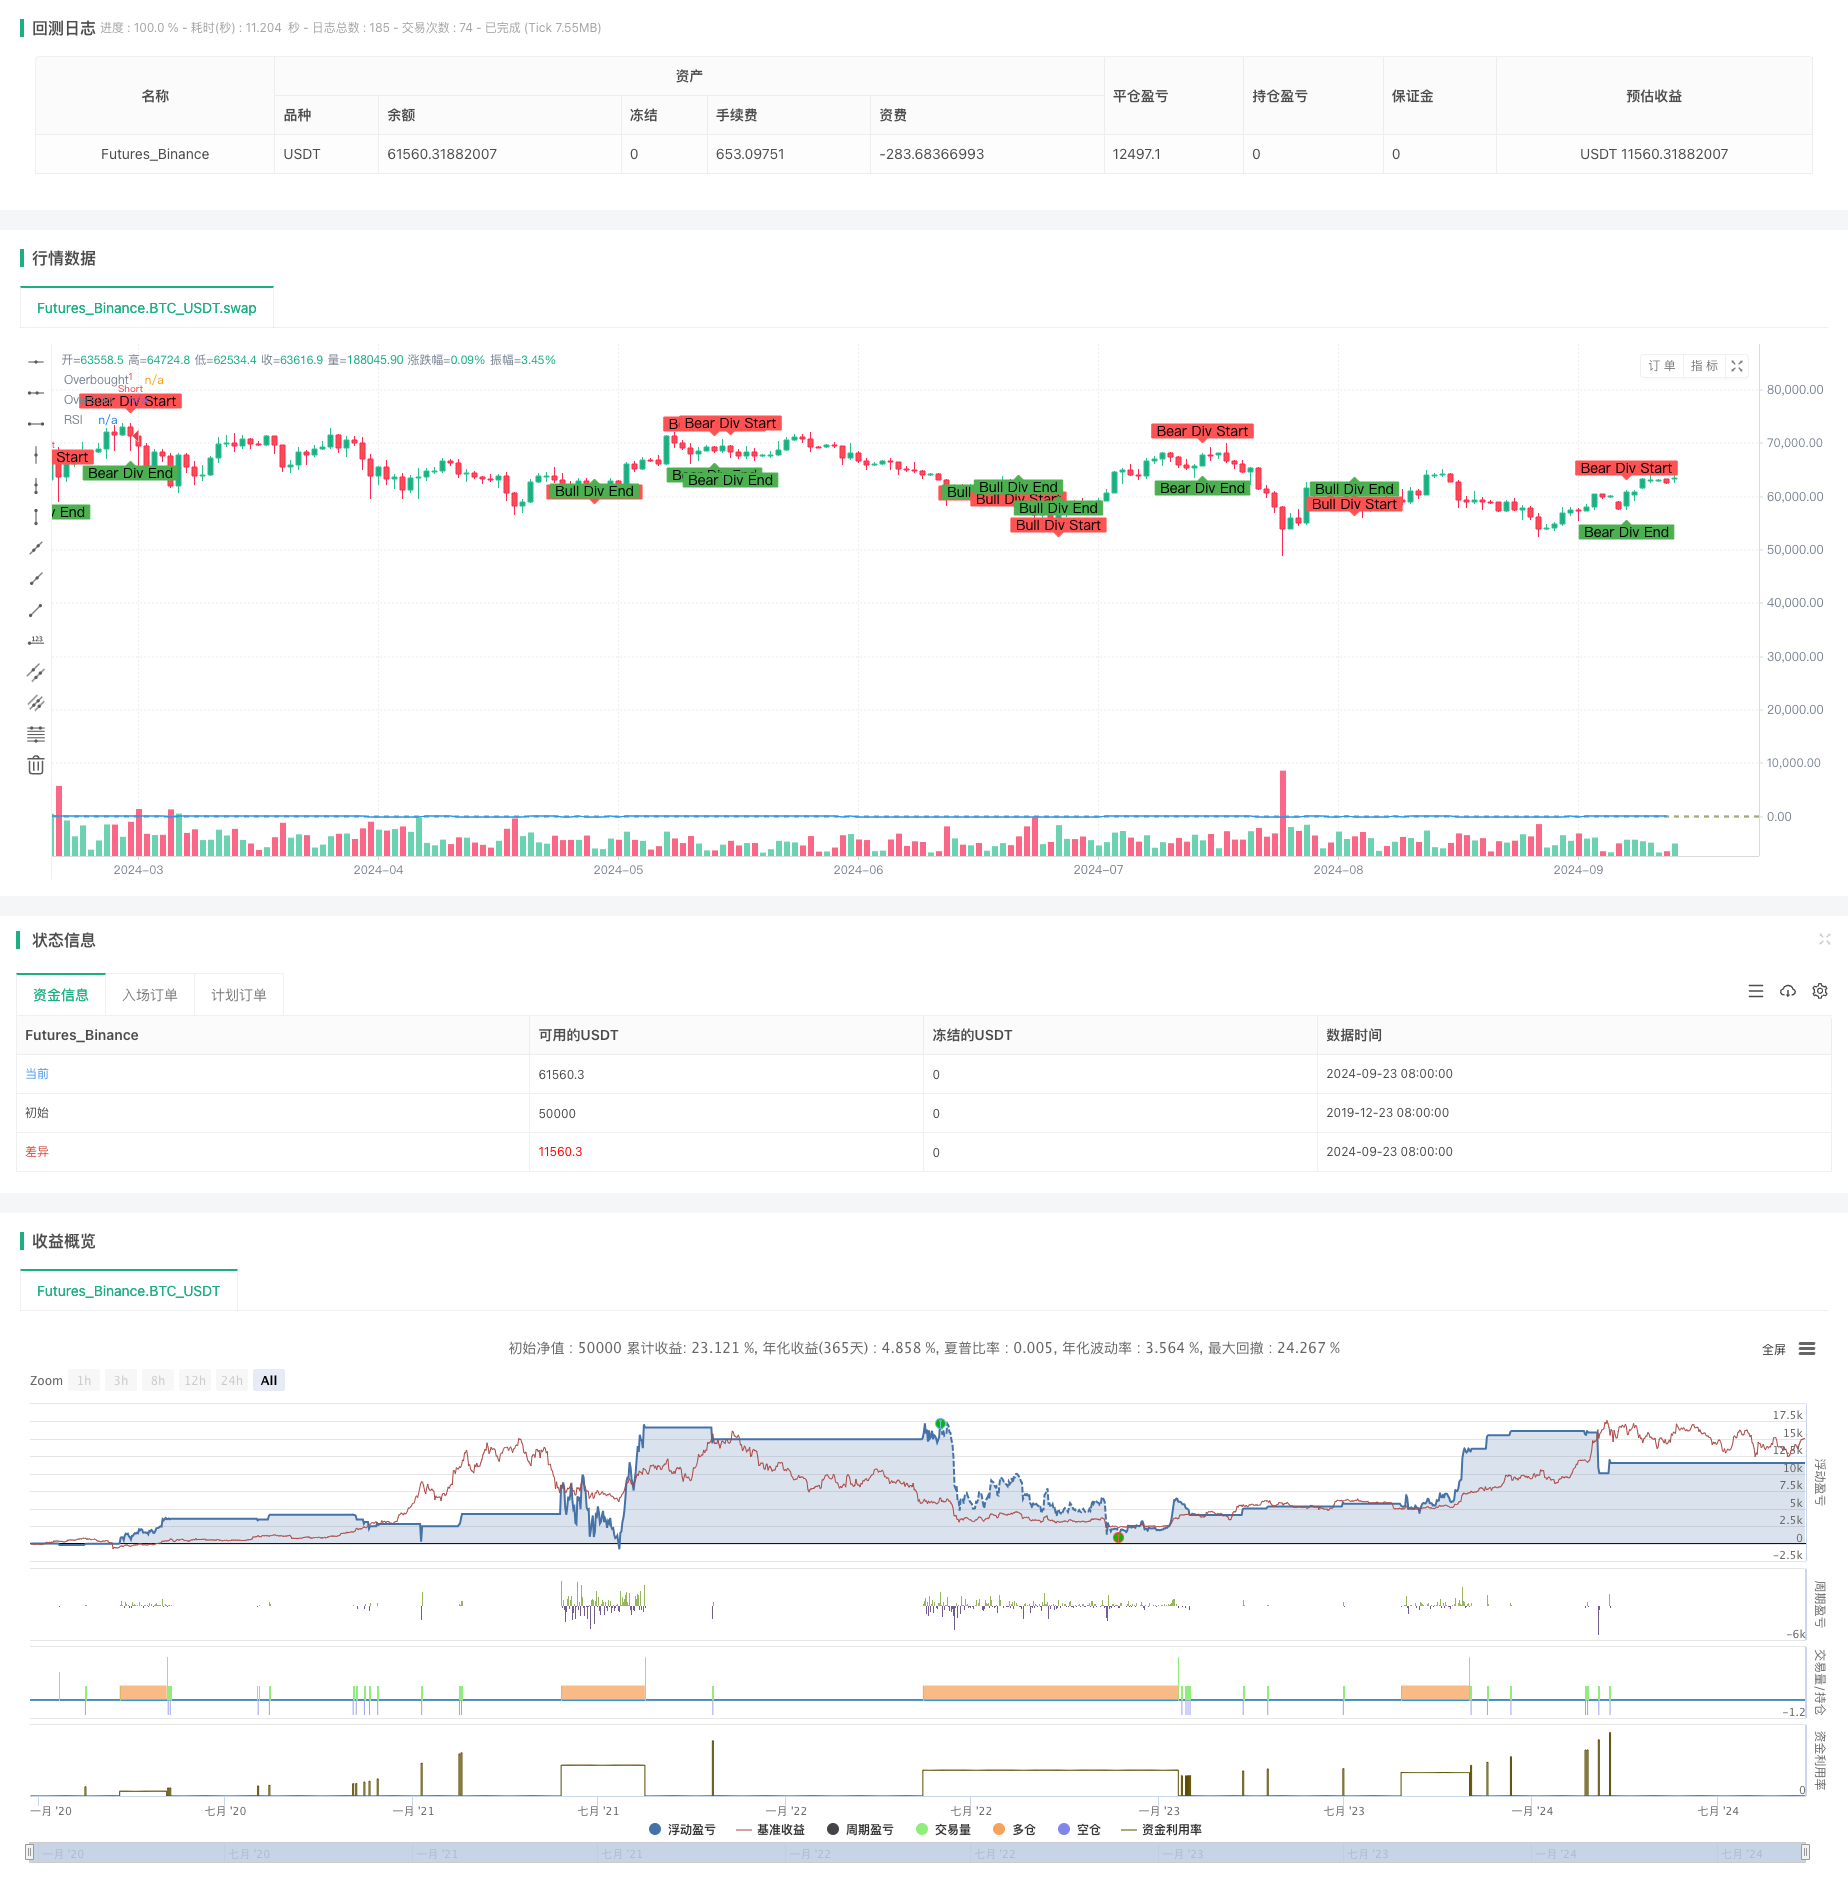
[trans]
概述
RSI动量背离突破策略是一种结合相对强弱指标(RSI)和价格动量背离的量化交易方法。该策略主要关注RSI指标与价格走势之间的背离现象,通过识别超买超卖区域的动量背离来捕捉潜在的趋势反转机会。策略在RSI达到超买或超卖水平的同时出现背离信号时进行交易,并设置了固定的止盈止损来管理风险。这种方法旨在提高交易的准确性和盈利能力,同时控制风险。
策略原理
该策略的核心原理基于以下几个关键要素:
-
RSI指标:使用14周期的RSI来衡量价格的相对强弱。RSI大于70被视为超买,小于30被视为超卖。
-
价格动量背离:
- 看涨背离:当价格创新低但RSI未创新低时形成。
- 看跌背离:当价格创新高但RSI未创新高时形成。
-
交易信号:
- 做多信号:RSI低于30(超卖)且出现看涨背离。
- 做空信号:RSI高于70(超买)且出现看跌背离。
-
风险管理:
- 对每笔交易设置固定的止盈(50个价格单位)和止损(20个价格单位)。
-
可视化:
- 在图表上标注背离的起始和结束点,以便更直观地观察信号。
策略的执行流程如下:
- 计算14周期RSI。
- 检测价格和RSI之间的看涨和看跌背离。
- 当RSI处于超卖区域(< 30)且出现看涨背离时,开仓做多。
- 当RSI处于超买区域(> 70)且出现看跌背离时,开仓做空。
- 对每个交易设置固定的止盈和止损水平。
- 在图表上标注背离的起始和结束点。
这种方法综合了技术指标和价格行为分析,旨在提高交易的准确性和及时性。通过等待RSI处于极端水平并同时出现背离,策略试图捕捉高概率的反转机会。
策略优势
-
多重确认机制:结合RSI超买超卖水平和价格背离,提供了更可靠的交易信号。这种多重过滤机制有助于减少虚假信号,提高交易的准确性。
-
趋势反转捕捉:特别擅长识别潜在的趋势反转点,有助于在新趋势的早期阶段进场。
-
风险管理集成:内置的止盈止损机制为每笔交易提供了明确的风险控制,有助于保护资金并限制潜在损失。
-
视觉辅助:通过在图表上标注背离的起始和结束点,为交易者提供了直观的视觉参考,便于快速识别交易机会。
-
适应性强:RSI和背离分析可以应用于不同的时间周期和市场,使策略具有广泛的适用性。
-
量化客观:策略的规则明确且可量化,减少了主观判断,有利于系统化交易和回测。
-
动量捕捉:通过识别RSI和价格之间的不一致性,策略能够有效捕捉市场动量的变化。
-
过滤横盘行情:策略仅在RSI达到极值且出现背离时交易,有助于避开缺乏明确方向的横盘市场。
-
灵活性:交易者可以根据个人偏好和市场特性调整RSI参数和背离判定标准。
-
教育价值:策略综合了多个技术分析概念,对新手交易者具有良好的教育意义。
策略风险
-
假突破风险:市场可能出现短暂的假突破,导致错误的交易信号。为缓解此风险,可考虑增加确认机制,如等待价格突破关键水平后再入场。
-
过度交易:频繁的背离信号可能导致过度交易。建议设置额外的过滤条件,如最小时间间隔或趋势过滤器,以减少交易频率。
-
滞后性:RSI和背离信号本质上是滞后指标,可能错过部分行情。可以考虑结合领先指标或价格行为分析来提高及时性。
-
固定止损风险:使用固定止损可能不适合所有市场条件。建议实现动态止损,如基于ATR或波动率的止损策略。
-
市场条件变化:在强劲趋势或高波动性市场中,RSI可能长期保持在超买或超卖区域,影响策略效果。可以考虑加入趋势过滤器或动态调整RSI阈值。
-
参数敏感性:策略性能可能对RSI周期和超买超卖阈值敏感。建议进行全面的参数优化和稳健性测试。
-
缺乏趋势跟踪:策略专注于反转,可能错过持续性趋势。考虑增加趋势跟踪组件,如移动平均线交叉。
-
单一时间框架限制:仅依赖单一时间框架可能错过更大趋势。建议实现多时间框架分析,以提高信号质量。
-
回撤风险:在剧烈市场波动中,固定止损可能导致较大回撤。可以考虑实施动态仓位管理和分批入场策略。
-
过度依赖技术指标:忽视基本面因素可能导致在重要事件或新闻发布时出现意外损失。建议整合基本面分析或避开重大经济数据发布期。
策略优化方向
-
多时间框架分析:整合更长和更短时间周期的RSI分析,以获得更全面的市场视角。这可以帮助确认主要趋势,提高交易信号的可靠性。
-
动态RSI阈值:根据市场波动性动态调整RSI的超买超卖阈值。在波动性较高的市场中使用更宽松的阈值,在波动性较低时使用更严格的阈值。
-
趋势过滤器:引入移动平均线或MACD等趋势指标,确保交易方向与主要趋势一致。这可以减少逆势交易,提高胜率。
-
量化背离强度:开发一个量化背离强度的指标,根据背离的幅度和持续时间为交易信号分配权重。这可以帮助优先选择更强烈的背离信号。
-
自适应RSI周期:实现基于市场波动性自动调整RSI计算周期的机制。这可以使指标更好地适应不同的市场条件。
-
集成成交量分析:将成交量数据纳入分析,确认价格和RSI背离是否得到成交量的支持。这可以提高信号的可靠性。
-
机器学习优化:使用机器学习算法优化参数选择和信号生成过程。这可以帮助发现更复杂的模式和关系。
-
波动率调整的仓位管理:根据市场波动率动态调整交易规模。在低波动时期增加仓位,在高波动时期减少仓位,以优化风险收益比。
-
多指标协同:结合其他动量指标如随机指标(Stochastic)或动量指标(Momentum),构建更全面的信号系统。
-
市场微结构分析:整合订单流和市场深度数据,以获得更精确的入场时机。这可以帮助减少滑点并改善执行质量。
-
情绪分析集成:引入基于社交媒体或新闻情绪的分析,作为交易决策的辅助指标。这可以帮助捕捉市场情绪变化带来的机会。
-
自动化参数优化:实现定期自动化参数优化流程,以适应不断变化的市场条件。这可以确保策略始终保持最佳状态。
总结
RSI动量背离突破策略是一种结合技术指标和价格行为分析的量化交易方法。通过识别RSI与价格之间的背离,并在超买超卖区域寻找交易机会,该策略旨在捕捉潜在的趋势反转点。其核心优势在于多重确认机制和内置的风险管理,有助于提高交易的准确性和安全性。
然而,该策略也面临着一些挑战,如假突破风险、过度交易的可能性以及在某些市场条件下的局限性。为了应对这些风险并进一步提升策略性能,我们提出了多个优化方向,包括多时间框架分析、动态参数调整、趋势过滤和机器学习应用等。
总的来说,RSI动量背离突破策略为交易者提供了一个系统化的方法来识别和交易市场反转。通过持续的优化和风险管理,该策略有潜力成为一个可靠的交易工具。然而,交易者应当始终牢记,没有任何策略是完美的,持续的监控、评估和调整是取得长期成功的关键。在实际应用中,建议结合其他分析方法,并根据个人风险承受能力和市场经验进行适当的定制和调整。
||
Overview
The RSI Momentum Divergence Breakout Strategy is a quantitative trading method that combines the Relative Strength Index (RSI) with price momentum divergence. This strategy primarily focuses on identifying divergence phenomena between the RSI indicator and price trends to capture potential trend reversal opportunities. The strategy initiates trades when the RSI reaches overbought or oversold levels coinciding with divergence signals, and implements fixed take-profit and stop-loss levels for risk management. This approach aims to enhance trading accuracy and profitability while controlling risk.
Strategy Principle
The core principles of this strategy are based on the following key elements:
-
RSI Indicator: Uses a 14-period RSI to measure the relative strength of price movements. An RSI above 70 is considered overbought, while below 30 is considered oversold.
-
Price Momentum Divergence:
- Bullish Divergence: Forms when price makes a lower low but RSI fails to make a lower low.
- Bearish Divergence: Forms when price makes a higher high but RSI fails to make a higher high.
-
Trading Signals:
- Long Signal: RSI below 30 (oversold) and bullish divergence present.
- Short Signal: RSI above 70 (overbought) and bearish divergence present.
-
Risk Management:
- Sets fixed take-profit (50 price units) and stop-loss (20 price units) for each trade.
-
Visualization:
- Marks the start and end points of divergences on the chart for more intuitive observation of signals.
The execution process of the strategy is as follows:
- Calculate the 14-period RSI.
- Detect bullish and bearish divergences between price and RSI.
- Enter a long position when RSI is in the oversold zone (< 30) and bullish divergence is present.
- Enter a short position when RSI is in the overbought zone (> 70) and bearish divergence is present.
- Set fixed take-profit and stop-loss levels for each trade.
- Mark the start and end points of divergences on the chart.
This method combines technical indicators with price action analysis, aiming to improve the accuracy and timeliness of trades. By waiting for RSI to reach extreme levels while simultaneously observing divergence, the strategy attempts to capture high-probability reversal opportunities.
Strategy Advantages
-
Multiple Confirmation Mechanism: Combines RSI overbought/oversold levels with price divergence, providing more reliable trading signals. This multi-filter mechanism helps reduce false signals and improve trading accuracy.
-
Trend Reversal Capture: Particularly adept at identifying potential trend reversal points, helping to enter new trends in their early stages.
-
Integrated Risk Management: Built-in stop-loss and take-profit mechanisms provide clear risk control for each trade, helping to protect capital and limit potential losses.
-
Visual Assistance: By marking the start and end points of divergences on the chart, it provides traders with intuitive visual references for quick identification of trading opportunities.
-
High Adaptability: RSI and divergence analysis can be applied to different time frames and markets, giving the strategy wide applicability.
-
Quantitative Objectivity: The strategy's rules are clear and quantifiable, reducing subjective judgment and favoring systematic trading and backtesting.
-
Momentum Capture: By identifying inconsistencies between RSI and price, the strategy can effectively capture changes in market momentum.
-
Filtering Sideways Markets: The strategy only trades when RSI reaches extreme values and divergence occurs, helping to avoid markets lacking clear direction.
-
Flexibility: Traders can adjust RSI parameters and divergence criteria based on personal preferences and market characteristics.
-
Educational Value: The strategy combines multiple technical analysis concepts, providing good educational value for novice traders.
Strategy Risks
-
False Breakout Risk: The market may experience brief false breakouts, leading to incorrect trading signals. To mitigate this risk, consider adding confirmation mechanisms, such as waiting for price to break key levels before entering.
-
Overtrading: Frequent divergence signals may lead to overtrading. Consider setting additional filtering conditions, such as minimum time intervals or trend filters, to reduce trading frequency.
-
Lagging Nature: RSI and divergence signals are inherently lagging indicators and may miss part of the market movement. Consider combining leading indicators or price action analysis to improve timeliness.
-
Fixed Stop-Loss Risk: Using fixed stop-losses may not be suitable for all market conditions. Consider implementing dynamic stop-losses, such as ATR-based or volatility-based stop-loss strategies.
Changing Market Conditions: In strong trends or highly volatile markets, RSI may remain in overbought or oversold territories for extended periods, affecting strategy performance. Consider adding trend filters or dynamically adjusting RSI thresholds. Parameter Sensitivity: Strategy performance may be sensitive to RSI period and overbought/oversold thresholds. Conduct comprehensive parameter optimization and robustness testing. Lack of Trend Following: The strategy focuses on reversals and may miss sustained trends. Consider adding trend-following components, such as moving average crossovers. Single Timeframe Limitation: Relying on a single timeframe may miss larger trends. Implement multi-timeframe analysis to improve signal quality. Drawdown Risk: In severe market fluctuations, fixed stop-losses may lead to significant drawdowns. Consider implementing dynamic position sizing and phased entry strategies. Over-reliance on Technical Indicators: Ignoring fundamental factors may lead to unexpected losses during important events or news releases. Consider integrating fundamental analysis or avoiding major economic data release periods.
Strategy Optimization Directions
Multi-Timeframe Analysis: Integrate RSI analysis from longer and shorter time periods for a more comprehensive market perspective. This can help confirm major trends and improve the reliability of trading signals. Dynamic RSI Thresholds: Dynamically adjust RSI overbought/oversold thresholds based on market volatility. Use looser thresholds in high-volatility markets and stricter thresholds in low-volatility markets. Trend Filter: Introduce trend indicators such as moving averages or MACD to ensure trade direction aligns with the main trend. This can reduce counter-trend trades and improve win rates. Quantify Divergence Strength: Develop an indicator to quantify divergence strength, assigning weights to trading signals based on the magnitude and duration of divergences. This can help prioritize stronger divergence signals. Adaptive RSI Period: Implement a mechanism to automatically adjust the RSI calculation period based on market volatility. This allows the indicator to better adapt to different market conditions. Integrate Volume Analysis: Incorporate volume data to confirm whether price and RSI divergences are supported by volume. This can increase signal reliability. Machine Learning Optimization: Use machine learning algorithms to optimize parameter selection and signal generation processes. This can help discover more complex patterns and relationships. Volatility-Adjusted Position Sizing: Dynamically adjust trade size based on market volatility. Increase position size during low volatility periods and decrease during high volatility periods to optimize risk-reward ratios. Multi-Indicator Synergy: Combine other momentum indicators like Stochastic or Momentum to build a more comprehensive signaling system. Market Microstructure Analysis: Integrate order flow and market depth data for more precise entry timing. This can help reduce slippage and improve execution quality. Sentiment Analysis Integration: Incorporate analysis based on social media or news sentiment as an auxiliary indicator for trading decisions. This can help capture opportunities arising from market sentiment changes. Automated Parameter Optimization: Implement a periodic automated parameter optimization process to adapt to constantly changing market conditions. This ensures the strategy always maintains optimal performance.
Summary The RSI Momentum Divergence Breakout Strategy is a quantitative trading method that combines technical indicators with price action analysis. By identifying divergences between RSI and price, and seeking trading opportunities in overbought and oversold areas, this strategy aims to capture potential trend reversal points. Its core strengths lie in its multiple confirmation mechanisms and built-in risk management, which help improve trading accuracy and safety. However, the strategy also faces challenges such as false breakout risks, the possibility of overtrading, and limitations in certain market conditions. To address these risks and further enhance strategy performance, we have proposed several optimization directions, including multi-timeframe analysis, dynamic parameter adjustment, trend filtering, and machine learning applications. Overall, the RSI Momentum Divergence Breakout Strategy provides traders with a systematic method to identify and trade market reversals. Through continuous optimization and risk management, this strategy has the potential to become a reliable trading tool. However, traders should always remember that no strategy is perfect, and continuous monitoring, evaluation, and adjustment are key to long-term success. In practical application, it is recommended to combine this strategy with other analytical methods and make appropriate customizations and adjustments based on individual risk tolerance and market experience. [/trans]
Source (PineScript)
/*backtest
start: 2019-12-23 08:00:00
end: 2024-09-24 08:00:00
period: 1d
basePeriod: 1d
exchanges: [{"eid":"Futures_Binance","currency":"BTC_USDT"}]
*/

//@version=5
strategy("RSI + RSI Divergence Strategy", overlay=true)

// RSI settings
rsiLength = 14
rsiOverbought = 70
rsiOversold = 30

// Calculate RSI
rsi = ta.rsi(close, rsiLength)

// Function to detect bullish divergence
bullishDivergence(prices, rsiValues) =>
    ta.lowest(prices, 3) < ta.lowest(prices[1], 3)[1] and ta.lowest(rsiValues, 3) > ta.lowest(rsiValues[1], 3)[1]

// Function to detect bearish divergence
bearishDivergence(prices, rsiValues) =>
    ta.highest(prices, 3) > ta.highest(prices[1], 3)[1] and ta.highest(rsiValues, 3) < ta.highest(rsiValues[1], 3)[1]

// Detect divergences
bullDiv = bullishDivergence(close, rsi)
bearDiv = bearishDivergence(close, rsi)

// Plot RSI
plot(rsi, title="RSI", color=color.blue)
hline(rsiOverbought, "Overbought", color=color.red)
hline(rsiOversold, "Oversold", color=color.green)

// Long condition: RSI oversold and bullish divergence
if (rsi < rsiOversold and bullDiv)
    strategy.entry("Long", strategy.long)

// Short condition: RSI overbought and bearish divergence
if (rsi > rsiOverbought and bearDiv)
    strategy.entry("Short", strategy.short)

// Exit condition: Define your trailing stop or take profit logic
// This example uses a fixed take profit and stop loss
strategy.exit("Take Profit/Stop Loss", from_entry="Long", limit=close + 50, stop=close - 20)
strategy.exit("Take Profit/Stop Loss", from_entry="Short", limit=close - 50, stop=close + 20)

// Plot divergence start and end markers
plotshape(series=bullDiv, location=location.belowbar, color=color.red, style=shape.labeldown, text="Bull Div Start", size=size.small)
plotshape(series=not bullDiv[1] and bullDiv, location=location.abovebar, color=color.green, style=shape.labelup, text="Bull Div End", size=size.small)

plotshape(series=bearDiv, location=location.abovebar, color=color.red, style=shape.labeldown, text="Bear Div Start", size=size.small)
plotshape(series=not bearDiv[1] and bearDiv, location=location.belowbar, color=color.green, style=shape.labelup, text="Bear Div End", size=size.small)
Detail
https://www.fmz.com/strategy/468302
Last Modified
2024-09-26 14:37:51