
14 KiB
Name
RSI动态背离量化策略-RSI-Dynamic-Divergence-Quantitative-Strategy
Author
ianzeng123
Strategy Description
[trans]
概述
RSI双枢轴背离量化策略是一种通过检测价格行为与相对强弱指数(RSI)之间的常规看涨和看跌背离来识别潜在反转机会的高级交易策略。该策略采用自动化枢轴点检测算法,结合两种不同的止损/止盈管理方法,在确认背离信号时自动建立头寸。策略核心在于通过精确的数学计算验证价格与RSI指标之间的背离现象,并采用动态风险管理机制确保每笔交易都遵循预设的风险回报比。
策略原理
- RSI计算模块:采用Wilder平滑方法计算14周期(可调)RSI值,使用收盘价作为默认输入源(可配置)。
- 枢轴点检测:
- 使用左右各5周期(可调)的滑动窗口检测RSI指标的局部高点和低点
- 通过ta.barssince函数确保枢轴点之间间隔5-60根K线(可调范围)
- 背离确认逻辑:
- 看涨背离:价格创新低而RSI形成更高的低点
- 看跌背离:价格创新高而RSI形成更低的高点
- 交易执行系统:
- 采用双模式止损机制:基于最近20周期(可调)摆动点或ATR波动幅度
- 动态止盈计算:根据风险金额乘以预设的回报风险比(默认2:1)
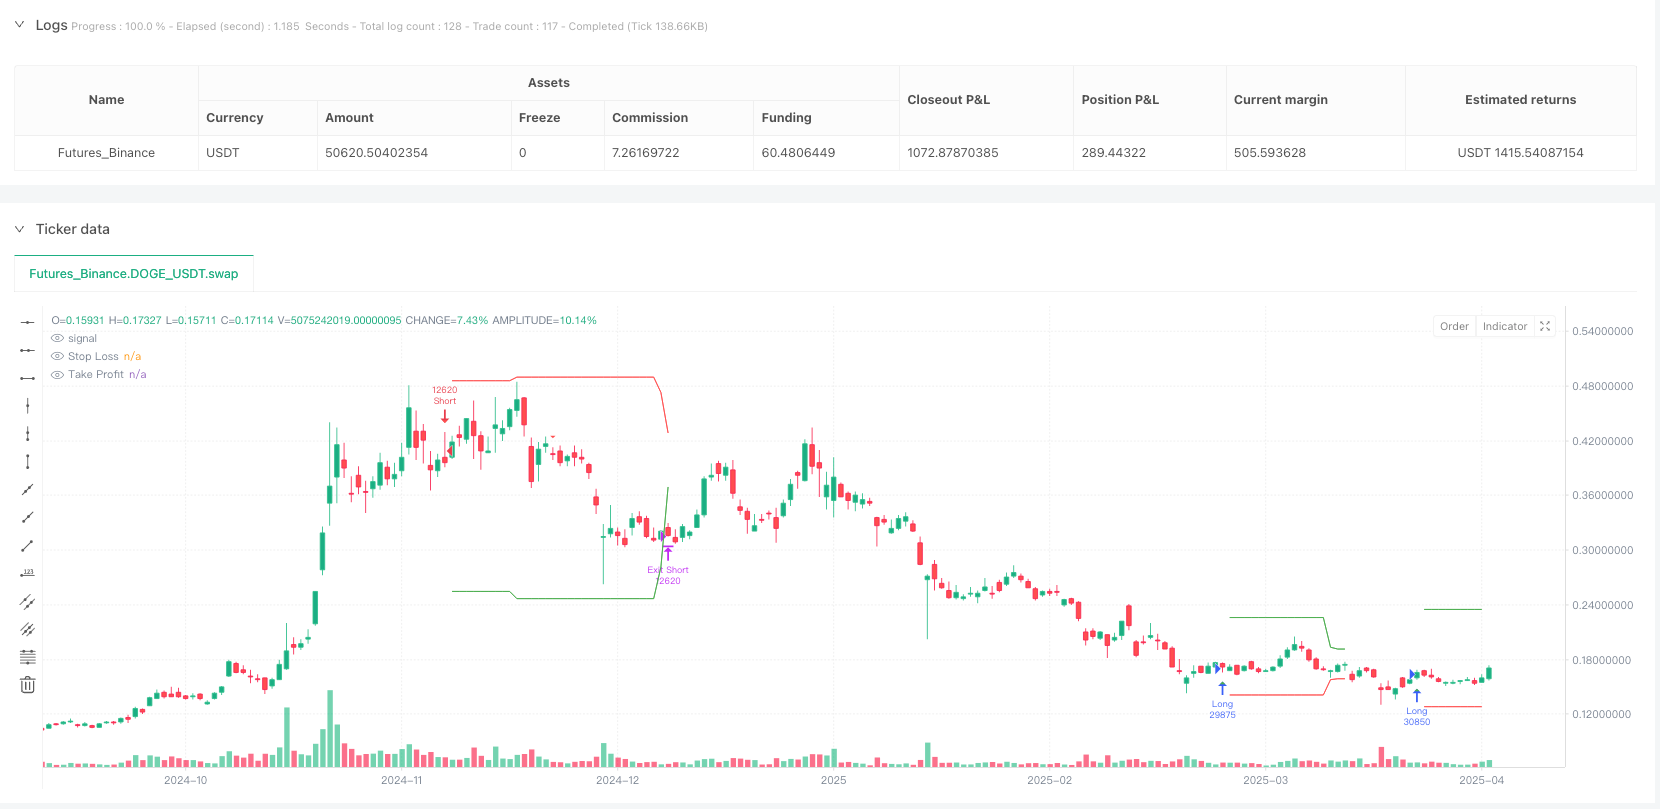
- 可视化系统:在图表上标记所有有效背离信号,并实时显示当前持仓的止损(红色)和止盈(绿色)水平线。
优势分析
- 多维度验证机制:要求价格和RSI必须同时满足特定形态,且时间间隔在预设范围内,大幅降低假信号概率。
- 自适应风险管理:
- 摆动点模式适合趋势市场,能有效抓住波段行情
- ATR模式适合震荡市场,根据波动率自动调整止损幅度
- 参数高度可配置:所有关键参数(RSI周期、枢轴检测范围、风险回报比等)均可根据市场特性调整。
- 科学的资金管理:默认采用10%的仓位比例,防止单笔交易过度风险暴露。
- 实时视觉反馈:通过图表标记和动态止损/止盈线,提供直观的交易决策支持。
风险分析
- 滞后性风险:RSI作为滞后指标,在剧烈单边行情中可能产生延迟信号。缓解方案:结合趋势过滤器或缩短RSI周期。
- 震荡市场风险:在无明确趋势时可能产生连续假信号。缓解方案:启用ATR模式并增大乘数,或附加波动率过滤器。
- 参数过拟合风险:特定参数组合可能在历史数据表现良好但实盘失效。缓解方案:进行多周期多品种压力测试。
- 极端行情风险:跳空缺口可能导致止损失效。缓解方案:避免重大经济事件前后交易,或使用期权对冲。
- 时间框架依赖性:不同时间周期表现差异较大。缓解方案:在目标时间框架进行充分回测优化。
优化方向
- 复合指标验证:增加MACD或成交量指标作为二次确认,提升信号质量。
- 动态参数调整:根据市场波动率自动调整RSI周期和ATR乘数。
- 机器学习优化:使用遗传算法优化关键参数组合。
- 多时间框架分析:引入更高时间框架的趋势方向过滤。
- 仓位动态管理:根据波动率调整仓位大小,实现风险均衡。
- 事件过滤器:集成经济日历数据,避免重要数据发布前后的交易。
总结
RSI双枢轴背离量化策略通过系统化的背离识别和严格的风险管理,提供了一种结构化的反转交易方法。其核心价值在于将传统技术分析概念转化为可量化的交易规则,并通过双模式止损机制适应不同市场环境。策略表现出色需要三个关键要素:适当的参数优化、严格的风险控制和一致性的执行纪律。该策略特别适合有一定波动性但趋势不极端的市场环境,是中级交易者向量化交易过渡的优秀模板。
||
Overview
The RSI Dual-Pivot Divergence Quantification Strategy is an advanced trading methodology that identifies potential reversal opportunities by detecting regular bullish and bearish divergences between price action and the Relative Strength Index (RSI). This strategy employs an automated pivot detection algorithm combined with two distinct stop-loss/take-profit management approaches to automatically establish positions when divergence signals are confirmed. The core innovation lies in its precise mathematical validation of price-RSI divergence phenomena and dynamic risk management mechanisms that ensure each trade adheres to predetermined risk-reward ratios.
Strategy Logic
- RSI Calculation Module: Utilizes Wilder's smoothing method to compute 14-period (adjustable) RSI values with close price as default input (configurable).
- Pivot Detection:
- Employs sliding windows of 5 periods (adjustable) on both sides to identify local RSI highs and lows
- Uses ta.barssince function to ensure 5-60 bar intervals (adjustable range) between pivots
- Divergence Confirmation:
- Bullish divergence: Price makes lower low while RSI forms higher low
- Bearish divergence: Price makes higher high while RSI forms lower high
- Trade Execution System:
- Dual-mode stop-loss: Based on recent 20-period (adjustable) swing points or ATR volatility
- Dynamic take-profit: Calculated as risk amount multiplied by preset reward-risk ratio (default 2:1)
- Visualization System: Marks all valid divergence signals on chart and displays real-time stop-loss (red) and take-profit (green) levels for open positions.
Advantages
- Multi-dimensional Validation: Requires both price and RSI to meet specific patterns within preset time ranges, significantly reducing false signals.
- Adaptive Risk Management:
- Swing mode suits trending markets for capturing wave movements
- ATR mode adapts to ranging markets with volatility-based stops
- High Customizability: All critical parameters (RSI period, pivot range, risk-reward ratio etc.) adjustable for market conditions.
- Scientific Position Sizing: Default 10% capital allocation prevents overexposure in single trades.
- Visual Feedback: Real-time chart markings and dynamic stop/take-profit lines provide intuitive decision support.
Risks
- Lag Risk: RSI as lagging indicator may generate delayed signals during strong trends. Mitigation: Add trend filters or shorten RSI period.
- Whipsaw Risk: May produce consecutive false signals in choppy markets. Mitigation: Use ATR mode with higher multipliers or add volatility filters.
- Overfitting Risk: Parameter sets may perform well historically but fail live. Mitigation: Conduct multi-period multi-asset stress tests.
- Gap Risk: Price gaps may bypass stops. Mitigation: Avoid trading around major economic events or use options hedging.
- Timeframe Dependency: Performance varies across timeframes. Mitigation: Thorough backtesting on target timeframe.
Optimization Directions
- Composite Verification: Add MACD or volume indicators for secondary confirmation.
- Dynamic Parameters: Auto-adjust RSI period and ATR multiplier based on market volatility.
- Machine Learning: Apply genetic algorithms to optimize parameter combinations.
- Multi-Timeframe Analysis: Incorporate higher timeframe trend filters.
- Dynamic Position Sizing: Adjust trade size based on volatility for risk parity.
- Event Filters: Integrate economic calendar to avoid trading around major news.
Conclusion
The RSI Dual-Pivot Divergence Quantification Strategy provides a structured approach to reversal trading through systematic divergence identification and rigorous risk management. Its core value lies in transforming traditional technical analysis concepts into quantifiable trading rules with dual-mode stop mechanisms adaptable to varying market conditions. Strategy excellence requires three key elements: appropriate parameter optimization, strict risk control, and consistent execution discipline. Particularly effective in moderately volatile, non-extreme trending environments, this strategy serves as an excellent template for intermediate traders transitioning to quantitative trading methodologies.
[/trans]
Source (PineScript)
/*backtest
start: 2024-04-25 00:00:00
end: 2025-04-23 08:00:00
period: 1d
basePeriod: 1d
exchanges: [{"eid":"Futures_Binance","currency":"DOGE_USDT"}]
*/

//@version=6
strategy("RSI Divergence Strategy - AliferCrypto", overlay=true, default_qty_type=strategy.percent_of_equity, default_qty_value=10)

// === RSI Settings ===
rsiLength      = input.int(14, minval=1, title="RSI Length", group="RSI Settings", tooltip="Number of periods for RSI calculation")
rsiSource      = input.source(close, title="RSI Source", group="RSI Settings", tooltip="Price source used for RSI calculation")

// === Divergence Settings ===
lookLeft       = input.int(5, minval=1, title="Pivot Lookback Left", group="Divergence Settings", tooltip="Bars to the left for pivot detection")
lookRight      = input.int(5, minval=1, title="Pivot Lookback Right", group="Divergence Settings", tooltip="Bars to the right for pivot detection")
rangeLower     = input.int(5, minval=1, title="Min Bars Between Pivots", group="Divergence Settings", tooltip="Minimum bars between pivots to validate divergence")
rangeUpper     = input.int(60, minval=1, title="Max Bars Between Pivots", group="Divergence Settings", tooltip="Maximum bars between pivots to validate divergence")

// === SL/TP Method ===
method         = input.string("Swing", title="SL/TP Method", options=["Swing", "ATR"], group="SL/TP Settings", tooltip="Choose between swing-based or ATR-based stop and target")

// === Swing Settings ===
swingLook      = input.int(20, minval=1, title="Swing Lookback (bars)", group="Swing Settings", tooltip="Bars to look back for swing high/low")
swingMarginPct = input.float(1.0, minval=0.0, title="Swing Margin (%)", group="Swing Settings", tooltip="Margin around swing levels as percentage of price")
rrSwing        = input.float(2.0, title="R/R Ratio (Swing)", group="Swing Settings", tooltip="Risk/reward ratio when using swing-based method")

// === ATR Settings ===
atrLen         = input.int(14, minval=1, title="ATR Length", group="ATR Settings", tooltip="Number of periods for ATR calculation")
atrMult        = input.float(1.5, minval=0.1, title="ATR SL Multiplier", group="ATR Settings", tooltip="Multiplier for ATR-based stop loss calculation")
rrAtr          = input.float(2.0, title="R/R Ratio (ATR)", group="ATR Settings", tooltip="Risk/reward ratio when using ATR-based method")

// === RSI Calculation ===
_d    = ta.change(rsiSource)
up    = ta.rma(math.max(_d, 0), rsiLength)
down  = ta.rma(-math.min(_d, 0), rsiLength)
rsi   = down == 0 ? 100 : up == 0 ? 0 : 100 - (100 / (1 + up / down))

// === Divergence Detection ===
defPl      = not na(ta.pivotlow(rsi, lookLeft, lookRight))
defPh      = not na(ta.pivothigh(rsi, lookLeft, lookRight))
rsiAtRR   = rsi[lookRight]
barsPl    = ta.barssince(defPl)
barsPl1   = barsPl[1]
inRangePL = barsPl1 >= rangeLower and barsPl1 <= rangeUpper
barsPh    = ta.barssince(defPh)
barsPh1   = barsPh[1]
inRangePH = barsPh1 >= rangeLower and barsPh1 <= rangeUpper
prevPlRsi   = ta.valuewhen(defPl, rsiAtRR, 1)
prevPhRsi   = ta.valuewhen(defPh, rsiAtRR, 1)
prevPlPrice = ta.valuewhen(defPl, low[lookRight], 1)
prevPhPrice = ta.valuewhen(defPh, high[lookRight], 1)
bullCond    = defPl and low[lookRight] < prevPlPrice and rsiAtRR > prevPlRsi and inRangePL
bearCond    = defPh and high[lookRight] > prevPhPrice and rsiAtRR < prevPhRsi and inRangePH

plotshape(bullCond, title="Bullish Divergence", style=shape.triangleup, location=location.belowbar, color=color.green, size=size.tiny)
plotshape(bearCond, title="Bearish Divergence", style=shape.triangledown, location=location.abovebar, color=color.red, size=size.tiny)

// === Entries ===
if bullCond
    strategy.entry("Long", strategy.long)
if bearCond
    strategy.entry("Short", strategy.short)

// === Pre-calculate SL/TP components ===
swingLow    = ta.lowest(low, swingLook)
swingHigh   = ta.highest(high, swingLook)
atrValue    = ta.atr(atrLen)

// === SL/TP Calculation & Exits ===
var float slPrice = na
var float tpPrice = na
var float rr      = na

// Long exits
if strategy.position_size > 0
    entryPrice = strategy.position_avg_price
    if method == "Swing"
        slPrice := swingLow * (1 - swingMarginPct / 100)
        rr      := rrSwing
    else
        slPrice := entryPrice - atrValue * atrMult
        rr      := rrAtr
    risk     = entryPrice - slPrice
    tpPrice  := entryPrice + risk * rr
    strategy.exit("Exit Long", from_entry="Long", stop=slPrice, limit=tpPrice)

// Short exits
if strategy.position_size < 0
    entryPrice = strategy.position_avg_price
    if method == "Swing"
        slPrice := swingHigh * (1 + swingMarginPct / 100)
        rr      := rrSwing
    else
        slPrice := entryPrice + atrValue * atrMult
        rr      := rrAtr
    risk     = slPrice - entryPrice
    tpPrice  := entryPrice - risk * rr
    strategy.exit("Exit Short", from_entry="Short", stop=slPrice, limit=tpPrice)

// === Plot SL/TP Levels ===
plot(strategy.position_size != 0 ? slPrice : na, title="Stop Loss", style=plot.style_linebr, color=color.red)
plot(strategy.position_size != 0 ? tpPrice : na, title="Take Profit", style=plot.style_linebr, color=color.green)

// === Alerts ===
alertcondition(bullCond, title="Bull RSI Divergence", message="Bullish RSI divergence detected")
alertcondition(bearCond, title="Bear RSI Divergence", message="Bearish RSI divergence detected")
Detail
https://www.fmz.com/strategy/492007
Last Modified
2025-04-25 14:57:31