
7.6 KiB
Name
RSI动态止损智能交易策略-RSI-Dynamic-Stop-Loss-Intelligent-Trading-Strategy
Author
ChaoZhang
Strategy Description
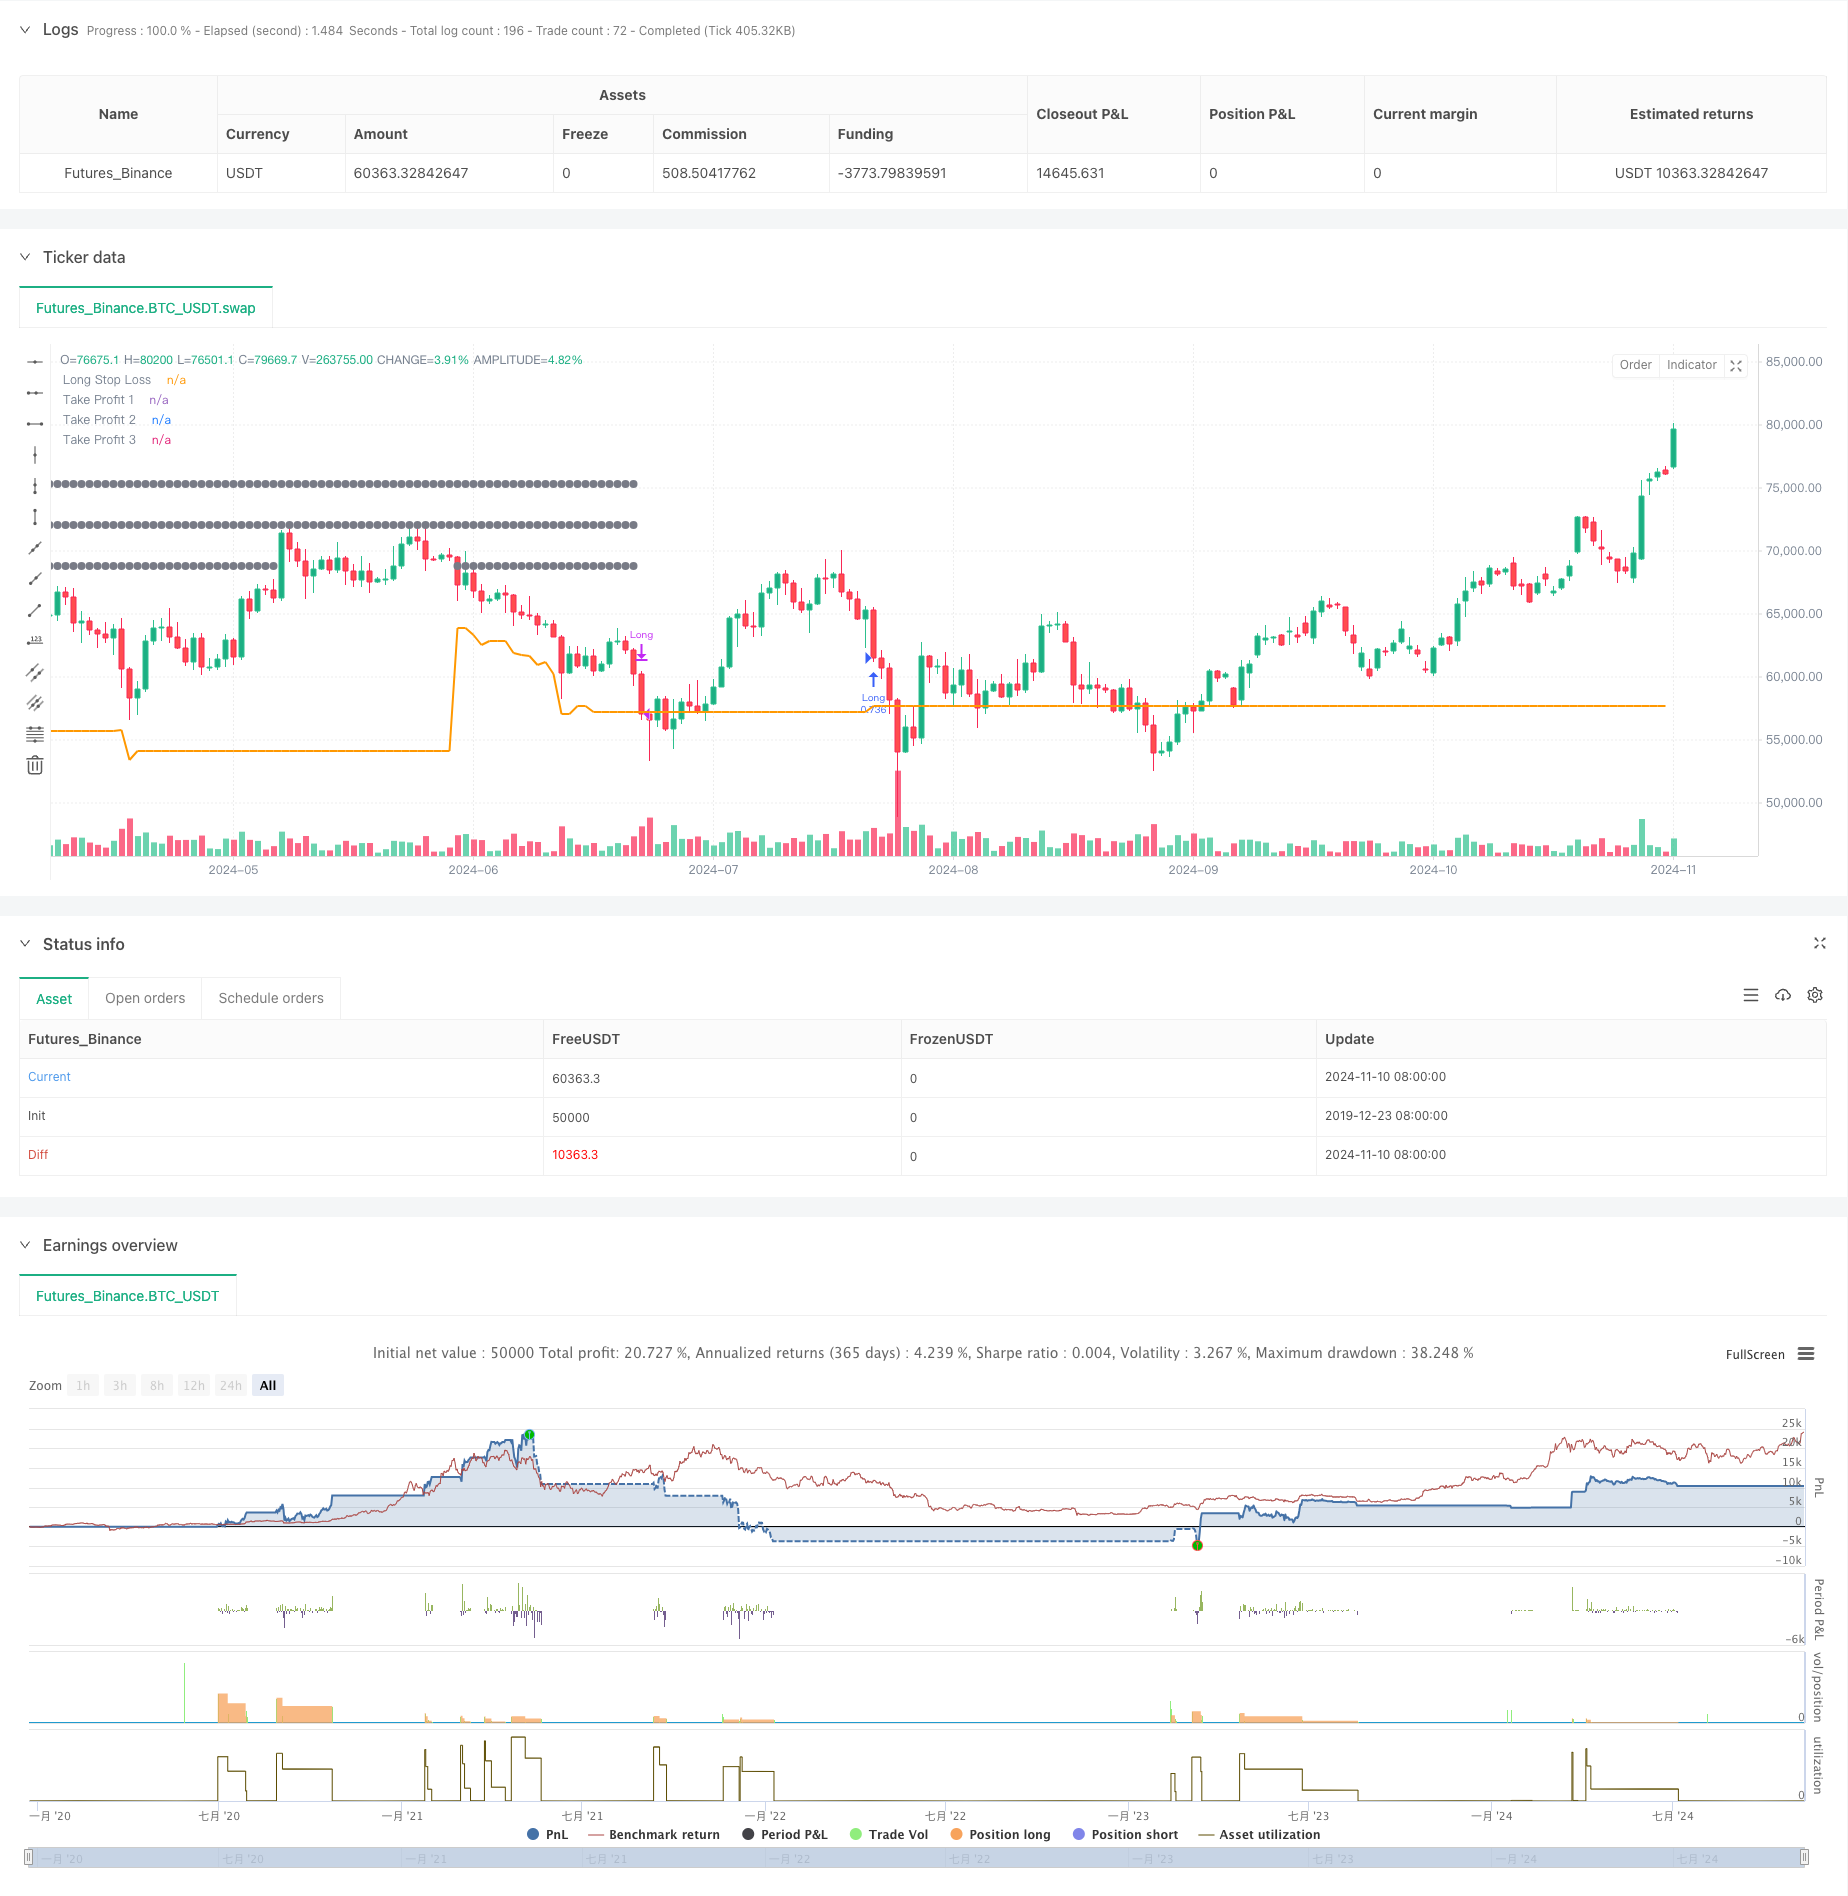
[trans]
概述
该策略是一个基于RSI指标的动态止损交易系统,结合了SMA均线和ATR波幅指标来优化交易决策。策略采用多层次止盈方案,通过金字塔式平仓方式实现收益最大化,同时运用ATR动态止损来控制风险。策略具有高度的自适应性,能够根据市场波动情况自动调整交易参数。
策略原理
策略主要依据RSI超卖区间(RSI<30)作为开仓信号,并要求价格位于200日均线之上,以确保处于上升趋势。系统采用三重止盈目标(5%、10%、15%),并结合ATR动态止损。具体来说:
- 入场条件: RSI低于30且价格在SMA200上方
- 仓位管理: 单次开仓使用75%资金
- 止损设置: 基于1.5倍ATR值的动态止损
- 止盈策略: 分别在5%、10%、15%位置设置三档止盈点,按33%、66%、100%比例分批平仓
策略优势
- 动态风险管理: 通过ATR自适应市场波动
- 分批止盈: 降低情绪干扰,提高盈利概率
- 趋势确认: 利用均线过滤假信号
- 资金管理: 采用百分比仓位控制,适应不同账户规模
- 佣金优化: 考虑了交易成本,更贴近实际交易
策略风险
- 均线滞后性可能导致入场延迟
- RSI超卖不一定代表反转
- 大比例仓位可能带来较大回撤
- 频繁分批止盈可能增加交易成本 建议通过调整参数和增加过滤条件来管理这些风险。
策略优化方向
- 增加成交量确认信号
- 引入趋势强度指标
- 优化止盈比例分配
- 添加时间周期过滤
- 考虑加入波动率自适应的仓位管理
总结
该策略通过结合技术指标和动态风险管理,构建了一个相对完整的交易系统。其优势在于自适应性强、风险可控,但仍需根据实际市场情况进行参数优化。策略适合中长期投资者使用,可作为系统化交易的良好起点。
||
Overview
This strategy is a dynamic stop-loss trading system based on the RSI indicator, combining SMA and ATR indicators to optimize trading decisions. It employs a multi-level take-profit approach with pyramid-style position closing to maximize returns while using ATR dynamic stop-loss for risk control. The strategy features high adaptability and automatically adjusts trading parameters based on market volatility.
Strategy Principles
The strategy primarily uses RSI oversold conditions (RSI<30) as entry signals while requiring price to be above the 200-day moving average to ensure an uptrend. It implements three take-profit targets (5%, 10%, 15%) combined with ATR dynamic stop-loss. Specifically:
- Entry conditions: RSI below 30 and price above SMA200
- Position management: 75% capital per trade
- Stop-loss: Dynamic stop based on 1.5x ATR
- Take-profit: Three levels at 5%, 10%, 15%, closing 33%, 66%, and 100% respectively
Strategy Advantages
- Dynamic risk management: ATR adaptation to market volatility
- Staged profit-taking: Reduces emotional interference and improves profit probability
- Trend confirmation: Uses moving average to filter false signals
- Money management: Percentage-based position sizing for different account sizes
- Commission optimization: Considers trading costs for practical implementation
Strategy Risks
- Moving average lag may delay entries
- RSI oversold doesn't guarantee reversal
- Large position sizes may lead to significant drawdowns
- Frequent partial exits may increase trading costs These risks can be managed through parameter adjustments and additional filters.
Optimization Directions
- Add volume confirmation signals
- Incorporate trend strength indicators
- Optimize profit-taking ratios
- Add time-frame filters
- Consider volatility-adaptive position sizing
Summary
This strategy combines technical indicators with dynamic risk management to create a comprehensive trading system. Its strengths lie in adaptability and controlled risk, though parameter optimization based on market conditions is still necessary. The strategy is suitable for medium to long-term investors and serves as a solid foundation for systematic trading. [/trans]
Source (PineScript)
/*backtest
start: 2019-12-23 08:00:00
end: 2024-11-11 00:00:00
period: 1d
basePeriod: 1d
exchanges: [{"eid":"Futures_Binance","currency":"BTC_USDT"}]
*/

// This work is licensed under a Attribution-NonCommercial-ShareAlike 4.0 International (CC BY-NC-SA/4.0) https://creativecommons.org/licenses/by-nc-sa/4.0/
// © wielkieef

//@version=5
strategy("Simple RSI stock Strategy [1D] ", overlay=true, pyramiding=1, initial_capital=10000, default_qty_type=strategy.percent_of_equity, default_qty_value=75, calc_on_order_fills=false, slippage=0, commission_type=strategy.commission.percent, commission_value=0.03)

// Rsi
oversoldLevel = input(30, title="Oversold Level")
overboughtLevel = input(70, title="Overbought Level")
rsi = ta.rsi(close, 5)
rsi_overbought = rsi > overboughtLevel
rsi_oversold = rsi < oversoldLevel

// Sma 200
lenghtSMA = input(200, title = "SMA lenght")
sma200 = ta.sma(close, lenghtSMA)

// ATR stop-loss
atrLength = input.int(20, title="ATR Length")
atrMultiplier = input.float(1.5, title="ATR Multiplier")
atrValue = ta.atr(atrLength)
var float long_stop_level = na
var float short_stop_level = na
var float tp1_level = na
var float tp2_level = na
var float tp3_level = na

// Strategy entry
long = (rsi_oversold ) and close > sma200

// Take Profit levels
tp_1 = input.float(5.0, "TP 1", minval=0.1, step=0.1)
tp_2 = input.float(10.0, "TP 2", minval=0.2, step=0.1)
tp_3 = input.float(15.0, "TP 3", minval=0.3, step=0.1)

if long
    strategy.entry('Long', strategy.long)
    long_stop_level := close - atrMultiplier * atrValue
    tp1_level := strategy.position_avg_price * (1 + tp_1 / 100)
    tp2_level := strategy.position_avg_price * (1 + tp_2 / 100)
    tp3_level := strategy.position_avg_price * (1 + tp_3 / 100)

// basic SL - this code is from author RafaelZioni, modified by wielkieef
sl = input.float(25.0, 'Basic Stop Loss %', step=0.1)
per(procent) =>
    strategy.position_size != 0 ? math.round(procent / 100 * strategy.position_avg_price / syminfo.mintick) : float(na)

// ATR SL
if (strategy.position_size > 0 and (close <= long_stop_level))
    strategy.close("Long")
    tp1_level := na
    tp2_level := na
    tp3_level := na
plot(long_stop_level, color=color.orange, linewidth=2, title="Long Stop Loss")

// TP levels
if (strategy.position_size > 0)
    if (not na(tp1_level) and close >= tp1_level)
        tp1_level := na
    if (not na(tp2_level) and close >= tp2_level)
        tp2_level := na
    if (not na(tp3_level) and close >= tp3_level)
        tp3_level := na

plot(strategy.position_size > 0 and not na(tp1_level) ? tp1_level : na, color=color.gray, style=plot.style_circles , linewidth=1, title="Take Profit 1")
plot(strategy.position_size > 0 and not na(tp2_level) ? tp2_level : na, color=color.gray, style=plot.style_circles , linewidth=1, title="Take Profit 2")
plot(strategy.position_size > 0 and not na(tp3_level) ? tp3_level : na, color=color.gray, style=plot.style_circles , linewidth=1, title="Take Profit 3")

// Strategy exit points for Take Profits
strategy.exit('TP 1', from_entry="Long", qty_percent=33, profit=per(tp_1), loss=per(sl))
strategy.exit('TP 2', from_entry="Long", qty_percent=66, profit=per(tp_2), loss=per(sl))
strategy.exit('TP 3', from_entry="Long", qty_percent=100, profit=per(tp_3), loss=per(sl))

// by wielkieef
Detail
https://www.fmz.com/strategy/471673
Last Modified
2024-11-12 11:39:06