
16 KiB
Name
RSI与EMA双重过滤策略RSI-and-EMA-Dual-Filter-Strategy
Author
ChaoZhang
Strategy Description
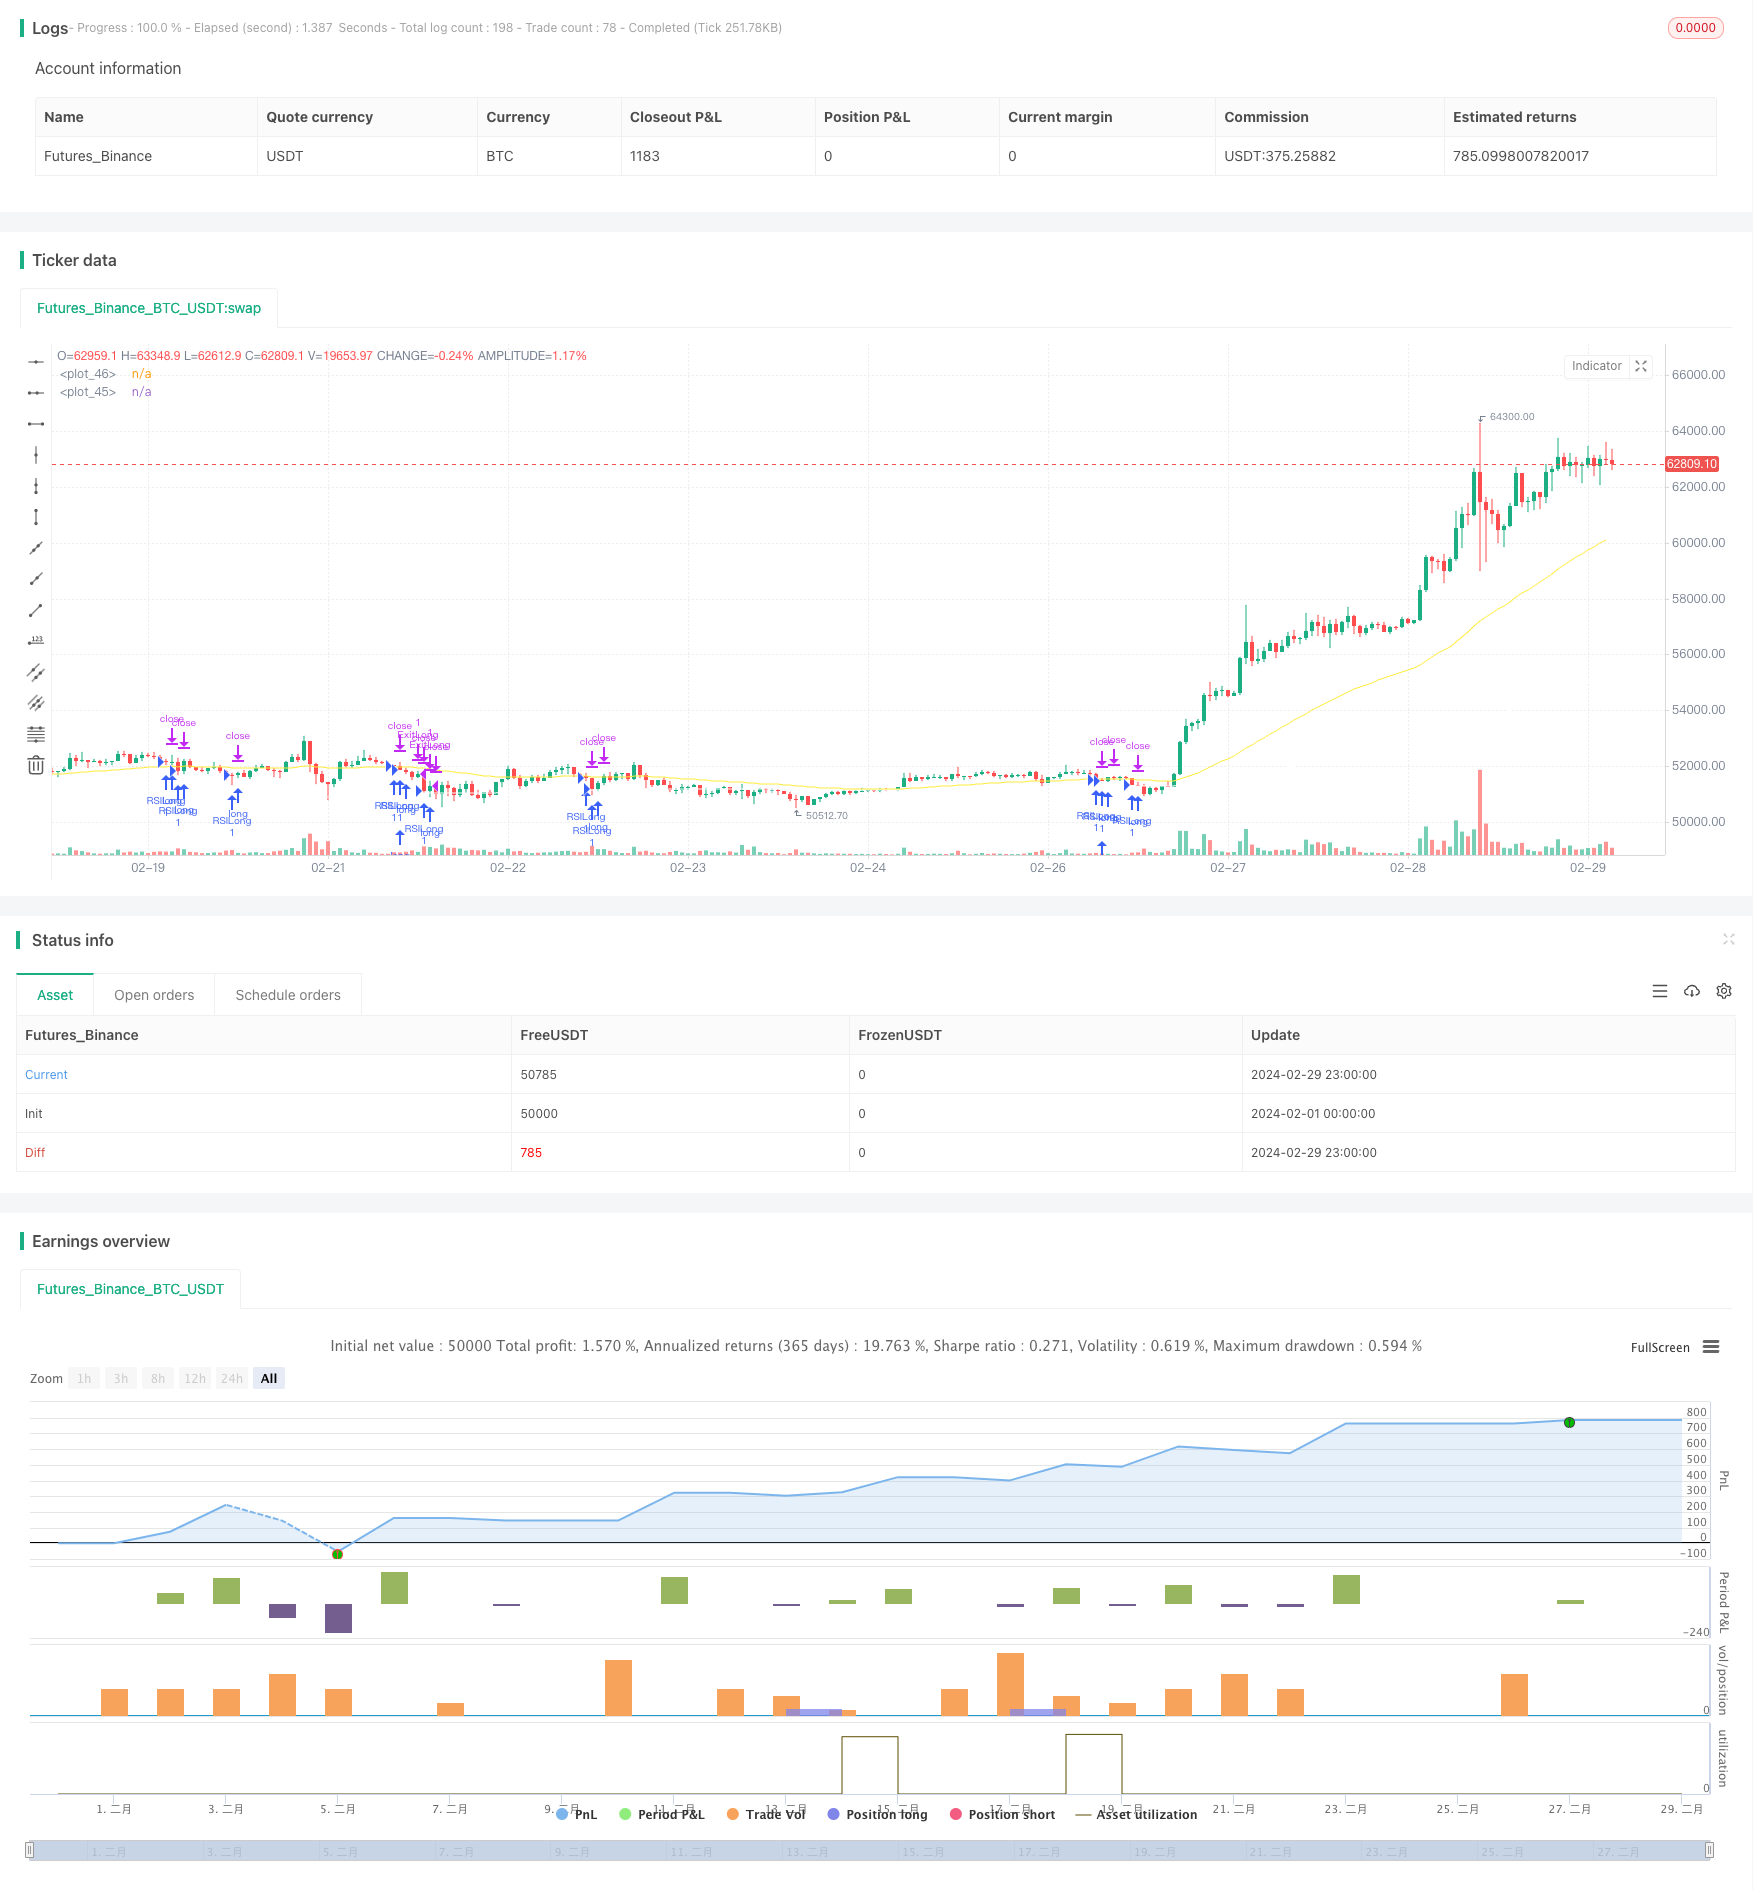 [trans]
概述
RSI与EMA双重过滤策略是一种基于相对强弱指标(RSI)和指数移动平均线(EMA)的量化交易策略。该策略利用RSI指标判断市场超买超卖情况,同时结合快慢两条EMA线的趋势判断,以此作为进场和出场的依据。通过RSI和EMA的双重过滤,可以有效降低假信号,提高策略的稳定性和盈利能力。
策略原理
该策略的核心原理可以分为以下几个部分:
-
RSI指标的计算和应用:策略首先计算了一个自定义周期(默认为2)的RSI指标。当RSI值低于超卖阈值(默认为10)时,表明市场处于超卖状态,可以考虑做多;当RSI值高于超买阈值(默认为90)时,表明市场处于超买状态,可以考虑做空。
-
快慢EMA线的趋势判断:策略计算了两条EMA线,一条是慢线(默认周期为200),一条是快线(默认周期为50)。当快线在慢线上方且价格在慢线上方时,认为市场处于上升趋势;反之,当快线在慢线下方且价格在慢线下方时,认为市场处于下降趋势。
-
趋势过滤:策略提供了一个趋势过滤的选项。如果开启该选项,那么只有在多头趋势下触发RSI超卖才会开多仓,在空头趋势下触发RSI超买才会开空仓。这样可以进一步降低逆势交易的风险。
-
交易信号的确认:策略综合考虑RSI指标和EMA趋势判断的结果,产生最终的交易信号。在多头趋势下,当RSI低于超卖阈值时,开多仓;在空头趋势下,当RSI高于超买阈值时,开空仓。
-
仓位管理:策略采用了最小交易间隔(默认为5分钟)来控制交易频率,避免过度交易。同时,策略使用了追踪止损和固定止损相结合的方式进行风险管理,既能让利润充分延续,又能有效控制损失。
优势分析
RSI与EMA双重过滤策略具有以下优势:
-
趋势跟踪能力强:通过快慢EMA线的趋势判断,策略可以有效把握市场的主要趋势,避免在震荡市中频繁交易。
-
有效过滤假信号:RSI指标容易产生较多的假信号,特别是在趋势不明确的市场中。而EMA趋势过滤可以有效识别主要趋势,降低RSI产生的假信号。
-
风险管理完善:策略采用了追踪止损和固定止损相结合的方式,既能让利润充分延续,又能有效控制损失。这种风险管理方式可以提高策略的稳定性和回撤控制能力。
-
参数灵活可调:策略提供了多个参数供使用者调整,如RSI周期、超买超卖阈值、EMA周期、止损比例等。这使得策略可以灵活适应不同的市场环境和交易习惯。
风险分析
尽管RSI与EMA双重过滤策略具有较好的优势,但仍然存在一些潜在的风险:
-
趋势转折风险:在市场趋势发生转折时,EMA线可能出现滞后,导致策略错过最佳的入场时机或者延迟出场。
-
参数优化风险:该策略的表现对参数设置较为敏感,不同参数组合可能带来完全不同的结果。如果参数优化过度,可能导致策略在未来市场中表现不佳。
-
黑天鹅事件风险:策略基于历史数据进行回测和优化,但历史数据无法完全反映未来可能发生的极端事件。一旦出现黑天鹅事件,策略可能遭受较大损失。
为了应对这些风险,可以考虑以下解决方法:
-
结合其他技术指标或者价格行为模式来辅助判断趋势转折,提早做出调整。
-
采用适度的参数优化,避免过度拟合历史数据。同时,定期进行参数复核和调整,适应最新的市场特征。
-
设置合理的止损位,控制单笔交易的最大损失。同时,在组合层面进行风险控制,如分散投资、仓位控制等。
优化方向
-
引入更多技术指标:在现有RSI和EMA指标的基础上,可以引入更多有效的技术指标,如MACD、布林带等,以提高策略的信号准确度和稳定性。
-
优化趋势判断方法:除了使用EMA线判断趋势外,还可以探索其他趋势判断方法,如高低点法、均线系统等。通过多种趋势判断方法的结合,可以提高策略的适应性。
-
改进风险管理方式:在现有的追踪止损和固定止损基础上,可以引入更加先进的风险管理方法,如波动性止损、动态止损等。这些方法可以更好地适应市场的波动性变化,从而更好地控制风险。
-
加入仓位管理模块:目前策略采用了固定仓位的方式,可以考虑引入动态仓位管理模块,根据市场波动性、账户权益等因素动态调整仓位,提高资金利用效率。
-
适应多个市场和品种:将策略扩展到更多的交易市场和品种,通过分散投资来降低整体风险。同时,可以研究不同市场和品种间的相关性,利用这些信息来优化策略的资产配置。
总结
RSI与EMA双重过滤策略通过相对强弱指标和指数移动平均线的有机结合,有效捕捉市场趋势,同时降低了RSI指标容易产生假信号的问题。策略逻辑清晰,包含了完善的风险管理措施,具有良好的稳定性和盈利潜力。但是,策略也存在一些潜在的风险,如趋势转折风险、参数优化风险和黑天鹅事件风险等。针对这些风险,我们提出了相应的应对措施和优化方向,如引入更多技术指标、优化趋势判断方法、改进风险管理方式、加入仓位管理模块以及扩展到多个市场和品种等。通过不断的优化和改进,相信该策略能够更好地适应未来的市场变化,为投资者带来稳定的收益。
||
Overview
The RSI and EMA Dual Filter Strategy is a quantitative trading strategy based on the Relative Strength Index (RSI) and Exponential Moving Average (EMA). The strategy uses the RSI indicator to determine overbought and oversold conditions in the market, while also incorporating the trend judgment of two EMA lines, fast and slow, as the basis for entry and exit. Through the dual filtering of RSI and EMA, the strategy can effectively reduce false signals and improve stability and profitability.
Strategy Principle
The core principles of this strategy can be divided into the following parts:
-
Calculation and application of the RSI indicator: The strategy first calculates an RSI indicator with a custom period (default is 2). When the RSI value is below the oversold threshold (default is 10), it indicates that the market is oversold, and a long position can be considered. When the RSI value is above the overbought threshold (default is 90), it indicates that the market is overbought, and a short position can be considered.
-
Trend judgment of fast and slow EMA lines: The strategy calculates two EMA lines, a slow line (default period is 200) and a fast line (default period is 50). When the fast line is above the slow line and the price is above the slow line, the market is considered to be in an uptrend. Conversely, when the fast line is below the slow line and the price is below the slow line, the market is considered to be in a downtrend.
-
Trend filter: The strategy provides an option for trend filtering. If this option is enabled, a long position will only be opened when the RSI is oversold in an uptrend, and a short position will only be opened when the RSI is overbought in a downtrend. This can further reduce the risk of counter-trend trading.
-
Confirmation of trading signals: The strategy comprehensively considers the results of the RSI indicator and EMA trend judgment to generate final trading signals. In an uptrend, when the RSI is below the oversold threshold, a long position is opened. In a downtrend, when the RSI is above the overbought threshold, a short position is opened.
-
Position management: The strategy uses a minimum trading interval (default is 5 minutes) to control the trading frequency and avoid excessive trading. At the same time, the strategy uses a combination of trailing stop loss and fixed stop loss for risk management, which allows profits to extend fully while effectively controlling losses.
Advantage Analysis
The RSI and EMA Dual Filter Strategy has the following advantages:
-
Strong trend-tracking ability: Through the trend judgment of fast and slow EMA lines, the strategy can effectively grasp the main trend of the market and avoid frequent trading in a range-bound market.
-
Effective filtering of false signals: The RSI indicator tends to generate many false signals, especially in markets with unclear trends. However, EMA trend filtering can effectively identify the main trend and reduce false signals generated by RSI.
-
Comprehensive risk management: The strategy uses a combination of trailing stop loss and fixed stop loss, which allows profits to extend fully while effectively controlling losses. This risk management approach can improve the stability and drawdown control ability of the strategy.
-
Flexible and adjustable parameters: The strategy provides multiple parameters for users to adjust, such as RSI period, overbought/oversold thresholds, EMA period, stop loss ratio, etc. This makes the strategy adaptable to different market environments and trading habits.
Risk Analysis
Despite the advantages of the RSI and EMA Dual Filter Strategy, there are still some potential risks:
-
Trend reversal risk: When the market trend reverses, EMA lines may lag, causing the strategy to miss the best entry point or delay the exit.
-
Parameter optimization risk: The performance of this strategy is sensitive to parameter settings, and different parameter combinations may bring completely different results. If the parameters are over-optimized, the strategy may perform poorly in future markets.
-
Black swan event risk: The strategy is based on historical data for backtesting and optimization, but historical data cannot fully reflect extreme events that may occur in the future. Once a black swan event occurs, the strategy may suffer significant losses.
To address these risks, the following solutions can be considered:
-
Combine other technical indicators or price behavior patterns to assist in judging trend reversals and make adjustments early.
-
Adopt moderate parameter optimization to avoid over-fitting historical data. At the same time, regularly review and adjust parameters to adapt to the latest market characteristics.
-
Set reasonable stop loss levels to control the maximum loss of a single trade. Additionally, implement risk control at the portfolio level, such as diversification and position sizing.
Optimization Direction
-
Introduce more technical indicators: In addition to the existing RSI and EMA indicators, more effective technical indicators can be introduced, such as MACD, Bollinger Bands, etc., to improve the signal accuracy and stability of the strategy.
-
Optimize trend judgment methods: In addition to using EMA lines to judge trends, other trend judgment methods can be explored, such as higher highs and higher lows, moving average systems, etc. By combining multiple trend judgment methods, the adaptability of the strategy can be improved.
-
Improve risk management methods: Based on the existing trailing stop loss and fixed stop loss, more advanced risk management methods can be introduced, such as volatility stop loss, dynamic stop loss, etc. These methods can better adapt to changes in market volatility and thus better control risks.
-
Add position management module: Currently, the strategy adopts a fixed position size approach. A dynamic position management module can be considered to dynamically adjust positions based on factors such as market volatility and account equity, thus improving capital utilization efficiency.
-
Adapt to multiple markets and varieties: Expand the strategy to more trading markets and varieties, and reduce overall risk through diversification. At the same time, study the correlation between different markets and varieties, and use this information to optimize the asset allocation of the strategy.
Summary
The RSI and EMA Dual Filter Strategy effectively captures market trends while reducing the problem of false signals easily generated by the RSI indicator through the organic combination of the Relative Strength Index and Exponential Moving Average. The strategy logic is clear and includes comprehensive risk management measures, with good stability and profit potential. However, the strategy also has some potential risks, such as trend reversal risk, parameter optimization risk, and black swan event risk. To address these risks, we have proposed corresponding countermeasures and optimization directions, such as introducing more technical indicators, optimizing trend judgment methods, improving risk management methods, adding position management modules, and expanding to multiple markets and varieties. Through continuous optimization and improvement, we believe that the strategy can better adapt to future market changes and bring stable returns for investors.
[/trans]
Strategy Arguments
| Argument | Default | Description |
|---|---|---|
| v_input_1 | 2 | RSILength |
| v_input_2 | 90 | Threshold RSI up |
| v_input_3 | 10 | Threshold RSI down |
| v_input_4 | 200 | Slow MA len |
| v_input_5 | 50 | Fast MA len |
| v_input_6 | 0 | machoice: EMA |
| v_input_7 | 0.5 | Ticker size |
| v_input_8 | true | Trend Filter |
| v_input_9 | true | TrailingStop% |
| v_input_10 | 0.3 | Stop Loss % |
Source (PineScript)
/*backtest
start: 2024-02-01 00:00:00
end: 2024-02-29 23:59:59
period: 1h
basePeriod: 15m
exchanges: [{"eid":"Futures_Binance","currency":"BTC_USDT"}]
*/

//@version=4
strategy("RSI2", overlay=true)

// RSILength input
len = input(2, minval=1, title="RSILength")

// Threshold RSI up input
RSIthreshUP = input(90, title="Threshold RSI up")

// Threshold RSI down input
RSIthreshDWN = input(10, title="Threshold RSI down")

// Slow MA length input
mmlen = input(200, title="Slow MA len")

// Fast MA length input
mmflen = input(50, title="Fast MA len")

// Moving Average type input
machoice = input("EMA", defval="EMA", options=["SMA", "EMA"])

// Ticker size input
tick=input(0.5,title="Ticker size",type=input.float)

// Trend Filter input
filter=input(true,title="Trend Filter",type=input.bool)

// Trailing Stop percentage input
ts_percent = input(1, title="TrailingStop%")

// Stop Loss percentage input
sl_percent = input(0.3, title="Stop Loss %")

// Calculate RSI
src = close
up = rma(max(change(src), 0), len)
down = rma(-min(change(src), 0), len)
rsi = down == 0 ? 100 : up == 0 ? 0 : 100 - 100 / (1 + up / down)

// Calculate moving averages
mmslow = machoice == "SMA" ? sma(close, mmlen) : ema(close, mmlen)
mmfast = machoice == "SMA" ? sma(close, mmflen) : ema(close, mmflen)

// Plot moving averages
plot(mmslow, color=color.white)
plot(mmfast, color=color.yellow)

// Conditions for entry and exit
var lastLongEntryTime = 0
var lastShortEntryTime = 0

ConditionEntryL = if filter == true
    mmfast > mmslow and close > mmslow and rsi < RSIthreshDWN
else
    mmfast > mmslow and rsi < RSIthreshDWN

ConditionEntryS = if filter == true
    mmfast < mmslow and close < mmslow and rsi > RSIthreshUP
else
    mmfast < mmslow and rsi > RSIthreshUP

// Calculate trailing stop and stop loss
ts_calc = close * (1/tick) * ts_percent * 0.01
sl_price = close * (1 - sl_percent / 100)

// Entry and exit management
if ConditionEntryL and time - lastLongEntryTime > 1000 * 60 * 5 // 5 minutes
    strategy.entry("RSILong", strategy.long)
    lastLongEntryTime := time

if ConditionEntryS and time - lastShortEntryTime > 1000 * 60 * 5 // 5 minutes
    strategy.entry("RSIShort", strategy.short)
    lastShortEntryTime := time

lastLongEntryTimeExpired = time - lastLongEntryTime >= 1000 * 60 * 5
lastShortEntryTimeExpired = time - lastShortEntryTime >= 1000 * 60 * 5

strategy.exit("ExitLong", "RSILong", when=lastLongEntryTimeExpired, trail_points=0, trail_offset=ts_calc, stop=sl_price)
strategy.exit("ExitShort", "RSIShort", when=lastShortEntryTimeExpired, trail_points=0, trail_offset=ts_calc, stop=sl_price)
Detail
https://www.fmz.com/strategy/445832
Last Modified
2024-03-22 15:37:08