
9.9 KiB
Name
Pivot-and-Momentum-Strategy-枢轴动量策略
Author
ChaoZhang
Strategy Description
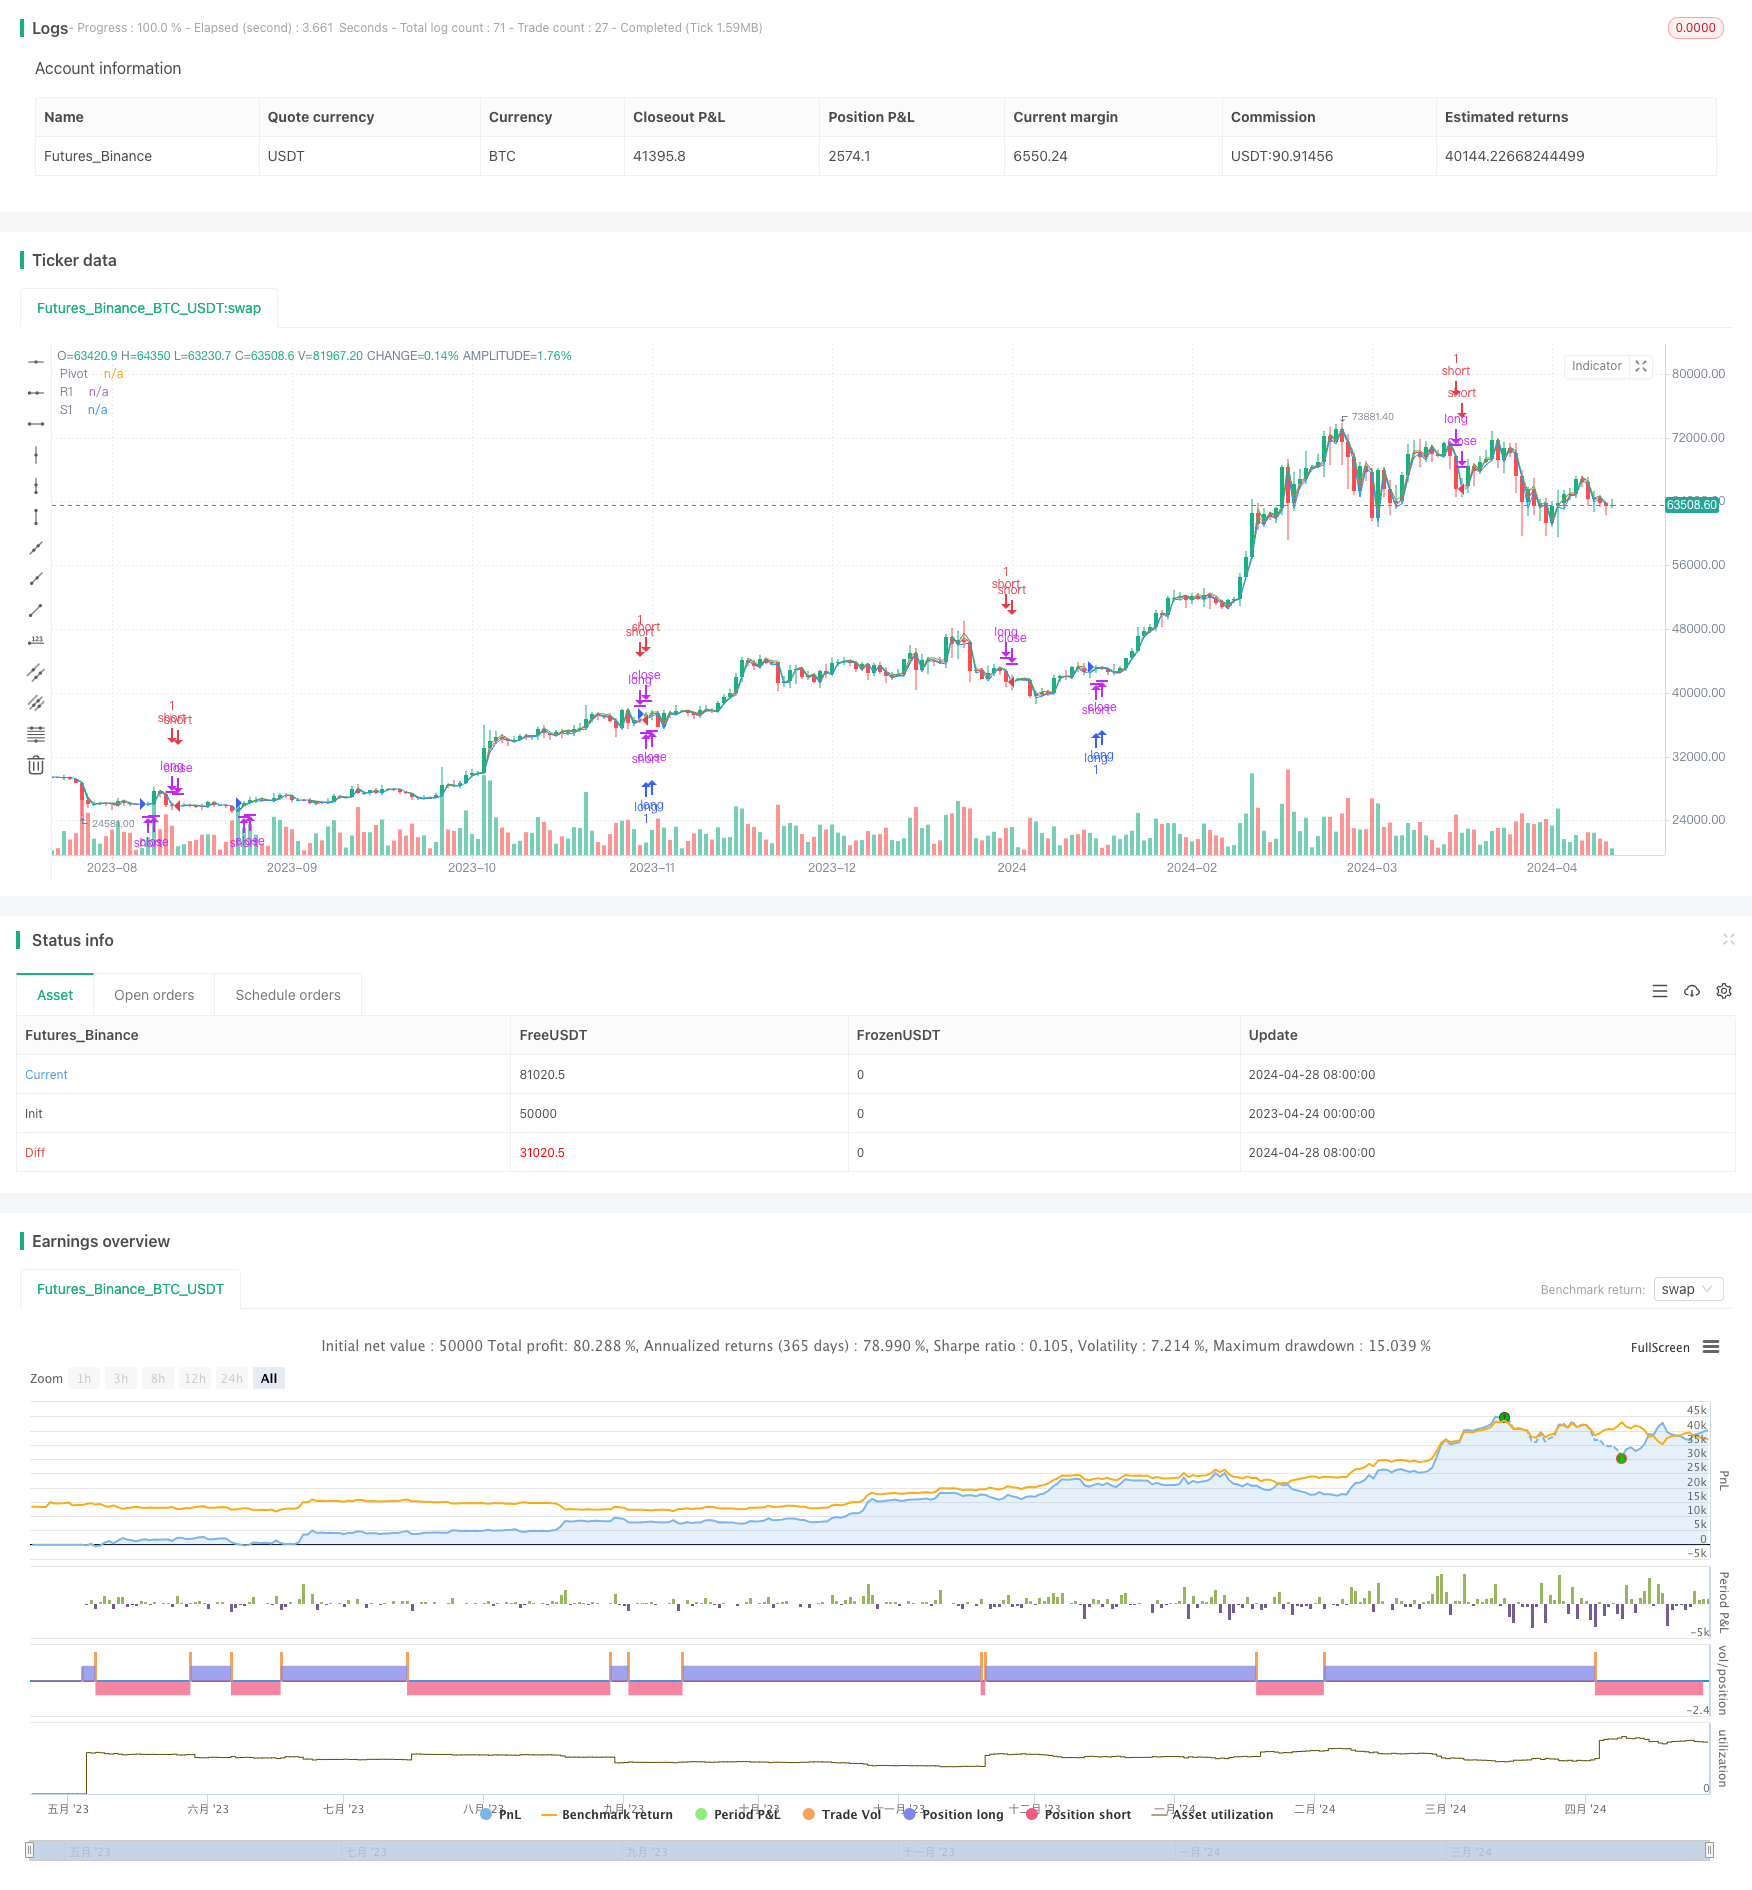
[trans]
概述
枢轴动量策略是一种结合枢轴点和动量指标的交易方法。该策略利用前一交易周期的最高价、最低价和收盘价计算枢轴点,并使用动量指标如ROC(变化率)和随机RSI来判断市场趋势。当价格突破枢轴点且动量指标确认时,策略将开仓;反之,当价格跌破枢轴点且动量指标确认时,策略将平仓。该策略旨在捕捉市场趋势,同时控制风险。
策略原理
该策略的核心是枢轴点和动量指标的结合。枢轴点通过前一交易周期的最高价、最低价和收盘价计算得出,代表了市场的重要支撑位和阻力位。当价格突破枢轴点时,意味着市场趋势可能发生变化。
同时,该策略采用了ROC和随机RSI两个动量指标来确认趋势。ROC衡量价格变化的速度,当ROC大于0时,表明价格处于上升趋势;当ROC小于0时,表明价格处于下降趋势。随机RSI则通过比较RSI在一定周期内的位置来判断市场是处于超买还是超卖状态。
当价格突破枢轴点,且ROC和随机RSI同时确认趋势时,策略将开仓;当价格跌破枢轴点,且ROC和随机RSI同时确认趋势时,策略将平仓。这种多重条件的结合可以有效过滤掉虚假信号,提高策略的胜率。
策略优势
-
趋势跟踪:通过枢轴点和动量指标的结合,该策略可以有效捕捉市场趋势,在趋势形成初期就进场,最大化利润空间。
-
风险控制:该策略采用多重条件来过滤交易信号,减少了虚假信号的出现,从而降低了交易风险。同时,通过设置止损位,策略可以有效控制单笔交易的最大亏损。
-
适应性强:该策略可以应用于多个时间周期和不同的市场,通过调整参数,可以适应不同的市场特点和交易风格。
策略风险
-
参数优化:该策略包含多个参数,如枢轴点的计算方式、动量指标的周期等,不同的参数设置可能导致策略表现差异较大。因此,需要对参数进行优化和测试,以找到最佳的参数组合。
-
市场风险:该策略主要适用于趋势明显的市场,在震荡市中可能表现不佳。同时,如果市场出现剧烈波动或异常事件,策略可能会出现较大回撤。
-
过拟合风险:如果在参数优化过程中过度拟合历史数据,策略在实际交易中可能表现不佳。因此,需要通过样本外测试和实际交易来验证策略的有效性。
策略优化方向
-
动态调整参数:可以根据市场情况动态调整策略参数,如在震荡市中减小动量指标的周期,以适应市场节奏的变化。
-
加入其他过滤条件:可以考虑加入其他技术指标或基本面因素作为过滤条件,如交易量、市场情绪等,以进一步提高信号的可靠性。
-
风险管理优化:可以通过优化仓位管理和止损止盈规则,来改善策略的风险收益特性,如采用ATR(平均真实波幅)来设置动态止损位。
总结
枢轴动量策略通过结合枢轴点和动量指标,以趋势跟踪为核心,同时注重风险控制。该策略适用于多个市场和时间周期,通过优化参数和加入其他过滤条件,可以进一步提高策略的稳定性和盈利能力。在实际应用中,需要注意市场风险和过拟合风险,并通过持续的优化和监控来保证策略的有效性。
||
Overview
The Pivot and Momentum Strategy is a trading approach that combines pivot points and momentum indicators. The strategy utilizes the previous trading period's high, low, and close prices to calculate pivot points and employs momentum indicators such as ROC (Rate of Change) and Stochastic RSI to determine market trends. When the price breaks above the pivot point and momentum indicators confirm, the strategy will open a position; conversely, when the price breaks below the pivot point and momentum indicators confirm, the strategy will close the position. The strategy aims to capture market trends while controlling risk.
Strategy Principle
The core of this strategy is the combination of pivot points and momentum indicators. Pivot points are calculated using the previous trading period's high, low, and close prices, representing important support and resistance levels in the market. When the price breaks through the pivot point, it indicates that the market trend may be changing.
At the same time, the strategy employs two momentum indicators, ROC and Stochastic RSI, to confirm trends. ROC measures the speed of price change; when ROC is greater than 0, it indicates an upward trend; when ROC is less than 0, it indicates a downward trend. Stochastic RSI determines whether the market is overbought or oversold by comparing the position of RSI over a certain period.
When the price breaks above the pivot point and both ROC and Stochastic RSI confirm the trend, the strategy will open a position; when the price breaks below the pivot point and both ROC and Stochastic RSI confirm the trend, the strategy will close the position. This combination of multiple conditions can effectively filter out false signals and improve the strategy's win rate.
Strategy Advantages
-
Trend tracking: By combining pivot points and momentum indicators, the strategy can effectively capture market trends and enter positions early in trend formation, maximizing profit potential.
-
Risk control: The strategy employs multiple conditions to filter trading signals, reducing the occurrence of false signals and thus lowering trading risk. At the same time, by setting stop-loss levels, the strategy can effectively control the maximum loss of a single trade.
-
High adaptability: The strategy can be applied to multiple time frames and different markets. By adjusting parameters, it can adapt to different market characteristics and trading styles.
Strategy Risks
-
Parameter optimization: The strategy includes multiple parameters, such as the calculation method of pivot points and the period of momentum indicators. Different parameter settings may lead to significant differences in strategy performance. Therefore, parameters need to be optimized and tested to find the best combination.
-
Market risk: The strategy is mainly suitable for markets with clear trends and may not perform well in choppy markets. At the same time, if the market experiences severe volatility or abnormal events, the strategy may suffer significant drawdowns.
-
Overfitting risk: If the strategy is overly fitted to historical data during the parameter optimization process, it may not perform well in actual trading. Therefore, it is necessary to verify the effectiveness of the strategy through out-of-sample testing and actual trading.
Strategy Optimization Direction
-
Dynamic parameter adjustment: Strategy parameters can be dynamically adjusted according to market conditions. For example, in choppy markets, the period of momentum indicators can be reduced to adapt to changes in market rhythm.
-
Adding other filtering conditions: Other technical indicators or fundamental factors can be considered as additional filtering conditions, such as trading volume and market sentiment, to further improve the reliability of signals.
-
Risk management optimization: The strategy's risk-return characteristics can be improved by optimizing position management and stop-loss/take-profit rules. For example, using ATR (Average True Range) to set dynamic stop-loss levels.
Summary
The Pivot and Momentum Strategy combines pivot points and momentum indicators, focusing on trend tracking while emphasizing risk control. The strategy is applicable to multiple markets and time frames. By optimizing parameters and adding other filtering conditions, the strategy's stability and profitability can be further improved. In practical application, attention should be paid to market risk and overfitting risk, and the effectiveness of the strategy should be ensured through continuous optimization and monitoring. [/trans]
Strategy Arguments
| Argument | Default | Description |
|---|---|---|
| v_input_1 | 3 | Stochastic RSI Smooth K |
| v_input_2 | 3 | Stochastic RSI Smooth D |
| v_input_3 | 14 | RSI Length |
| v_input_4 | 14 | Stochastic Length |
| v_input_5 | 9 | ROC Length |
Source (PineScript)
/*backtest
start: 2023-04-24 00:00:00
end: 2024-04-29 00:00:00
period: 1d
basePeriod: 1h
exchanges: [{"eid":"Futures_Binance","currency":"BTC_USDT"}]
*/

//@version=5
strategy("Pivot and Momentum", overlay=true)
//systemedic

// Pivot Hesaplama
highPrev = request.security(syminfo.tickerid, "60", high[1])
lowPrev = request.security(syminfo.tickerid, "60", low[1])
closePrev = request.security(syminfo.tickerid, "60", close[1])

pivotPoint = (highPrev + lowPrev + closePrev) / 3
R1 = 2 * pivotPoint - lowPrev
S1 = 2 * pivotPoint - highPrev

// Stochastic RSI
smoothK = input(3, "Stochastic RSI Smooth K")
smoothD = input(3, "Stochastic RSI Smooth D")
lengthRSI = input(14, "RSI Length")
lengthStoch = input(14, "Stochastic Length")
rsi = ta.rsi(close, lengthRSI)
k = ta.sma(ta.stoch(rsi, rsi, rsi, lengthStoch), smoothK)
d = ta.sma(k, smoothD)

// ROC
rocLength = input(9, "ROC Length")
roc = ta.roc(close, rocLength)

// Alım ve Satım Koşulları
longCondition = close > pivotPoint and ta.crossover(k, d) and roc > 0
shortCondition = close < pivotPoint and ta.crossunder(k, d) and roc < 0

// Pozisyon Kontrolü ve İşlem
if (longCondition)
    strategy.close("short") // Mevcut short pozisyonunu kapat
    strategy.entry("long", strategy.long, comment="Long Pozisyonu")

if (shortCondition)
    strategy.close("long") // Mevcut long pozisyonunu kapat
    strategy.entry("short", strategy.short, comment="Short Pozisyonu")

// Pivot ve Seviyeleri Çiz
plot(pivotPoint, "Pivot", color=color.red)
plot(R1, "R1", color=color.green)
plot(S1, "S1", color=color.blue)
Detail
https://www.fmz.com/strategy/449957
Last Modified
2024-04-30 16:39:30