
3.5 KiB
Name
Pivot-Points-High-Low-Multi-Time-Frame
Author
ChaoZhang
Strategy Description
Hello All,
There are built-in and published Pivot Point High Low indicators in Public Library but as far as I see none of them is for Higher Time frames. so I decided to write & publish this script. I hope it would be useful while trading or developing your own scripts. I also did this to use in one of my future projects (we will see it in a few weeks/months ;)).
I tried to make all settings optional, so you can play with them as you wish.
P.S. There is no control mechanism if the chart time frame is lower than the time frame in the options. So you better set higher time frame in the options than the chart time frame.
Enjoy!
backtest
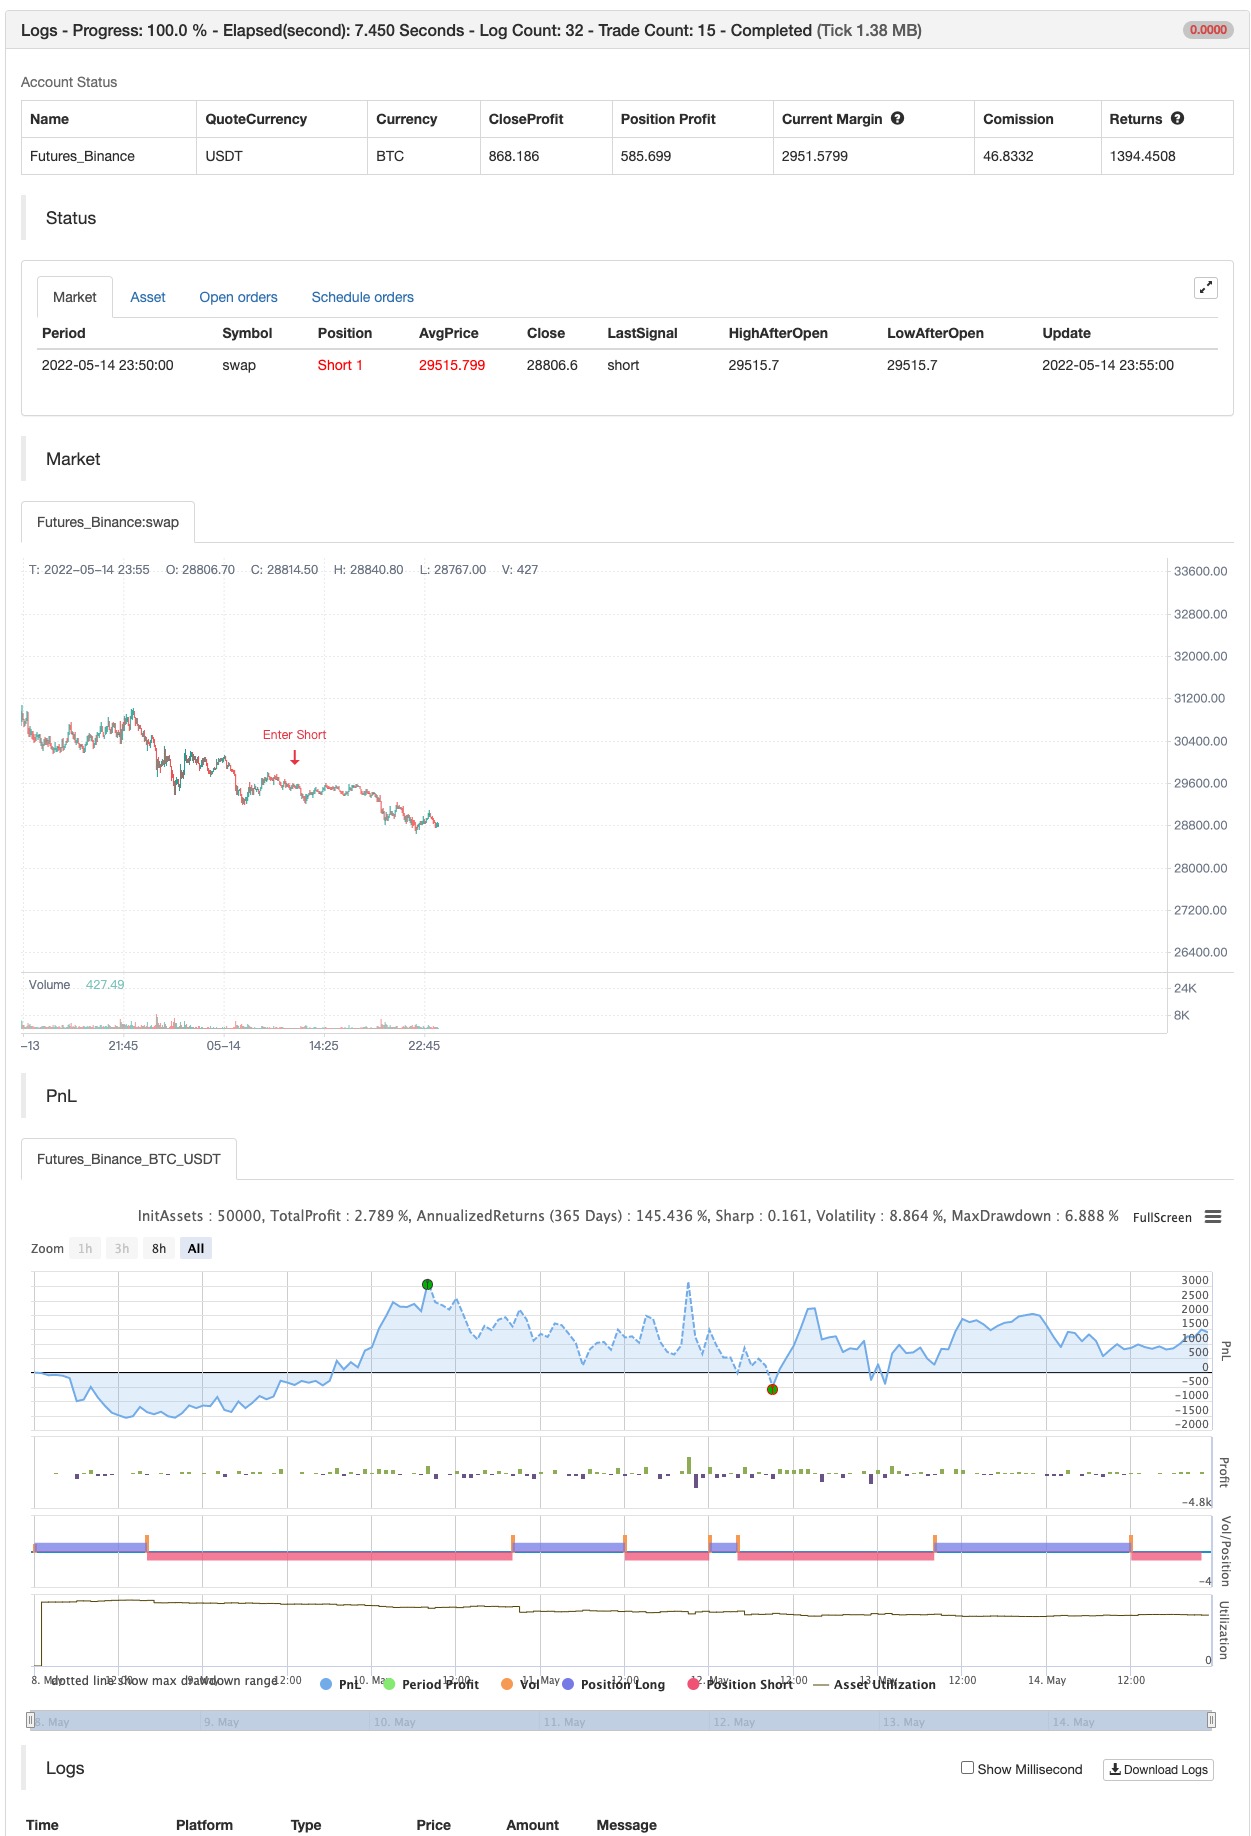
Strategy Arguments
| Argument | Default | Description |
|---|---|---|
| v_input_timeframe_1 | 240 | timeframe |
| v_input_int_1 | 2 | Left Bars |
| v_input_int_2 | 2 | Right Bars |
| v_input_1 | lime | Pivot High/Low Line Colors |
| v_input_2 | red | pllinecol |
| v_input_3 | lime | Pivot High BG/Text Colors |
| v_input_4 | black | phtextcol |
| v_input_5 | red | Pivot Low BG/Text Colors |
| v_input_6 | white | pltextcol |
Source (PineScript)
/*backtest
start: 2022-05-08 00:00:00
end: 2022-05-14 23:59:00
period: 5m
basePeriod: 1m
exchanges: [{"eid":"Futures_Binance","currency":"BTC_USDT"}]
*/

// This source code is subject to the terms of the Mozilla Public License 2.0 at https://mozilla.org/MPL/2.0/
// © LonesomeTheBlue

//@version=5
indicator("Pivot Points High Low Multi Time Frame", overlay = true, max_lines_count = 500, max_labels_count = 500)
timeframe = input.timeframe(defval = '240')
leftBars  = input.int(defval = 2, title = "Left Bars", minval = 1)
rightBars  = input.int(defval = 2, title = "Right Bars", minval = 1)
phlinecol = input(defval = color.lime, title = "Pivot High/Low Line Colors", inline = "lc")
pllinecol = input(defval = color.red, title = "", inline = "lc")
phbgcol = input(defval = color.lime, title = "Pivot High BG/Text Colors", inline = "ph")
phtextcol = input(defval = color.black, title = "", inline = "ph")
plbgcol = input(defval = color.red, title = "Pivot Low BG/Text Colors", inline = "pl")
pltextcol = input(defval = color.white, title = "", inline = "pl")

get_phpl()=>
    float ph = ta.pivothigh(leftBars, rightBars)
    float pl = ta.pivotlow(leftBars, rightBars)
    phtimestart = ph ? time[rightBars] : na
    phtimeend = ph ? time[rightBars - 1] : na
    pltimestart = pl ? time[rightBars] : na
    pltimeend = pl ? time[rightBars - 1] : na

    [ph, phtimestart, phtimeend, pl, pltimestart, pltimeend]

// get if there if Pivot High/low and their start/end times
[ph, phtimestart, phtimeend, pl, pltimestart, pltimeend] = request.security(syminfo.tickerid, timeframe, get_phpl(), lookahead = barmerge.lookahead_on)

// keep time of each bars, this is used for lines/labels
var mytime = array.new_int(0)
array.unshift(mytime, time)

// calculate end of the line/time for pivot high/low
bhend = array.get(mytime, math.min(array.indexof(mytime, phtimeend) + 1, array.size(mytime) - 1))
blend = array.get(mytime, math.min(array.indexof(mytime, pltimeend) + 1, array.size(mytime) - 1))

// to draw once
float pivothigh = na(ph[1]) and ph ? ph : na
float pivotlow  = na(pl[1]) and pl ? pl : na


if not na(pivothigh)
    strategy.entry("Enter Long", strategy.long)
else if not na(pivotlow)
    strategy.entry("Enter Short", strategy.short)
Detail
https://www.fmz.com/strategy/363557
Last Modified
2022-05-16 15:20:30