
6.4 KiB
Name
Multi-SMA均线交叉策略Multi-SMA-Moving-Average-Crossover-Strategy
Author
ChaoZhang
Strategy Description
[trans]
概述
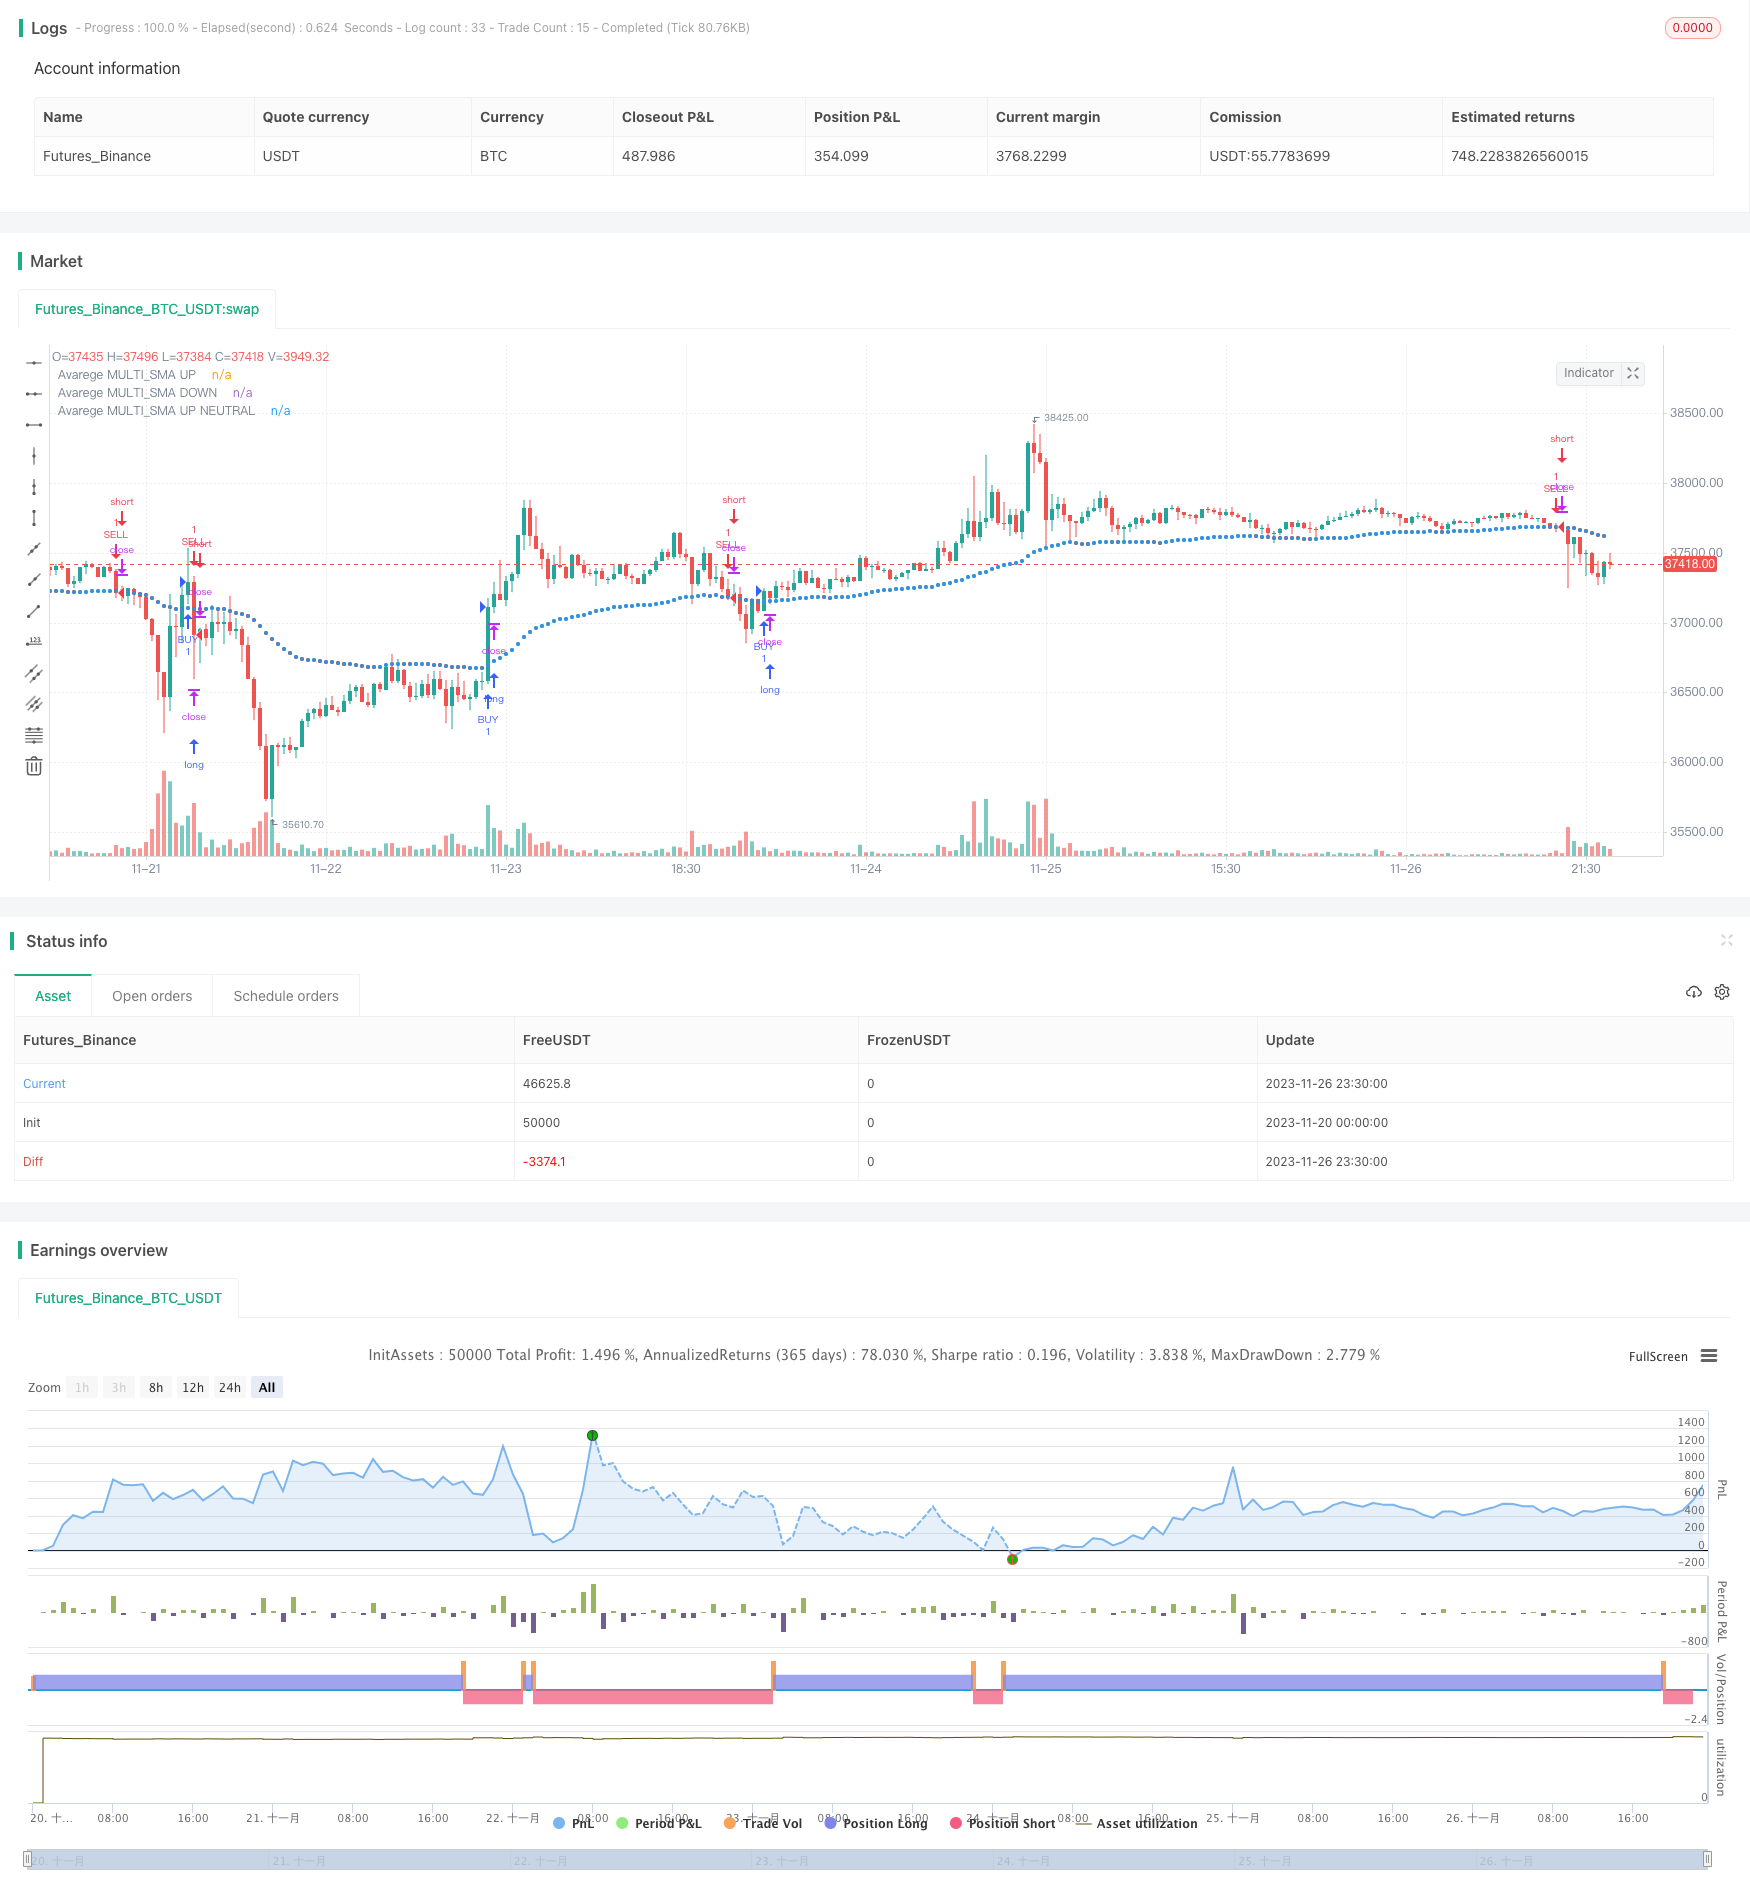
该策略通过计算多时间段的SMA均线,并取平均值构建均线指标。当价格上涨突破均线时产生买入信号,当价格下跌突破均线时产生卖出信号,属于典型的均线交叉策略。
策略原理
- 计算5个不同周期(8日,21日,50日,100日,200日)的SMA均线
- 将5条均线值取平均,得到最终的均线指标
- 当收盘价上涨突破均线时,产生买入信号
- 当收盘价下跌突破均线时,产生卖出信号
该策略通过多时间段SMA的平均,能够有效平滑曲线,滤除假突破。与单一均线相比,具有更高的稳定性。
优势分析
- 使用多时间段均线能够有效滤除市场噪音,识别趋势
- 平滑曲线,避免产生大量假信号
- 策略逻辑简单清晰,容易理解实现,适合新手学习
- 可自定义均线周期组合,优化指标效果
风险分析
- 均线系统整体滞后,无法及时跟踪价格变化
- 突破失效时,停损点较远,亏损风险大
- 震荡趋势中,止损线被频繁触发
可以通过适当缩短部分均线周期,以及加入其他指标确认,来减小这些风险。
优化方向
- 优化均线周期组合,找到最佳参数
- 加入成交量等指标确认突破信号
- 结合趋势指标,避免震荡市场的虚假信号
- 开发自动参数优化程序,动态寻找最优参数
总结
该策略总体思路清晰,通过多时间段均线的集成,能够有效识别趋势,是一个稳定实用的策略。但我们也需要注意到其滞后性以及误报风险。通过进一步优化参数设定、加入确认指标等手段,可以持续改进该策略,使其成为一个强大的量化交易工具。
||
Overview
This strategy calculates the SMA moving averages of multiple timeframes and takes the average value to construct the moving average indicator. It generates buy signals when prices rise above the moving average and sell signals when prices fall below the moving average. This is a typical moving average crossover strategy.
Strategy Principle
- Calculate 5 SMA moving averages of different periods (8-day, 21-day, 50-day, 100-day, 200-day)
- Take the average of the 5 moving averages to get the final moving average indicator
- Generate buy signals when closing prices rise above the moving average
- Generate sell signals when closing prices fall below the moving average
By averaging the SMAs of multiple timeframes, this strategy can effectively smooth the curve and filter out false breakouts. Compared with a single moving average, it has higher stability.
Advantage Analysis
- Using multiple timeframe moving averages can effectively filter market noise and identify trends
- Smooth curve, avoid generating too many false signals
- The strategy logic is simple and clear, easy to understand and implement, suitable for beginners to learn
- Customizable moving average period combination to optimize indicator effect
Risk Analysis
- The moving average system lags as a whole and cannot keep up with price changes in time
- When breakout failure occurs, the stop loss point is far away, with greater risk of loss
- Stop loss lines are frequently triggered in oscillating trends
These risks can be reduced by appropriately shortening some moving average periods and adding other indicators for confirmation.
Optimization Directions
- Optimize the combinations of moving average periods to find the best parameters
- Add indicators like trading volume to confirm breakout signals
- Incorporate trend indicators to avoid false signals in oscillating markets
- Develop automatic parameter optimization programs to dynamically find the optimal parameters
Summary
The overall idea of this strategy is clear. By integrating the moving averages of multiple timeframes, it can effectively identify trends and is a stable and practical strategy. However, we also need to pay attention to its lag and false signal risks. Through further optimizing parameter settings, adding confirmation indicators, etc., we can continuously improve this strategy to make it a powerful quantitative trading tool.
[/trans]
Strategy Arguments
| Argument | Default | Description |
|---|---|---|
| v_input_1 | 8 | SMA 1 |
| v_input_2 | 21 | SMA 2 |
| v_input_3 | 50 | SMA 3 |
| v_input_4 | 100 | SMA 4 |
| v_input_5 | 200 | SMA 5 |
Source (PineScript)
/*backtest
start: 2023-11-20 00:00:00
end: 2023-11-27 00:00:00
period: 30m
basePeriod: 15m
exchanges: [{"eid":"Futures_Binance","currency":"BTC_USDT"}]
*/

//@version=3
strategy("STRATEGY AVERAGE MULTI_SMA", overlay=true)


sma1 = sma(close,input(title="SMA 1", defval=8))

sma2 = sma(close,input(title="SMA 2", defval=21))

sma3 = sma(close,input(title="SMA 3", defval=50))

sma4 = sma(close,input(title="SMA 4", defval=100))

sma5 = sma(close,input(title="SMA 5", defval=200))


mediaSMA= (sma1+sma2+sma3+sma4+sma5)/5

//color mediaSMA

MediaUP = mediaSMA>mediaSMA[1]
colorUP = (MediaUP ? #3CFF35 : na)

MediaDOWN = mediaSMA<mediaSMA[1]
colorDOWN =(MediaDOWN ? #FF0F03 : na)

colorN =(not MediaUP and not MediaDOWN and mediaSMA==mediaSMA[1] ? white : na )

plot(mediaSMA,title="Avarege MULTI_SMA UP", color=colorUP, style=circles, linewidth=2, transp=0)
plot(mediaSMA,title="Avarege MULTI_SMA DOWN", color=colorDOWN, style=circles, linewidth=2, transp=0)
plot(mediaSMA,title="Avarege MULTI_SMA UP NEUTRAL", color=colorN, style=circles, linewidth=2, transp=0)


//plot(sma1,color=blue,linewidth=1, style=line,transp=0,title="SMA 1")
//plot(sma2,color=yellow,linewidth=1, style=line,transp=0,title="SMA 2")
//plot(sma3,color=green,linewidth=1, style=line,transp=0,title="SMA 3")
//plot(sma4,color=purple,linewidth=1, style=line,transp=0,title="SMA 4")
//plot(sma5,color=red,linewidth=1, style=line,transp=0,title="SMA 5")


// Strategy

//BUY
comprar=close>mediaSMA and mediaSMA>mediaSMA[1]
fechar=close<mediaSMA and mediaSMA<mediaSMA[1]

strategy.entry("BUY",strategy.long,when=comprar)
strategy.entry("SELL",strategy.short, when=fechar)

//SELL
vender=close<mediaSMA and mediaSMA<mediaSMA[1]
fechar2=close>mediaSMA and mediaSMA>mediaSMA[1]

strategy.entry("SELL",strategy.short, when=vender)
strategy.entry("BUY", strategy.long,when=fechar2)
Detail
https://www.fmz.com/strategy/433560
Last Modified
2023-11-28 15:08:37