
20 KiB
Name
Magic-Channel-Price-Action-Trading-Strategy-魔法通道价格行为交易策略
Author
ChaoZhang
Strategy Description
 [trans]
概述
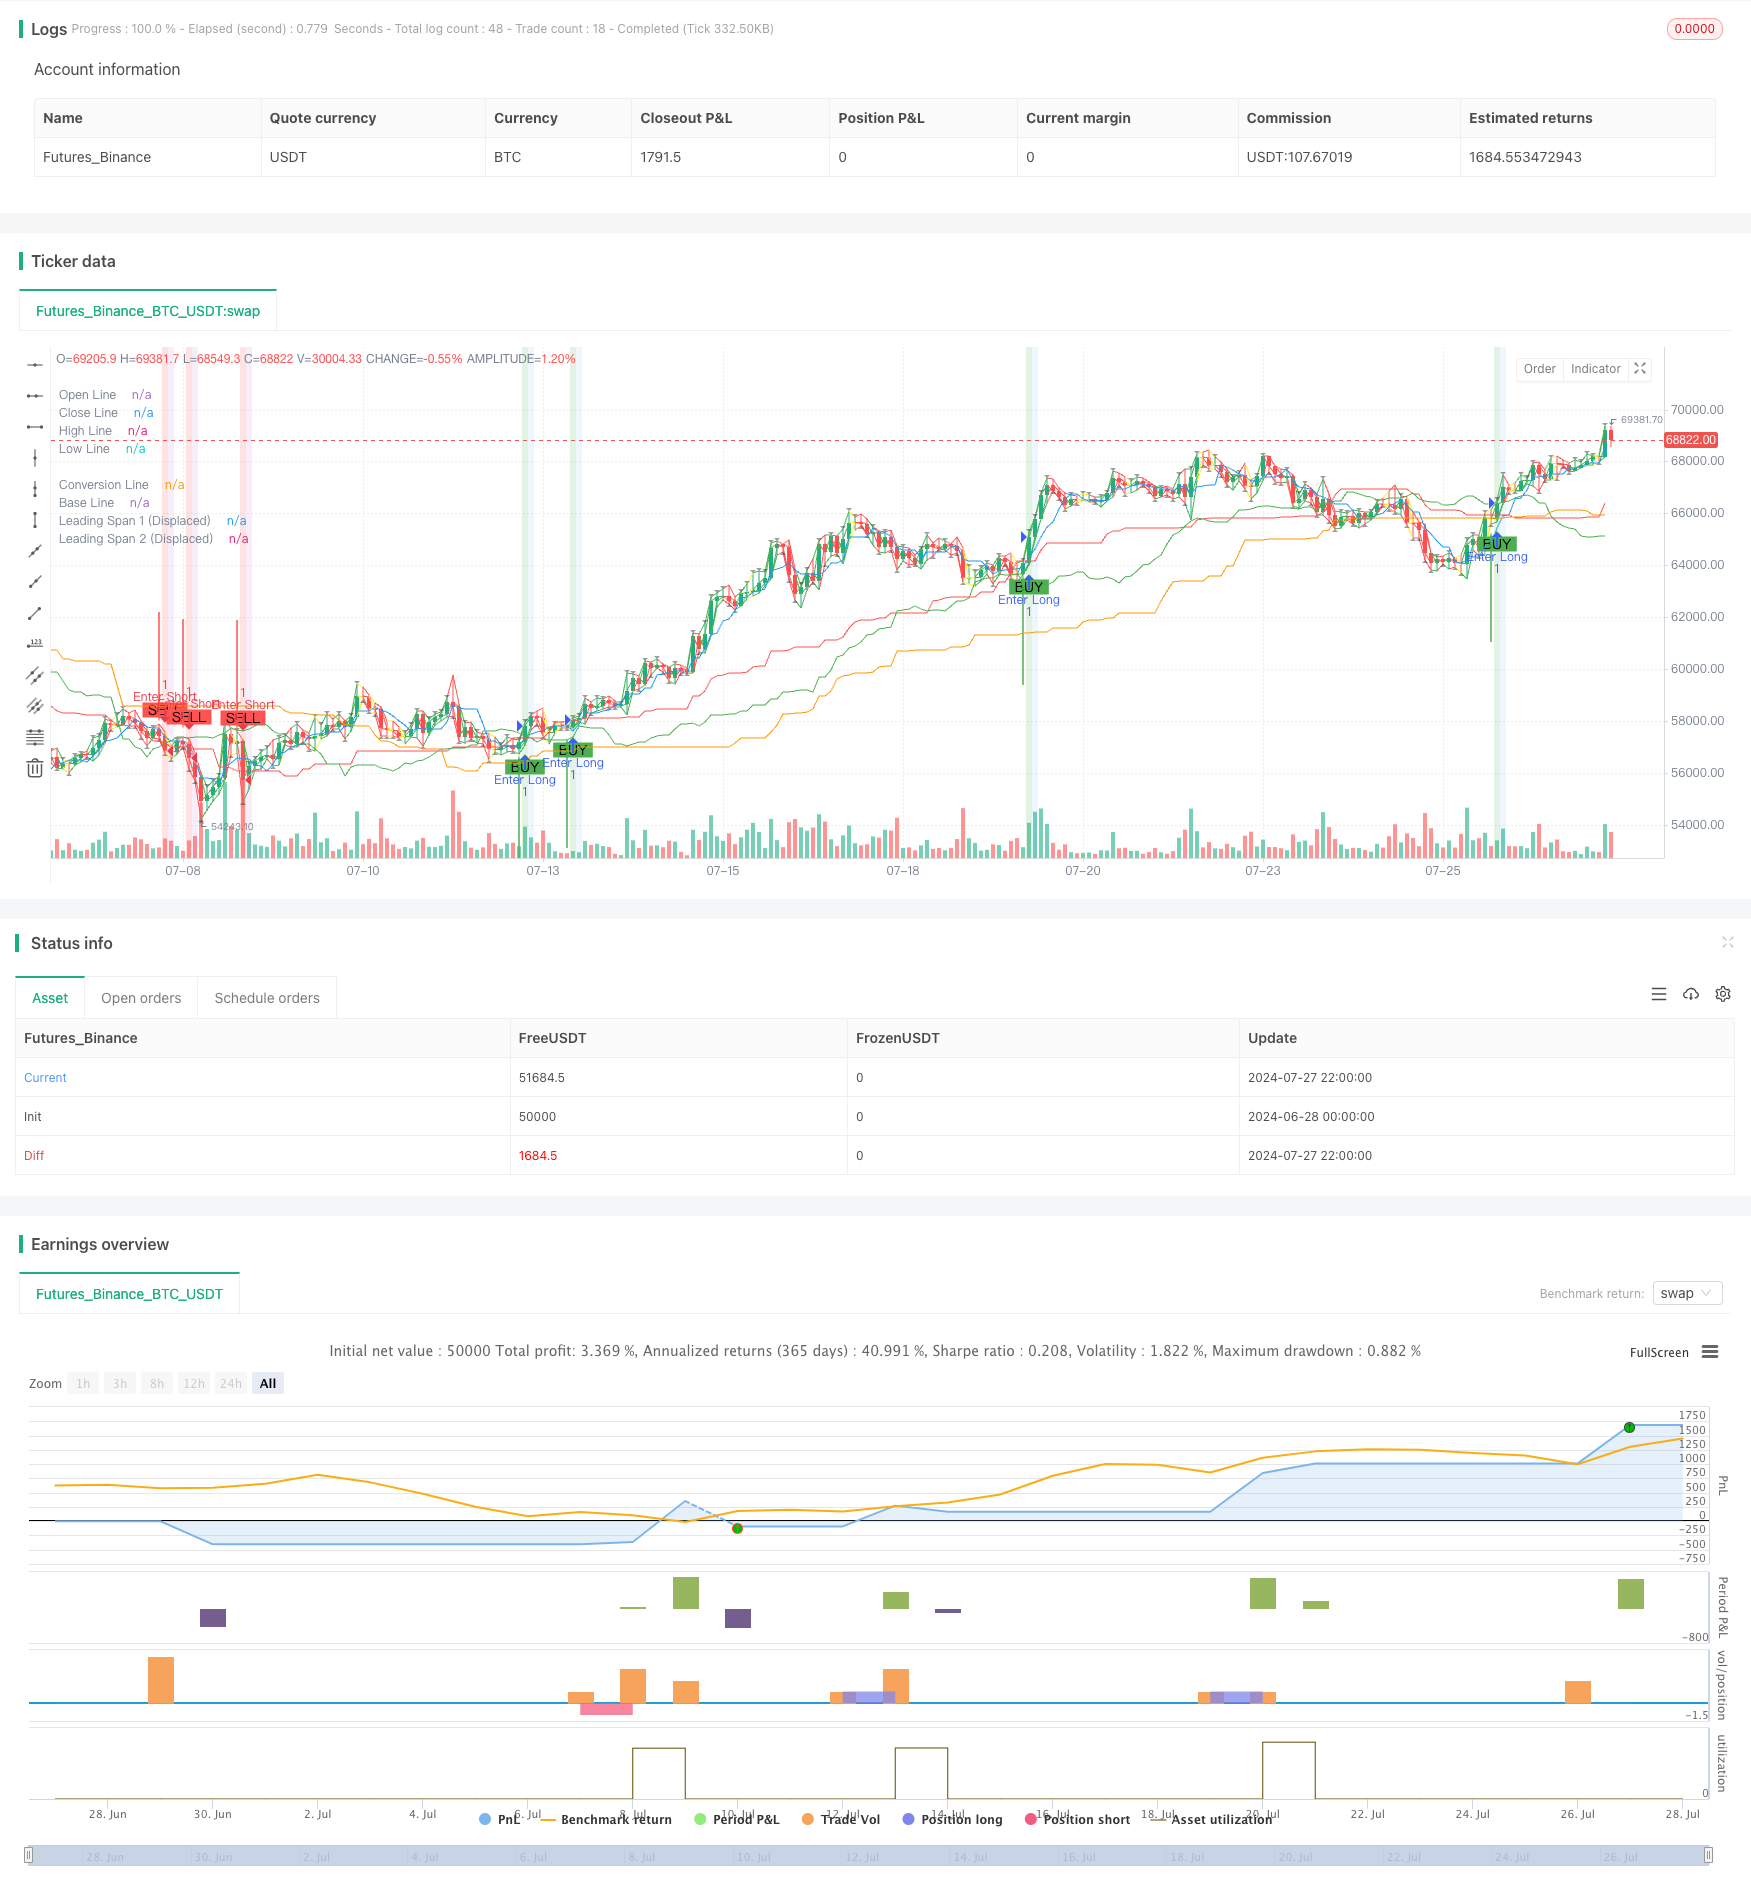
魔法通道价格行为交易策略是一种先进的技术分析方法,结合了经典的通道分析和现代指标技术。该策略利用历史价格数据和移动平均线计算关键价格水平,形成动态的交易通道。通过分析价格与这些通道水平之间的相互作用,策略能够生成精确的买入和卖出信号。此外,该策略还集成了自动止损和止盈功能,以有效管理风险。策略的可视化组件包括价格通道显示、交易信号标记以及交易区域的颜色编码,这些都有助于交易者快速识别潜在的交易机会。
策略原理
魔法通道策略的核心是通过计算多个时间周期的价格数据来构建动态价格通道。具体来说:
- 转换线(Conversion Line):使用较短期的价格数据计算,反映短期市场趋势。
- 基准线(Base Line):使用中期价格数据计算,代表中期市场趋势。
- 领先跨度1(Leading Span 1):由转换线和基准线的平均值计算得出,向前位移一定周期,用于预测未来支撑/阻力水平。
- 领先跨度2(Leading Span 2):使用较长期价格数据计算,同样向前位移,与领先跨度1一起形成价格通道。
策略的买入条件是:
- 收盘价高于位移后的领先跨度2
- 位移后的领先跨度1高于位移后的领先跨度2
- 收盘价向上突破基准线
卖出条件则相反:
- 收盘价低于位移后的领先跨度1
- 位移后的领先跨度1低于位移后的领先跨度2
- 收盘价向下突破基准线
策略还通过设置基于百分比的止损和止盈水平来管理风险和锁定利润。此外,策略的可视化部分包括绘制各条通道线、标记买卖信号,以及使用背景色突出显示不同的交易区域。
策略优势
-
多维度分析:通过综合考虑多个时间周期的价格数据,策略能够更全面地把握市场动态,减少假信号。
-
动态适应:价格通道会根据最新的市场数据不断调整,使策略能够适应不同的市场环境。
-
清晰的交易信号:买卖条件明确,结合可视化的信号标记,使交易决策变得直观和简单。
-
内置风险管理:自动设置的止损和止盈orders有助于控制风险,保护利润。
-
高度可视化:通过颜色编码和图形标记,交易者可以快速理解当前市场状况和潜在机会。
-
灵活性:策略参数可以根据不同的交易品种和时间框架进行优化调整。
-
趋势跟踪能力:通过分析价格与不同通道线的关系,策略能够有效捕捉市场趋势。
-
情绪指标:通道的形态和价格在通道中的位置可以反映市场情绪,为交易决策提供额外参考。
策略风险
-
过度交易:在横盘市场中,价格可能频繁突破通道线,导致过多的交易信号和潜在的亏损。
-
滞后性:由于使用了移动平均线和位移,策略在快速变化的市场中可能反应不够及时。
-
假突破:市场噪音可能导致短暂的假突破,触发不必要的交易。
-
参数敏感性:策略的表现高度依赖于选择的参数,不当的参数设置可能导致策略失效。
-
回撤风险:在强势趋势逆转时,策略可能无法及时退出,导致显著回撤。
-
过度依赖技术指标:忽视基本面和宏观经济因素可能导致在重要事件发生时做出错误决策。
-
流动性风险:在流动性较差的市场中,可能难以按照理想价格执行交易,影响策略表现。
为降低这些风险,可以考虑:
- 结合其他技术指标或基本面分析来过滤交易信号
- 优化参数选择,考虑使用自适应参数
- 实施更严格的风险管理措施,如动态调整仓位大小
- 在重要经济数据发布前暂停交易
- 仅在流动性充足的市场中应用策略
策略优化方向
-
自适应参数:考虑引入自适应机制,根据市场波动性自动调整通道周期和位移参数。这可以提高策略在不同市场条件下的适应性。
-
多时间框架分析:整合多个时间框架的信号,以提高交易决策的可靠性。例如,可以要求较大时间框架的趋势方向与交易信号一致。
-
波动性过滤:引入ATR(平均真实范围)指标,在低波动性期间减少或暂停交易,以避免在横盘市场中过度交易。
-
动态止损/止盈:基于ATR或通道宽度动态设置止损和止盈水平,使风险管理更加灵活。
-
趋势强度过滤:加入ADX(平均方向指数)等趋势强度指标,仅在强趋势市场中开仓,提高策略的胜率。
-
情绪指标整合:考虑结合RSI(相对强弱指数)或MACD(移动平均收敛/发散)等指标,以更好地评估市场超买或超卖状况。
-
机器学习优化:使用机器学习算法优化参数选择和信号生成,提高策略的预测准确性。
-
回测和前向测试:进行更全面的回测,包括不同市场和时期,并进行前向测试,以验证策略的稳健性。
-
资金管理优化:实施更复杂的资金管理策略,如基于凯利准则的仓位sizing,以优化长期收益。
-
事件驱动整合:考虑在重要经济数据发布前调整策略行为,如暂停交易或调整参数。
这些优化方向旨在提高策略的适应性、稳定性和盈利能力,同时减少潜在风险。实施这些优化时,需要谨慎测试每项更改对策略整体表现的影响。
总结
魔法通道价格行为交易策略是一个综合性的技术分析工具,通过动态价格通道和清晰的交易规则为交易者提供了一个强大的决策框架。它结合了传统的通道分析技术与现代的风险管理方法,能够适应不同的市场环境。策略的优势在于其多维度分析、清晰的信号生成和内置的风险管理机制,这些特性使其成为一个潜在的有效交易工具。
然而,像所有交易策略一样,它也面临着一些固有的风险,如过度交易和参数敏感性等问题。为了充分发挥策略的潜力,交易者需要深入理解其原理,谨慎选择参数,并在实际应用中不断优化。
通过提出的优化方向,如引入自适应参数、多时间框架分析和机器学习技术,策略有望进一步提升其性能。这些优化不仅可以增强策略的适应性和稳健性,还可能打开新的研究方向,推动量化交易策略的发展。
总的来说,魔法通道价格行为交易策略为交易者提供了一个结构化的方法来分析和参与市场。通过持续的研究、测试和优化,它有潜力成为交易者工具箱中的一个有价值的资产。然而,使用者仍需谨记,没有完美的策略,合理的风险管理和持续的学习态度始终是成功交易的关键。
||
Overview
The Magic Channel Price Action Trading Strategy is an advanced technical analysis method that combines classic channel analysis with modern indicator techniques. This strategy utilizes historical price data and moving averages to calculate key price levels, forming a dynamic trading channel. By analyzing the interaction between price and these channel levels, the strategy can generate precise buy and sell signals. Additionally, the strategy incorporates automatic stop-loss and take-profit functionality for effective risk management. The strategy's visualization components include price channel display, trade signal markers, and color-coded trading zones, all of which help traders quickly identify potential trading opportunities.
Strategy Principles
The core of the Magic Channel strategy is to construct dynamic price channels by calculating price data over multiple time periods. Specifically:
- Conversion Line: Calculated using short-term price data, reflecting short-term market trends.
- Base Line: Calculated using medium-term price data, representing medium-term market trends.
- Leading Span 1: Derived from the average of the Conversion and Base Lines, displaced forward by a certain period to predict future support/resistance levels.
- Leading Span 2: Calculated using longer-term price data, also displaced forward, forming a price channel together with Leading Span 1.
The buy conditions for the strategy are:
- Closing price is above the displaced Leading Span 2
- Displaced Leading Span 1 is above displaced Leading Span 2
- Closing price breaks above the Base Line
Sell conditions are the opposite:
- Closing price is below the displaced Leading Span 1
- Displaced Leading Span 1 is below displaced Leading Span 2
- Closing price breaks below the Base Line
The strategy also manages risk and locks in profits by setting percentage-based stop-loss and take-profit levels. Furthermore, the strategy's visualization includes plotting various channel lines, marking buy and sell signals, and using background colors to highlight different trading zones.
Strategy Advantages
-
Multi-dimensional Analysis: By considering price data across multiple time periods, the strategy can capture market dynamics more comprehensively, reducing false signals.
-
Dynamic Adaptation: The price channels continuously adjust based on the latest market data, allowing the strategy to adapt to different market environments.
-
Clear Trading Signals: With well-defined buy and sell conditions, combined with visualized signal markers, trading decisions become intuitive and straightforward.
-
Built-in Risk Management: Automatically set stop-loss and take-profit orders help control risk and protect profits.
-
Highly Visual: Through color coding and graphical markers, traders can quickly understand current market conditions and potential opportunities.
-
Flexibility: Strategy parameters can be optimized and adjusted for different trading instruments and timeframes.
-
Trend Following Capability: By analyzing the relationship between price and different channel lines, the strategy can effectively capture market trends.
-
Sentiment Indicator: The formation of channels and price position within them can reflect market sentiment, providing additional reference for trading decisions.
Strategy Risks
-
Overtrading: In ranging markets, price may frequently break channel lines, leading to excessive trading signals and potential losses.
-
Lag: Due to the use of moving averages and displacement, the strategy may not react quickly enough in rapidly changing markets.
-
False Breakouts: Market noise can lead to short-term false breakouts, triggering unnecessary trades.
-
Parameter Sensitivity: The strategy's performance is highly dependent on chosen parameters; inappropriate parameter settings may cause strategy failure.
-
Drawdown Risk: During strong trend reversals, the strategy may not exit positions in time, leading to significant drawdowns.
-
Over-reliance on Technical Indicators: Ignoring fundamental and macroeconomic factors may lead to incorrect decisions during important events.
-
Liquidity Risk: In less liquid markets, it may be difficult to execute trades at ideal prices, affecting strategy performance.
To mitigate these risks, consider:
- Combining other technical indicators or fundamental analysis to filter trading signals
- Optimizing parameter selection, considering using adaptive parameters
- Implementing stricter risk management measures, such as dynamically adjusting position sizes
- Pausing trading before important economic data releases
- Applying the strategy only in markets with sufficient liquidity
Strategy Optimization Directions
-
Adaptive Parameters: Consider introducing adaptive mechanisms to automatically adjust channel periods and displacement parameters based on market volatility. This can improve the strategy's adaptability under different market conditions.
-
Multi-Timeframe Analysis: Integrate signals from multiple timeframes to increase the reliability of trading decisions. For example, require the trend direction of larger timeframes to align with trading signals.
-
Volatility Filter: Introduce the ATR (Average True Range) indicator to reduce or pause trading during low volatility periods, avoiding overtrading in ranging markets.
-
Dynamic Stop-Loss/Take-Profit: Dynamically set stop-loss and take-profit levels based on ATR or channel width, making risk management more flexible.
-
Trend Strength Filter: Add trend strength indicators like ADX (Average Directional Index) to open positions only in strong trend markets, improving the strategy's win rate.
-
Sentiment Indicator Integration: Consider incorporating indicators like RSI (Relative Strength Index) or MACD (Moving Average Convergence/Divergence) to better assess overbought or oversold market conditions.
-
Machine Learning Optimization: Use machine learning algorithms to optimize parameter selection and signal generation, enhancing the strategy's predictive accuracy.
-
Backtesting and Forward Testing: Conduct more comprehensive backtests across different markets and periods, and perform forward testing to verify the strategy's robustness.
-
Capital Management Optimization: Implement more sophisticated capital management strategies, such as Kelly criterion-based position sizing, to optimize long-term returns.
-
Event-Driven Integration: Consider adjusting strategy behavior before important economic data releases, such as pausing trading or adjusting parameters.
These optimization directions aim to enhance the strategy's adaptability, stability, and profitability while reducing potential risks. When implementing these optimizations, it's crucial to carefully test the impact of each change on the overall performance of the strategy.
Conclusion
The Magic Channel Price Action Trading Strategy is a comprehensive technical analysis tool that provides traders with a powerful decision-making framework through dynamic price channels and clear trading rules. It combines traditional channel analysis techniques with modern risk management methods, capable of adapting to different market environments. The strategy's strengths lie in its multi-dimensional analysis, clear signal generation, and built-in risk management mechanisms, making it a potentially effective trading tool.
However, like all trading strategies, it also faces some inherent risks, such as overtrading and parameter sensitivity issues. To fully leverage the strategy's potential, traders need to deeply understand its principles, carefully select parameters, and continuously optimize in practical applications.
Through the proposed optimization directions, such as introducing adaptive parameters,multi-timeframe analysis, and machine learning techniques, the strategy has the potential to further enhance its performance. These optimizations not only can improve the strategy's adaptability and robustness but may also open up new research directions, pushing forward the development of quantitative trading strategies.
Overall, the Magic Channel Price Action Trading Strategy provides traders with a structured approach to analyze and participate in the market. Through continuous research, testing, and optimization, it has the potential to become a valuable asset in a trader's toolkit. However, users should always remember that there is no perfect strategy, and reasonable risk management and a continuous learning attitude remain key to successful trading.
[/trans]
Source (PineScript)
/*backtest
start: 2024-06-28 00:00:00
end: 2024-07-28 00:00:00
period: 2h
basePeriod: 15m
exchanges: [{"eid":"Futures_Binance","currency":"BTC_USDT"}]
*/

//@version=5
strategy("Magic Channel", shorttitle="Magic Channel", overlay=true)

// Magic channel settings with optimization options
conversionPeriod = input.int(5, title="Conversion Period", minval=1, maxval=20)
basePeriod = input.int(51, title="Base Period", minval=1, maxval=100)
laggingSpanPeriod = input.int(68, title="Lagging Span Period", minval=1, maxval=100)
displace = input.int(21, title="Displacement", minval=1, maxval=30)

// Stoploss and Take Profit settings with more granularity
stoplossPercent = input.float(0.1, title="Stoploss Percentage", minval=0.01) / 100
takeProfitPercent = input.float(0.1, title="Take Profit Percentage", minval=0.01) / 100

// Function definition for Magic channel calculation
computeMagicChannel(period) =>
    (ta.lowest(low, period) + ta.highest(high, period)) / 2

// Calculating the lines
convLine = computeMagicChannel(conversionPeriod)
baseLine = computeMagicChannel(basePeriod)
leadingSpan1 = (convLine + baseLine) / 2
leadingSpan2 = computeMagicChannel(laggingSpanPeriod)
displacedLead1 = leadingSpan1[displace]
displacedLead2 = leadingSpan2[displace]

// Defining entry signals
buyCondition = close > displacedLead2 and displacedLead1 > displacedLead2 and ta.crossover(close, baseLine)
sellCondition = close < displacedLead1 and displacedLead1 < displacedLead2 and ta.crossunder(close, baseLine)

// Executing strategy entries based on signals
if (buyCondition)
    strategy.entry("Enter Long", strategy.long)

if (sellCondition)
    strategy.entry("Enter Short", strategy.short)

// Stoploss and Take Profit conditions
stopLossLong = close * (1 - stoplossPercent)
stopLossShort = close * (1 + stoplossPercent)
takeProfitLong = close * (1 + takeProfitPercent)
takeProfitShort = close * (1 - takeProfitPercent)

// Apply stop-loss and take profit orders
if (strategy.position_size > 0)
    strategy.exit("Exit Long", from_entry="Enter Long", stop=stopLossLong, limit=takeProfitLong)

if (strategy.position_size < 0)
    strategy.exit("Exit Short", from_entry="Enter Short", stop=stopLossShort, limit=takeProfitShort)

// Plotting the Magic Channel lines on the chart
plot(convLine, color=color.blue, title="Conversion Line")
plot(baseLine, color=color.red, title="Base Line")
plot(displacedLead1, color=color.green, title="Leading Span 1 (Displaced)")
plot(displacedLead2, color=color.orange, title="Leading Span 2 (Displaced)")

// Highlighting buy and sell signals on the chart
plotshape(series=buyCondition, location=location.belowbar, color=color.green, style=shape.labelup, title="Buy Signal", text="BUY")
plotshape(series=sellCondition, location=location.abovebar, color=color.red, style=shape.labeldown, title="Sell Signal", text="SELL")

// Adding gradient background colors
bgcolor(buyCondition ? color.new(color.green, 80) : na, title="Buy Zone Background")
bgcolor(sellCondition ? color.new(color.red, 80) : na, title="Sell Zone Background")

// Fancy Candle Colors with Borders (Workaround)
bullishColor = color.new(color.green, 0)  // Bright green for bullish candles
bearishColor = color.new(color.red, 0)    // Bright red for bearish candles
dojiColor = color.new(color.yellow, 0)    // Yellow for doji candles
borderColor = color.new(color.black, 50)  // Semi-transparent black for borders

isBullish = close > open
isBearish = close < open
isDoji = math.abs(close - open) < (high - low) * 0.1

candleColor = isDoji ? dojiColor : (isBullish ? bullishColor : bearishColor)

// Plotting Candles
plot(open, color=candleColor, style=plot.style_linebr, linewidth=1, title="Open Line")
plot(close, color=candleColor, style=plot.style_linebr, linewidth=1, title="Close Line")
plot(high, color=candleColor, style=plot.style_linebr, linewidth=1, title="High Line")
plot(low, color=candleColor, style=plot.style_linebr, linewidth=1, title="Low Line")

// Draw borders and candle bodies using plotshape
plotshape(series=isBullish ? high : na, location=location.absolute, color=borderColor, style=shape.triangledown, size=size.small, title="Bullish Border")
plotshape(series=isBearish ? low : na, location=location.absolute, color=borderColor, style=shape.triangleup, size=size.small, title="Bearish Border")

// Trend Arrows
plotarrow(series=buyCondition ? 1 : sellCondition ? -1 : na, colorup=color.green, colordown=color.red, offset=-1, title="Trend Arrows")

// Optional: Overlay Background color based on overall trend or conditions
bgcolor(strategy.position_size > 0 ? color.new(color.blue, 90) : na, title="Long Position Background")
bgcolor(strategy.position_size < 0 ? color.new(color.purple, 90) : na, title="Short Position Background")

// Enhanced Alerts
alertcondition(buyCondition, title="Buy Alert", message="Buy signal detected at {{ticker}} on {{time}}. Conditions met: Close > Displaced Lead 2, Displaced Lead 1 > Displaced Lead 2, Close crossover Base Line.")
alertcondition(sellCondition, title="Sell Alert", message="Sell signal detected at {{ticker}} on {{time}}. Conditions met: Close < Displaced Lead 1, Displaced Lead 1 < Displaced Lead 2, Close crossunder Base Line.")
Detail
https://www.fmz.com/strategy/458067
Last Modified
2024-07-29 16:53:37