
9.6 KiB
Name
MOST与双均线交叉策略-MOST-and-Dual-Moving-Average-Crossover-Strategy
Author
ChaoZhang
Strategy Description
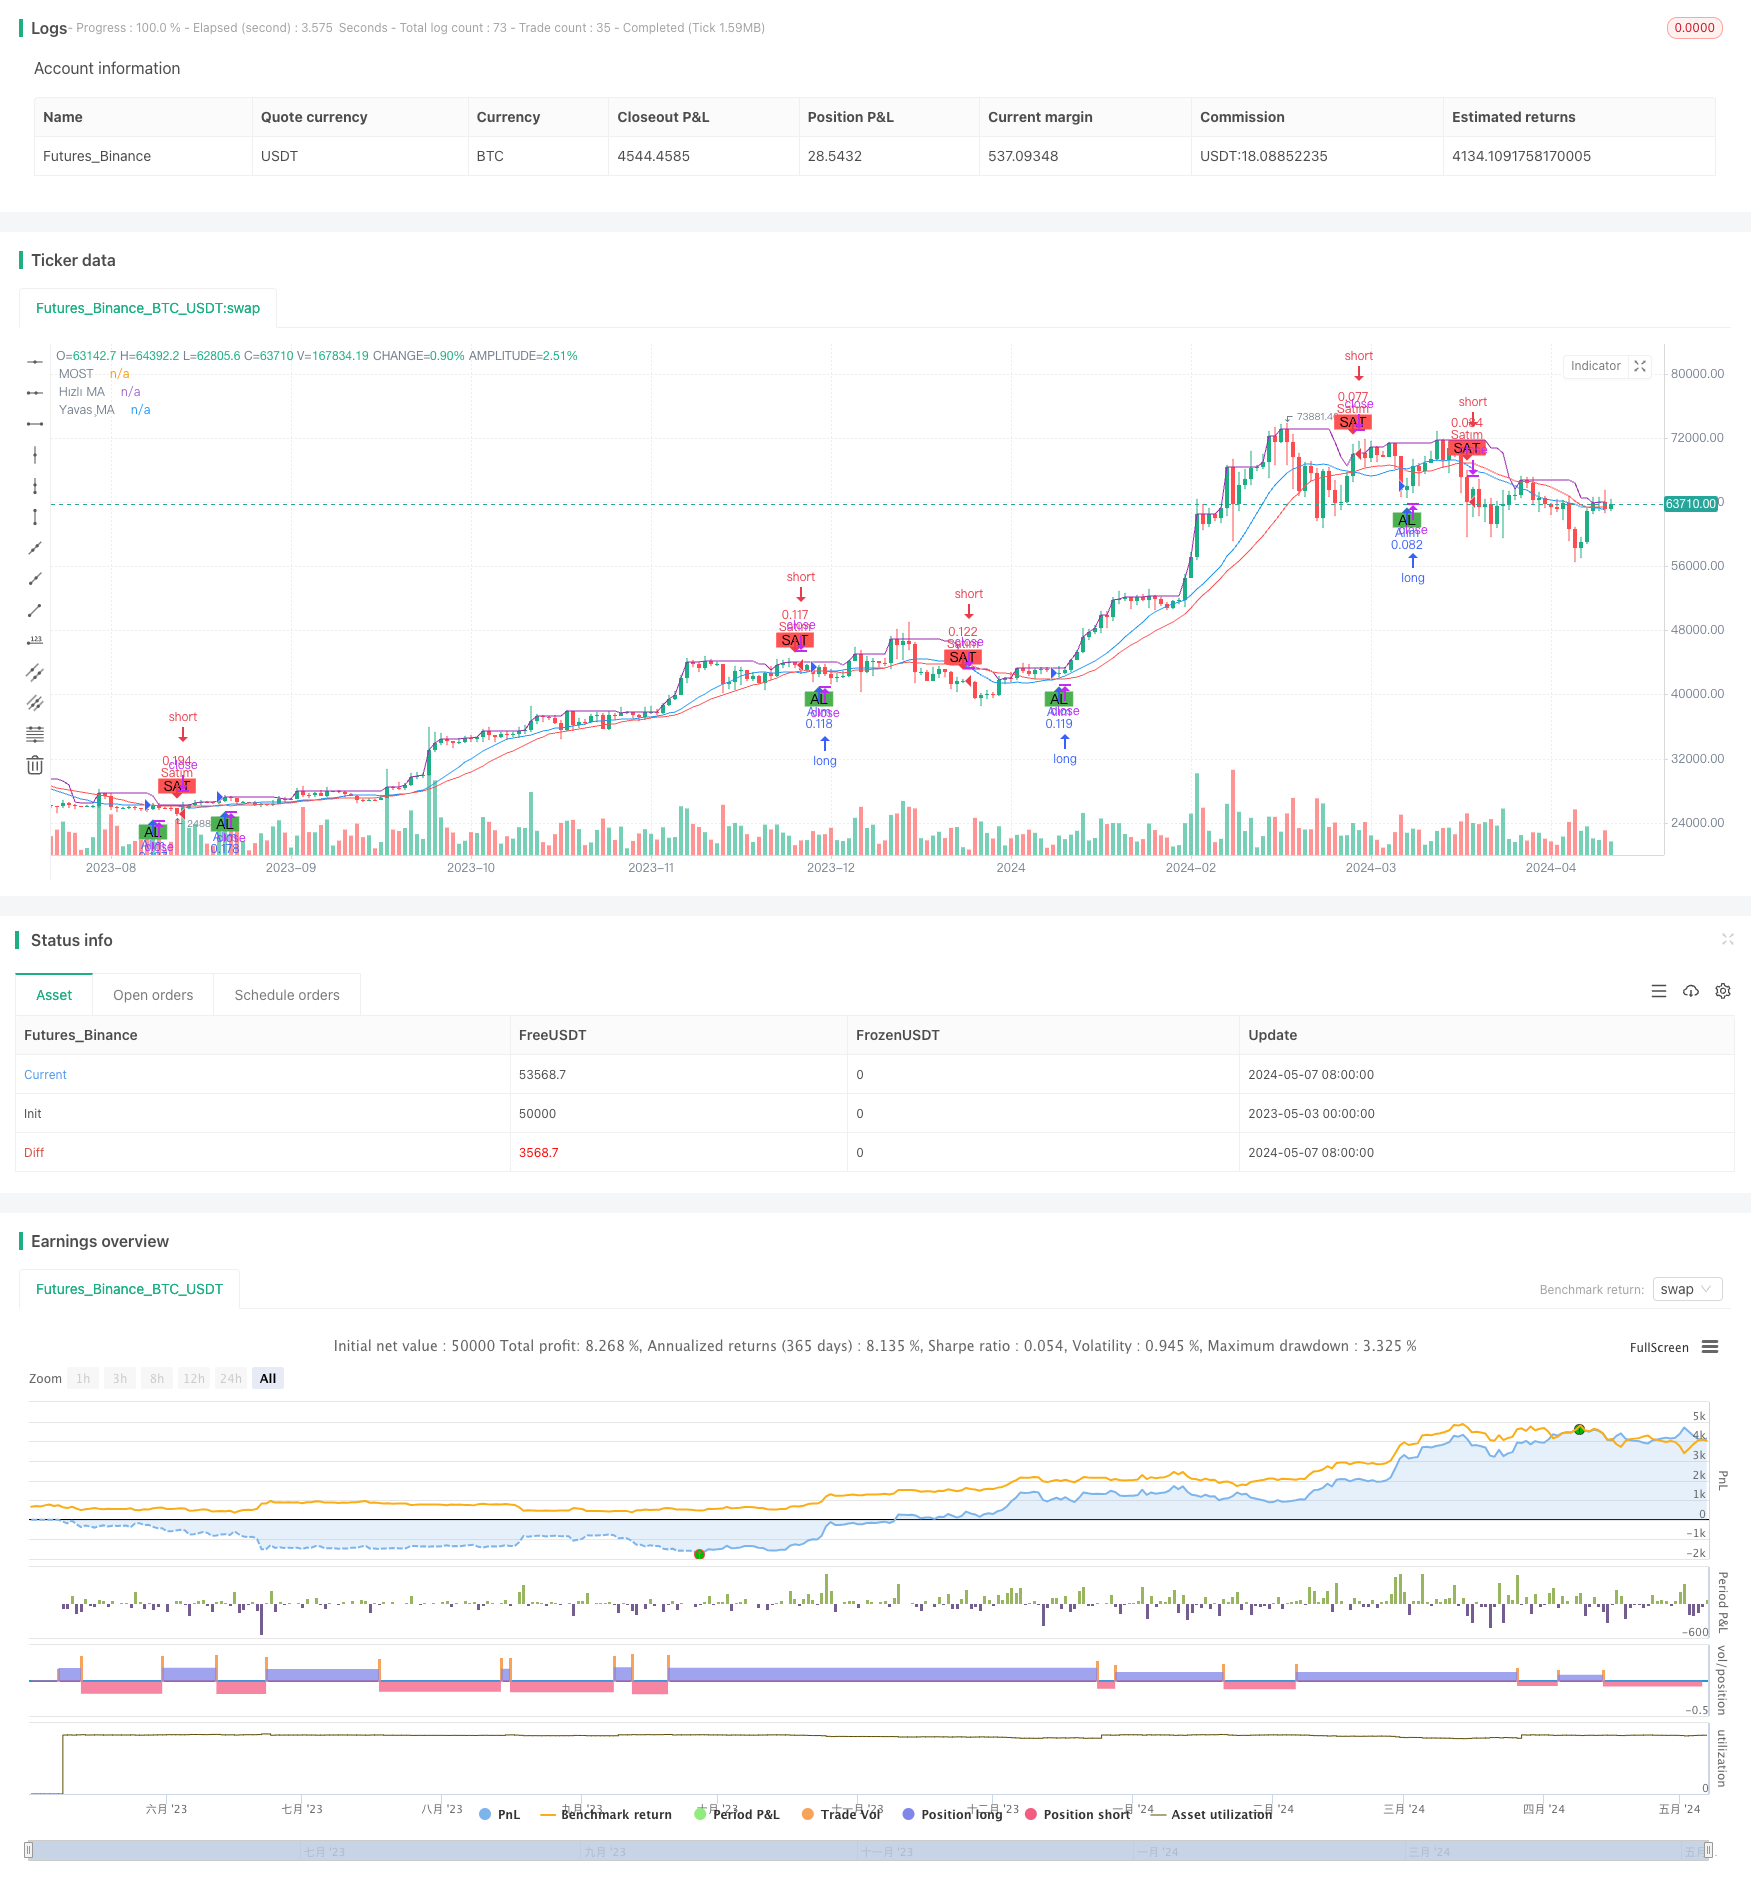
[trans]
概述
MOST与双均线交叉策略是一种结合了多个技术指标的量化交易策略。该策略利用了两条不同周期的移动平均线(MA)的交叉信号,以及MOST指标对价格的超买超卖状态进行判断,从而产生买卖信号。当快速MA上穿慢速MA时产生买入信号,反之则产生卖出信号。同时,MOST指标用于确认价格的超买超卖状态,以避免在价格波动剧烈时频繁交易。
策略原理
该策略的核心是利用不同周期移动平均线的趋势特性,以及价格的超买超卖状态。具体来说:
- 计算快速MA和慢速MA。快速MA对价格变化更敏感,慢速MA则相对滞后。
- 判断快速MA和慢速MA的相对位置。当快速MA上穿慢速MA时,意味着价格可能进入上升趋势,此时产生买入信号;当快速MA下穿慢速MA时,意味着价格可能进入下降趋势,此时产生卖出信号。
- 利用MOST指标判断价格的超买超卖状态。当价格持续上涨并超过MOST指标时,意味着价格可能处于超买状态,此时应谨慎买入;当价格持续下跌并低于MOST指标时,意味着价格可能处于超卖状态,此时应谨慎卖出。
通过结合MA交叉信号和MOST指标,该策略能够较好地把握价格趋势,并避免在价格波动剧烈时频繁交易。
策略优势
- 趋势跟踪:通过利用不同周期MA的交叉信号,该策略能够较好地把握价格的中长期趋势。
- 减少噪音:通过结合MOST指标对价格超买超卖状态的判断,该策略能够有效过滤价格的短期噪音,避免频繁交易。
- 参数灵活:该策略的参数(如MA周期、MOST周期等)可以根据不同市场和品种进行灵活调整,以适应不同的市场特点。
策略风险
- 参数优化:该策略的表现依赖于参数的选择,如MA周期、MOST周期等。不恰当的参数可能导致策略表现不佳。因此,在实际应用中需要对参数进行优化。
- 市场适应性:该策略在趋势明显的市场中表现较好,但在震荡市场中可能表现不佳。因此,需要根据市场特点对策略进行调整。
- 滑点和交易成本:频繁的交易可能导致较高的滑点和交易成本,从而影响策略的净收益。因此,在实际应用中需要考虑这些因素。
策略优化方向
- 动态参数优化:可以考虑根据市场状态的变化动态调整策略参数,如在趋势明显时使用较长周期的MA,在震荡市场中使用较短周期的MA。
- 止损止盈:可以加入止损止盈机制,以降低单次交易的风险敞口。
- 仓位管理:可以根据市场波动性和风险偏好等因素动态调整仓位,以控制整体风险。
总结
MOST与双均线交叉策略通过结合不同周期MA的交叉信号和MOST指标对价格超买超卖状态的判断,能够较好地把握价格趋势,并避免频繁交易。该策略逻辑清晰,易于实现,并且可以根据不同市场特点进行灵活调整。但在实际应用中,需要注意参数优化、市场适应性、滑点和交易成本等因素。此外,还可以考虑加入动态参数优化、止损止盈、仓位管理等机制,以进一步提升策略的稳健性和盈利能力。
||
Overview
The MOST and Dual Moving Average Crossover Strategy is a quantitative trading strategy that combines multiple technical indicators. The strategy utilizes the crossover signals of two moving averages (MA) with different periods and the MOST indicator to determine overbought and oversold conditions of prices, generating buy and sell signals. A buy signal is generated when the fast MA crosses above the slow MA, and a sell signal is generated when the opposite occurs. At the same time, the MOST indicator is used to confirm the overbought and oversold conditions of prices to avoid frequent trading during volatile price movements.
Strategy Principles
The core of this strategy is to utilize the trend characteristics of moving averages with different periods and the overbought and oversold conditions of prices. Specifically:
- Calculate the fast MA and slow MA. The fast MA is more sensitive to price changes, while the slow MA is relatively lagging.
- Determine the relative position of the fast MA and slow MA. When the fast MA crosses above the slow MA, it suggests that the price may enter an upward trend, generating a buy signal; when the fast MA crosses below the slow MA, it suggests that the price may enter a downward trend, generating a sell signal.
- Use the MOST indicator to determine the overbought and oversold conditions of prices. When the price continues to rise and exceeds the MOST indicator, it suggests that the price may be overbought, and caution should be exercised when buying; when the price continues to fall and is lower than the MOST indicator, it suggests that the price may be oversold, and caution should be exercised when selling.
By combining the MA crossover signals and the MOST indicator, this strategy can better capture price trends and avoid frequent trading during volatile price movements.
Strategy Advantages
- Trend tracking: By utilizing the crossover signals of MAs with different periods, this strategy can better capture the medium and long-term trends of prices.
- Noise reduction: By combining the MOST indicator to determine overbought and oversold conditions of prices, this strategy can effectively filter out short-term noise in prices and avoid frequent trading.
- Parameter flexibility: The parameters of this strategy (such as MA periods, MOST period, etc.) can be flexibly adjusted according to different markets and instruments to adapt to different market characteristics.
Strategy Risks
- Parameter optimization: The performance of this strategy depends on the selection of parameters, such as MA periods, MOST period, etc. Inappropriate parameters may lead to poor strategy performance. Therefore, parameter optimization is necessary for practical application.
- Market adaptability: This strategy performs well in markets with obvious trends but may perform poorly in range-bound markets. Therefore, the strategy needs to be adjusted according to market characteristics.
- Slippage and transaction costs: Frequent trading may lead to high slippage and transaction costs, affecting the net return of the strategy. Therefore, these factors need to be considered in practical application.
Strategy Optimization Directions
- Dynamic parameter optimization: Consider dynamically adjusting strategy parameters according to changes in market conditions, such as using longer-period MAs during obvious trends and shorter-period MAs in range-bound markets.
- Stop-loss and take-profit: Add stop-loss and take-profit mechanisms to reduce the risk exposure of a single trade.
- Position management: Dynamically adjust positions based on factors such as market volatility and risk preferences to control overall risk.
Summary
The MOST and Dual Moving Average Crossover Strategy combines the crossover signals of MAs with different periods and the MOST indicator's determination of overbought and oversold conditions of prices, allowing for better capture of price trends and avoidance of frequent trading. The strategy is logical, easy to implement, and can be flexibly adjusted according to different market characteristics. However, in practical application, factors such as parameter optimization, market adaptability, slippage, and transaction costs need to be considered. In addition, mechanisms such as dynamic parameter optimization, stop-loss and take-profit, and position management can be added to further improve the robustness and profitability of the strategy. [/trans]
Strategy Arguments
| Argument | Default | Description |
|---|---|---|
| v_input_int_1 | 14 | Hızlı MA Uzunluğu |
| v_input_int_2 | 21 | Yavaş MA Uzunluğu |
| v_input_int_3 | 9 | MOST Uzunluğu |
Source (PineScript)
/*backtest
start: 2023-05-03 00:00:00
end: 2024-05-08 00:00:00
period: 1d
basePeriod: 1h
exchanges: [{"eid":"Futures_Binance","currency":"BTC_USDT"}]
*/

//@version=5
strategy("MOST ve Hareketli Ortalama Kesişimleri", overlay=true, default_qty_type=strategy.percent_of_equity, default_qty_value=10)

// Girdi parametrelerini tanımlayın
fastMALength = input.int(title="Hızlı MA Uzunluğu", defval=14, minval=1)
slowMALength = input.int(title="Yavaş MA Uzunluğu", defval=21, minval=1)
mostLength = input.int(title="MOST Uzunluğu", defval=9, minval=1)

// Hareketli ortalamaları hesaplayın
fastMA = ta.sma(close, fastMALength)
slowMA = ta.sma(close, slowMALength)

// MOST'u hesaplayın
most = ta.highest(close, mostLength)

// Alım ve satım sinyallerini oluşturun
buySignal = ta.crossover(fastMA, slowMA)
sellSignal = ta.crossunder(fastMA, slowMA)

// Uzun ve kısa pozisyonlar için giriş koşulları
if (buySignal)
    strategy.entry("Alım", strategy.long)  // Alım sinyalinde uzun pozisyon girin

if (sellSignal)
    strategy.entry("Satım", strategy.short)  // Satım sinyalinde kısa pozisyon girin

// Göstergeleri ve sinyalleri çizin
plotshape(buySignal, title="Alım Sinyali", location=location.belowbar, color=color.green, style=shape.labelup, text="AL")
plotshape(sellSignal, title="Satım Sinyali", location=location.abovebar, color=color.red, style=shape.labeldown, text="SAT")
plot(fastMA, title="Hızlı MA", color=color.blue)
plot(slowMA, title="Yavaş MA", color=color.red)
plot(most, title="MOST", color=color.purple)
Detail
https://www.fmz.com/strategy/450860
Last Modified
2024-05-09 16:23:21