
7.7 KiB
Name
MACD结合阿尔布鲁克斯价格行为的趋势跟踪策略-MACD-Based-Al-Brooks-Price-Action-Trend-Following-Strategy
Author
ianzeng123
Strategy Description
[trans]
概述
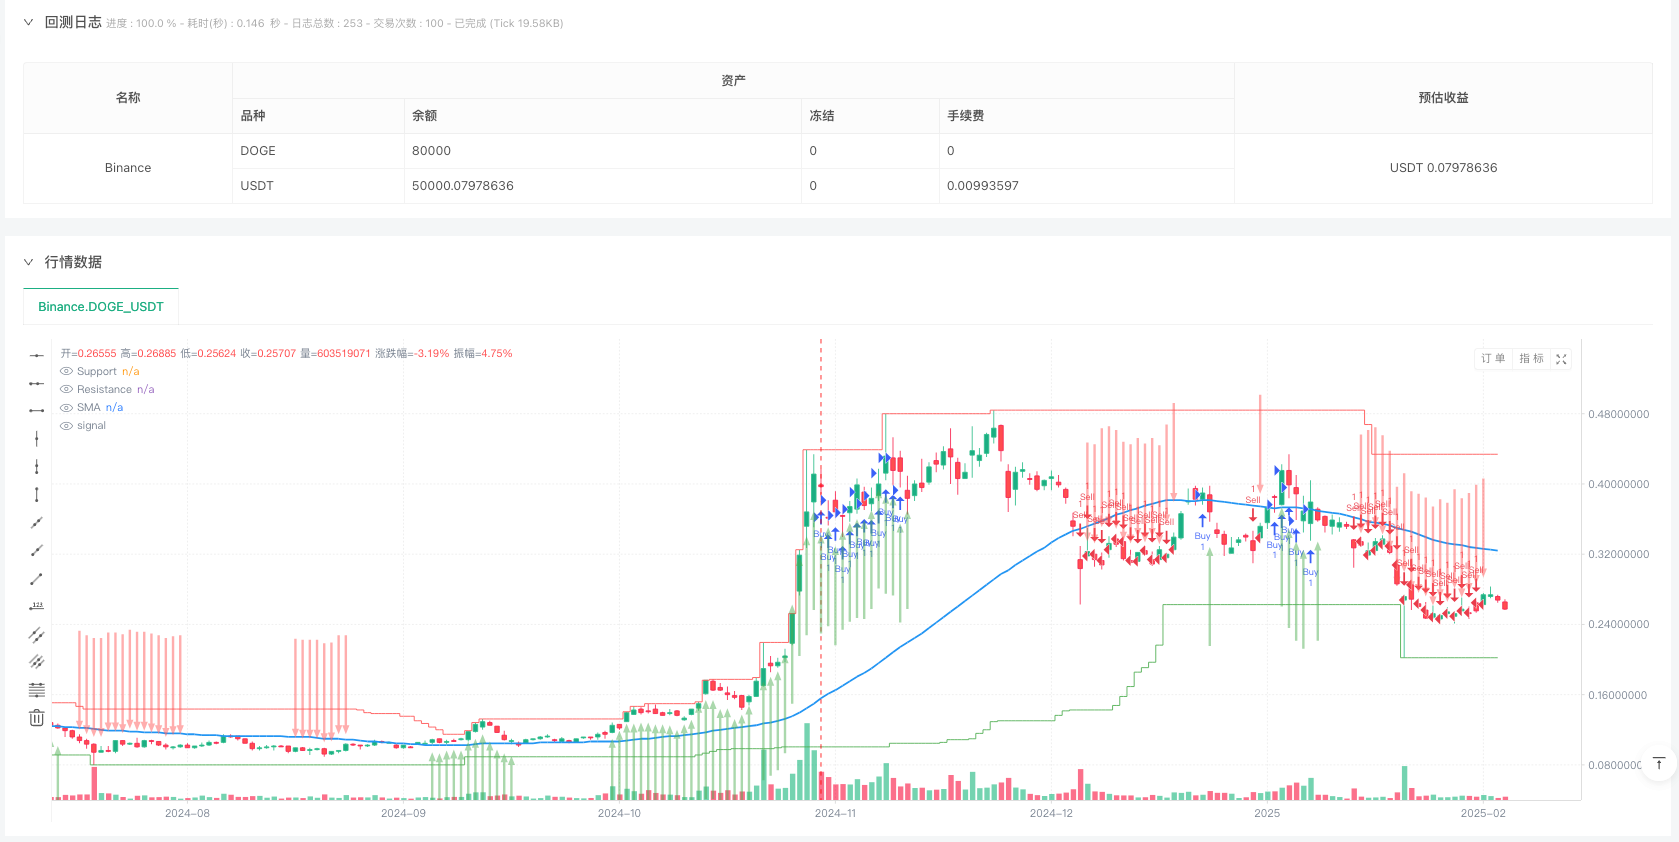
该策略是一个基于阿尔布鲁克斯价格行为理论和MACD指标的趋势跟踪交易系统。它通过结合移动平均线(SMA)和MACD指标来识别市场趋势,并在合适的时机进行交易。策略采用固定的风险收益比来管理每笔交易的止损和止盈水平,实现风险的有效控制。
策略原理
策略的核心逻辑包含以下几个关键要素:
- 趋势判断:使用简单移动平均线(SMA)作为趋势判断的基准,当价格在SMA之上时判断为上涨趋势,反之为下跌趋势。
- 入场信号:
- 做多条件:价格在SMA之上,MACD线大于0且上穿信号线
- 做空条件:价格在SMA之下,MACD线小于0且下穿信号线
- 风险管理:
- 使用固定百分比作为止损缓冲区
- 基于预设的风险收益比计算止盈位置
- 退出机制:当买入或卖出信号消失时,自动平仓已有持仓
策略优势
- 趋势跟踪的可靠性:结合了价格行为和技术指标,提高了趋势判断的准确性
- 风险控制的科学性:采用固定风险收益比的方式管理每笔交易
- 信号确认的全面性:通过多重条件确认,减少虚假信号
- 自动化程度高:包含完整的入场、出场和风险管理机制
- 可视化效果好:提供了清晰的支撑位和阻力位显示
策略风险
- 趋势反转风险:在趋势转折点可能会产生连续的虚假信号
- 滞后性风险:移动平均线和MACD都具有一定的滞后性
- 参数敏感性:策略效果对参数设置较为敏感
- 市场环境依赖:在震荡市场中可能会产生较多亏损交易
策略优化方向
- 信号过滤:可以添加成交量或波动率指标来过滤信号
- 动态参数:将固定的风险收益比改为基于市场波动率的动态参数
- 时间过滤:增加交易时间窗口的限制,避免在不适合的时间段交易
- 增加市场情绪指标:引入市场情绪指标来辅助判断趋势的强弱
总结
这是一个将经典的价格行为理论与技术指标相结合的完整交易系统。策略通过严格的信号确认机制和风险管理方法,实现了相对稳健的交易效果。虽然存在一些固有的风险,但通过建议的优化方向可以进一步提升策略的稳定性和盈利能力。 ||
Overview
This strategy is a trend-following trading system based on Al Brooks' price action theory and the MACD indicator. It identifies market trends by combining Simple Moving Average (SMA) and MACD indicators, executing trades at appropriate times. The strategy employs a fixed risk-reward ratio to manage stop-loss and take-profit levels for each trade, ensuring effective risk control.
Strategy Principles
The core logic includes the following key elements:
- Trend Identification: Uses Simple Moving Average (SMA) as a benchmark for trend determination, identifying uptrends when price is above SMA and downtrends when below.
- Entry Signals:
- Long Entry: Price above SMA, MACD line above 0 and crosses above signal line
- Short Entry: Price below SMA, MACD line below 0 and crosses below signal line
- Risk Management:
- Uses fixed percentage as stop-loss buffer
- Calculates take-profit levels based on preset risk-reward ratio
- Exit Mechanism: Automatically closes positions when buy or sell signals disappear
Strategy Advantages
- Trend Following Reliability: Combines price action and technical indicators for improved trend accuracy
- Scientific Risk Control: Implements fixed risk-reward ratio for trade management
- Comprehensive Signal Confirmation: Reduces false signals through multiple condition verification
- High Automation Level: Includes complete entry, exit, and risk management mechanisms
- Excellent Visualization: Provides clear support and resistance level display
Strategy Risks
- Trend Reversal Risk: May generate consecutive false signals at trend turning points
- Lag Risk: Both moving average and MACD have inherent lag
- Parameter Sensitivity: Strategy performance is sensitive to parameter settings
- Market Environment Dependency: May generate more losing trades in ranging markets
Strategy Optimization Directions
- Signal Filtering: Add volume or volatility indicators to filter signals
- Dynamic Parameters: Convert fixed risk-reward ratio to dynamic parameters based on market volatility
- Time Filtering: Add trading time window restrictions to avoid unfavorable trading periods
- Market Sentiment Integration: Incorporate market sentiment indicators to assist in trend strength assessment
Summary
This is a complete trading system that combines classical price action theory with technical indicators. The strategy achieves relatively stable trading performance through strict signal confirmation mechanisms and risk management methods. While there are some inherent risks, the suggested optimization directions can further enhance the strategy's stability and profitability.[/trans]
Source (PineScript)
/*backtest
start: 2024-11-15 00:00:00
end: 2025-02-18 00:00:00
period: 1d
basePeriod: 1d
exchanges: [{"eid":"Binance","currency":"DOGE_USDT"}]
*/

// This Pine Script™ code is subject to the terms of the Mozilla Public License 2.0 at https://mozilla.org/MPL/2.0/
// © Abdulhossein

//@version=6
strategy(title="Al Brooks Price Action with MACD Signals", shorttitle="Al Brooks PA + MACD", overlay=true)

// Inputs
length = input.int(52, title="Moving Average Length", minval=1)
riskRewardRatio = input.float(2.0, title="Risk/Reward Ratio", minval=1.0)
stopLossBuffer = input.float(0.01, title="Stop Loss Buffer (in %)", minval=0.001)
candleType = input.string("Close", title="Candle Type", options=["Close", "Open"])

// Indicators
sma = ta.sma(close, length)
[macdLine, signalLine, _] = ta.macd(close, 12, 26, 9)
price = candleType == "Close" ? close : open

// Trend Conditions
uptrend = price > sma
downtrend = price < sma

// Buy/Sell Signals
buySignal = price > sma and macdLine > 0 and macdLine > signalLine
sellSignal = price < sma and macdLine < 0 and macdLine < signalLine

// Trade Execution
if (buySignal)
    longStopLoss = close * (1 - stopLossBuffer)
    longTakeProfit = close + (close - longStopLoss) * riskRewardRatio
    strategy.entry("Buy", strategy.long)
    strategy.exit("Take Profit", "Buy", limit=longTakeProfit, stop=longStopLoss)

if (sellSignal)
    shortStopLoss = close * (1 + stopLossBuffer)
    shortTakeProfit = close - (shortStopLoss - close) * riskRewardRatio
    strategy.entry("Sell", strategy.short)
    strategy.exit("Take Profit", "Sell", limit=shortTakeProfit, stop=shortStopLoss)

// Plot Signals
plotarrow(buySignal[2] ? 1 : na, colorup=color.new(color.green, 50), title="Buy Signal Arrow", offset=-1)
plotarrow(sellSignal[2] ? -1 : na, colordown=color.new(color.red, 50), title="Sell Signal Arrow", offset=-1)

// Close Positions
if (not buySignal and not sellSignal)
    strategy.close("Sell")
    strategy.close("Buy")

// Support and Resistance
support = ta.lowest(low, length)
resistance = ta.highest(high, length)
plot(support, title="Support", color=color.green, linewidth=1, style=plot.style_stepline)
plot(resistance, title="Resistance", color=color.red, linewidth=1, style=plot.style_stepline)
plot(sma, title="SMA", color=color.blue, linewidth=2)

// Alerts
alertcondition(buySignal[2], title="Buy Alert", message="Buy Signal Triggered")
alertcondition(sellSignal[2], title="Sell Alert", message="Sell Signal Triggered")
Detail
https://www.fmz.com/strategy/482678
Last Modified
2025-02-19 17:36:15